1371
Decoupling of brain activity from connectome in multiple sclerosis and neuromyelitis optica1Department of Electronic and Information Engineering, Harbin Institute of Technology at Shenzhen, Shenzhen, China, 2Department of Radiology, Xuanwu Hospital Capital Medical University, Beijing, China, 3Shenzhen MindsGo Life Technology Co.Ltd, Shenzhen, China, 4Advanced Innovation Center for Human Brain Protection, Capital Medical University, Beijing, China, 5Peng Cheng Laboratory, Shenzhen, China, 6National Clinical Research Center for Geriatric Disorders, Xuanwu Hospital Capital Medical University, Beijing, China
Synopsis
Coupling of brain functional activity with brain structural network (connectome) plays a key role in cognition and movement. In this study, we anticipated that the structural-functional coupling would be altered in multiple sclerosis (MS) and neuromyelitis optica (NMO). By introducing the graph frequency analysis on diffusion and functional MR images, we found that brain activity in patient with both MS and NMO deviated from the underlying structural network, indicating disrupted structural-functional coupling caused by neuronal inflammation and demyelination.
Introduction
Coupling of brain functional activity with brain structural network (connectome) plays a key role in cognition and movement. Recently, several approaches have been proposed to quantify the interaction between functional activity and connectome based on functional and diffusion MRI data1,2, and demonstrated structural-functional coupling patterns regarding multiple behavioral domains in accordance with prior principles3. However, whether the dependency between functional signals on the underly wiring diagram would be disrupted by neuronal inflammation has been only partly addressed. In this study, we anticipated that the structural-functional coupling would be altered in multiple sclerosis (MS) and neuromyelitis optica (NMO), and introduced a graph frequency analysis to examine our hypothesis.Methods
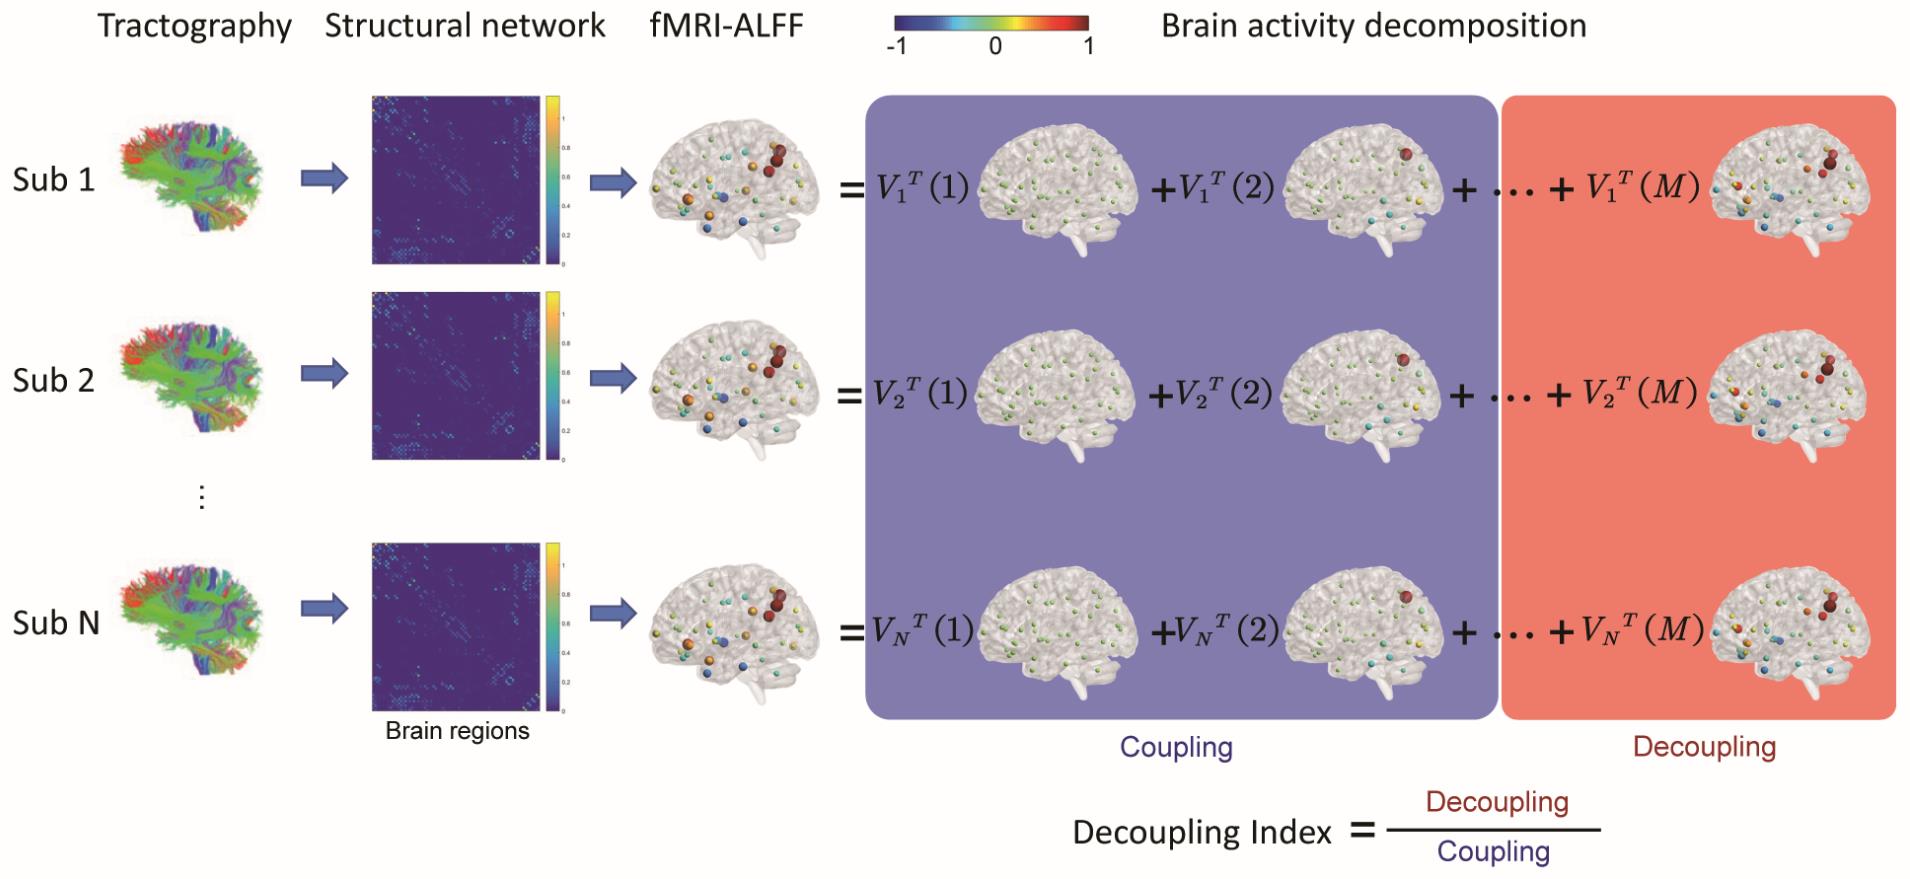
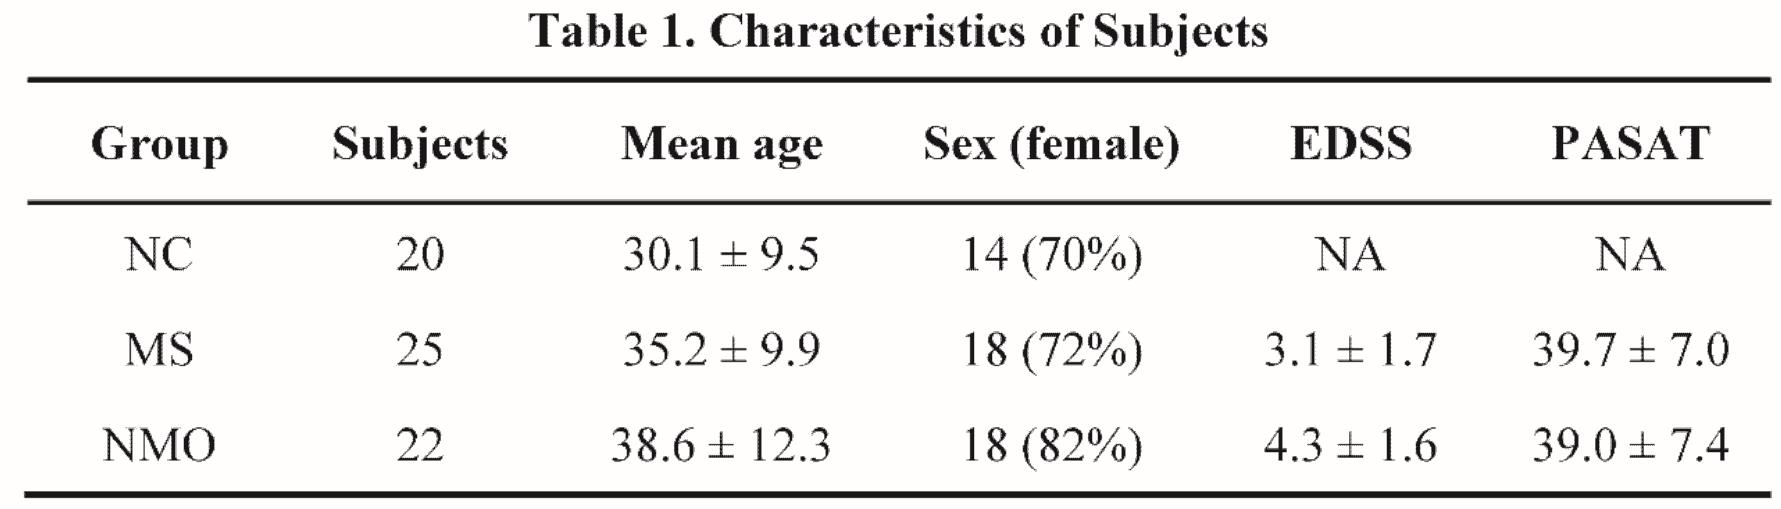
Images from 25 MS and 22 NMO patients along with 20 normal controls (NC) recruited by Xuanwu Hospital of Capital Medical University were selected for this study. Demographic and clinical data obtained for patients included expanded disability status scale (EDSS) and paced auditory serial addition test (PASAT) were summarized in Table 1. All the subjects underwent Siemens TrioTim 3T MR scans with a) MPRAGE sequence (TI/TE/TR = 1000/2.13/1600 ms, FOV = 256 × 256, isotropic voxel size =1 mm, flip angle = 9), b) spin echo EPI sequence (TE/TR = 98/11000 ms, FOV = 256 × 232, flip angle = 90, isotropic voxel size = 2 mm, 60 gradient directions with b = 1000/2000 s/mm2) and c) single-shot gradient-echo T2* (TE/TR = 30/2000 ms, FOV = 220 × 220, matrix = 64 × 64 × 32). The amplitude of low frequency fluctuations (ALFF) was derived from resting-state fMRI images after common preprocessing using DPABI toolbox including slice timing, movement adjustment, Dartel segmentation, nuisance regression and smoothing. Following our previous approach4, the individual tractography was estimated from diffusion MR images using constrained spherical deconvolution (CSD) coupled with a probabilistic streamline algorithm by MRtrix3. To establish a uniform region-based analytical system for multiple MR contrasts, each individual MPRAGE image was automatically segmented through a cloud-based pipeline in a multi-atlas brain parcellation schema (www.brainlabel.org). Then the derived segmented labels were further mapped onto individual diffusion and normalized functional space by linear and nonlinear coregistration respectively. In this way, the symmetric matrix $$$A \in R^{M \times M}$$$ with $$$M=78$$$ nodes was established as an individual brain connectome where each connectivity strength was defined as the normalized number of connecting fibers. The regionally averaged ALFF values after Z-scored $$$\boldsymbol{x}\in R^{M}$$$ were also assessed as brain activity in the following analysis.For the graph frequency analysis, we followed the method in a previous study3 to calculate the regional decoupling index to measure how the connectome could constrain functional activity. Briefly, after eigenvector decomposition of connectome $$$A=V\Lambda V^{T}$$$ where $$$V=\left\{\boldsymbol{v}_{k}\right\}_{k=1}^{M}$$$ denotes the set of associated eigenvectors, we applied graph Fourier transform to convert brain activity $$$x=v \hat{x}$$$ into the spectral representation $$$\hat{x}$$$. Assuming the functional activity $$$\boldsymbol{x}=V^{l o w} V^{T} \boldsymbol{x}+V^{h i g h} V^{T} \boldsymbol{x}$$$ could be decomposed into the coupling portion (i.e. represented by low-frequency eigenvalues) and decoupling portion (i.e. represented by high-frequency eigenvalues), a measure of regional decoupling index (i.e. the ratio between the norm of high-frequency portion and low-frequency portion) was calculated to measure how much the functional activity aligned with or deviated from the connectome. The pipeline diagram of our graph Fourier analysis was shown in Fig.1. ANCOVA with post-hoc analysis was performed to compare the decoupling index across the subject groups adjusted by age, sex and head motion. A p value of 0.01 or less was considered statistically significant.
Results
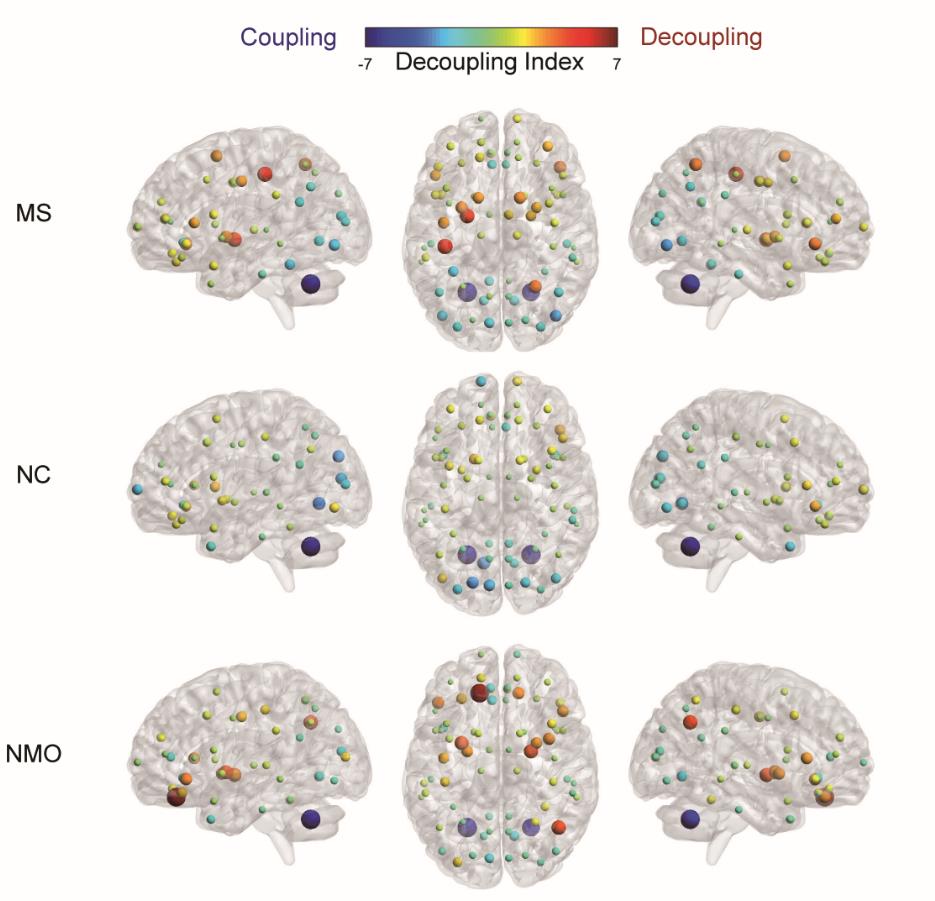
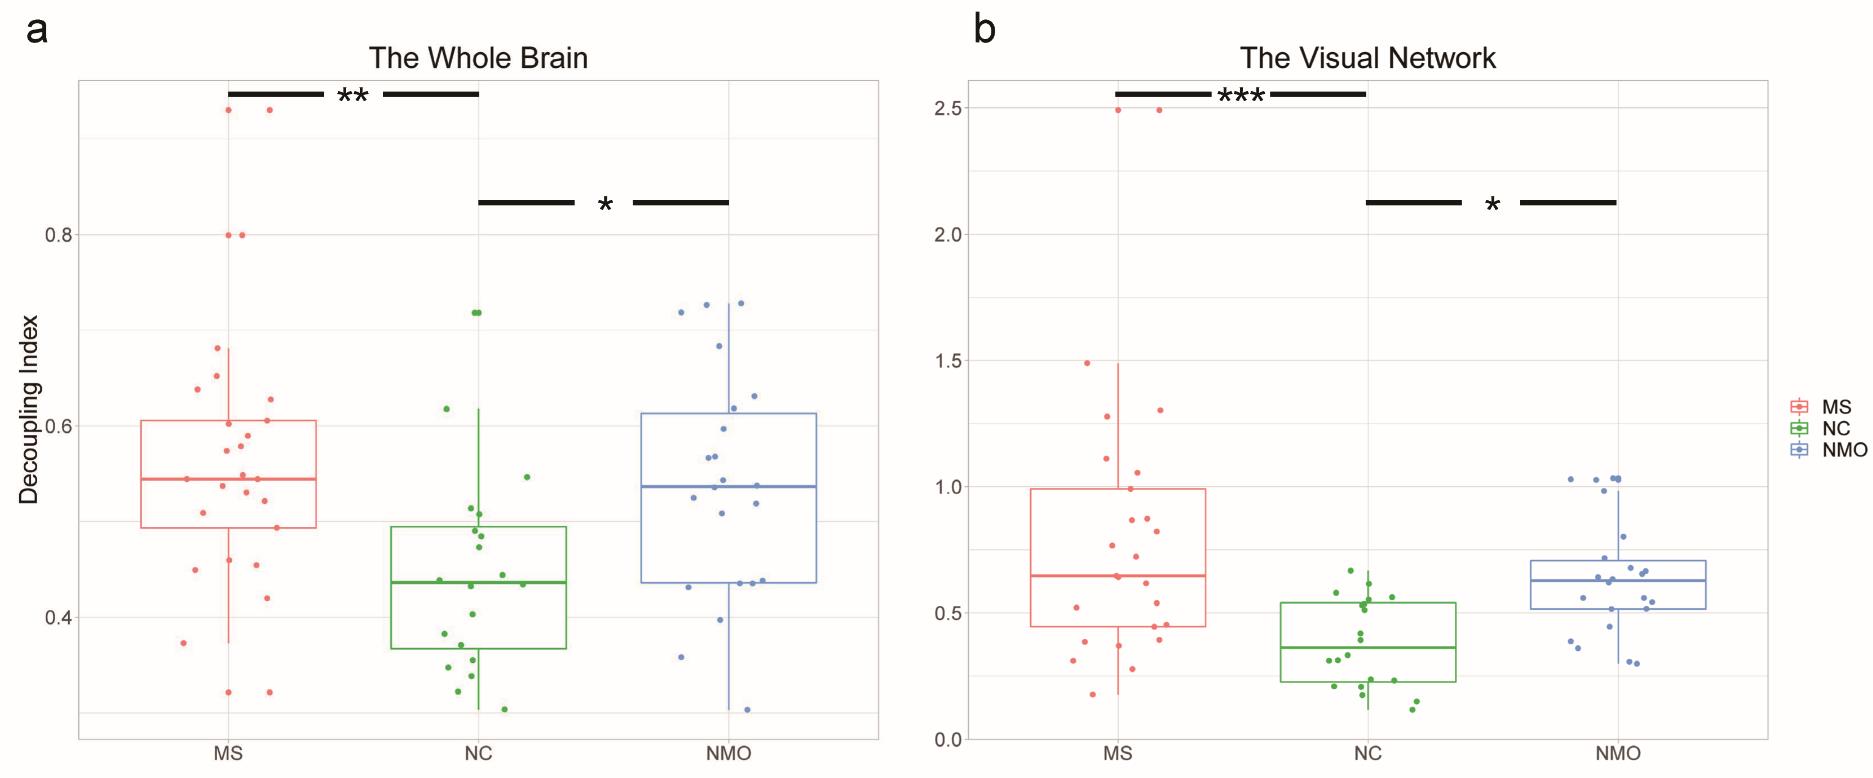
Table.1 demonstrates the demographic and clinical information for each group. The average decoupling index of each brain region for each group in binary logarithm form was shown in Fig.2. In contrast with the NC group, the brain activity appears more decoupled among MS and NMO patient groups, particularly in frontal, occipital and subcortical areas. After removing age, sex, and head movement effects, ANCOVA analysis exhibits a significantly higher decoupling index in both two patient groups in the whole brain (F = 5.486, p = 0.006), indicating brain activity in MS and NMO patients deviating abnormally from the underlying anatomical network, as shown in Fig. 3. Particularly, this liberality stands out mainly in the visual network among all eight brain intrinsic networks (F = 7.914, p < 0.001 after false discovery rate control).Discussion
The present study was designed to investigate the alteration of structural-functional coupling in patients affected by neuronal inflammatory and demyelination, particularly MS and NMO. Previous studies have elaborated that brain activity is constrained by the structural backbone5. Given that the white matter with demyelination would disturb the neural transmission pathways, we anticipated the coupling degree of functional activity shaped by the topology of brain connectome would be disrupted accordingly. By applying a quantitative approach where brain signals across the brain were decomposed into different graph-related frequency spectrums, for the first time we found that brain activity in patient with both MS and NMO deviated from the underlying structural network. The abnormally higher decoupling degree located in the visual network may partly explain the visual deficit commonly seen in those patients. Further study is needed to validate our findings with a larger sample cohort.Acknowledgements
This study was supported by grants from National Key Research and Development Program of China (2018YFC1312000), The Basic Research Foundation Key Project Track of Shenzhen Science and Technology Program (JCYJ20160509162237418, JCYJ20170413110656460).References
1. Huang, Weiyu, Leah Goldsberry, et al. Graph Frequency Analysis of Brain Signals. IEEE Journal of Selected Topics in Signal Processing. 2016;10:1189-1203.
2. Gu, Shi, Fabio Pasqualetti, et al. Controllability of structural brain networks. Nature communications. 2015;6:8414.
3. Preti, Maria Giulia and Dimitri Van de Ville. Decoupling of brain function from structure reveals regional behavioral specialization in humans. Nature Communications. 2019;10(1):4747.
4. Ye, Chenfei, Mori Susumu, et al. Connectome-wide network analysis of white matter connectivity in Alzheimer's disease. NeuroImage: Clinical. 2019;22:101690.
5. Honey, C. J. et al. Predicting human resting-state functional connectivity from structural connectivity. Proc. Natl Acad. Sci. 2009;106:2035–2040.
Figures