1370
Hippocampal regional vulnerability to damage differs between MS and neuromyelitis optica1Neuroimaging Research Unit, Institute of Experimental Neurology, Division of Neuroscience, IRCCS San Raffaele Scientific Institute, Milan, Italy, 2Neurology Unit, IRCCS San Raffaele Scientific Institute, Milan, Italy, 3Vita-Salute San Raffaele University, Milan, Italy
Synopsis
Aim of the study was to characterize regional hippocampal volumetric alterations in multiple sclerosis (MS) and neuromyelitis optica spectrum disorders (NMOSD) and to estimate correlations with MRI measures of inflammation and hippocampal disconnection. Brain T2 and T1 lesions and hippocampi were manually segmented; major hippocampal connections were reconstructed with tractography. Compared to healthy controls, NMOSD patients showed mild atrophy, whereas MS patients had diffuse hippocampal atrophy. Dentate gyrus hypertrophy and correlations between hippocampal volume abnormalities and damage of hippocampal anatomical connections was found in MS only, suggesting that other factors than inflammation, contribute to the hypertrophy process.
Introduction
Hippocampal involvement is known to occur in multiple sclerosis (MS), where hippocampal subfields have different susceptibility to damage and there is in-vivo evidence of dentate gyrus (DG) hypertrophy as a possible response to the inflammatory environment.1 Less is known about other inflammatory diseases like neuromyelitis optica spectrum disorders (NMOSD). Objective. To characterize regional hippocampal volumetric alterations in MS and NMOSD and to estimate correlations between regional hippocampal volumetric alterations and MRI measures of inflammation and hippocampal disconnection.Objective
To characterize regional hippocampal volumetric alterations in MS and NMOSD and to estimate correlations between regional hippocampal volumetric alterations and MRI measures of inflammation and hippocampal disconnection.Methods
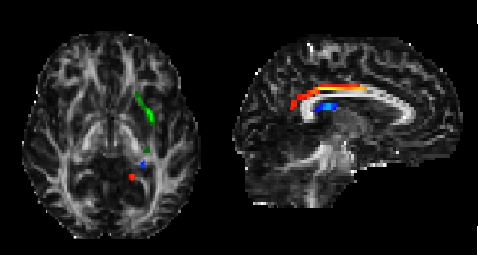
Twenty-eight seropositive NMOSD patients,2 24 age- and disease duration-matched relapsing-remitting MS3 and 20 healthy controls (HC) underwent a 3.0T MRI. The following MRI sequences were obtained: high-resolution 3D T1-weighted, dual echo turbo SE and diffusion weighted MRI. From the 3D-T1-weighted sequence, manual hippocampal segmentation was performed according to standardized procedures;4 from contours, radial distance distribution was assessed using three-dimensional parametric surface mesh models.5 Brain T2 and T1 lesion volumes (LV) were also assessed.6 From diffusion weighted sequences the diffusion tensor was estimated and fractional anisotropy (FA) and mean diffusivity (MD) maps were derived. Probabilistic tractography7 was run to reconstruct the major hippocampal connections: the fornix, the uncinate fasciculus (UF) and the cingulum (Figure 1). Within tracts, average FA, MD and LV were obtained as measures of disconnection.Results
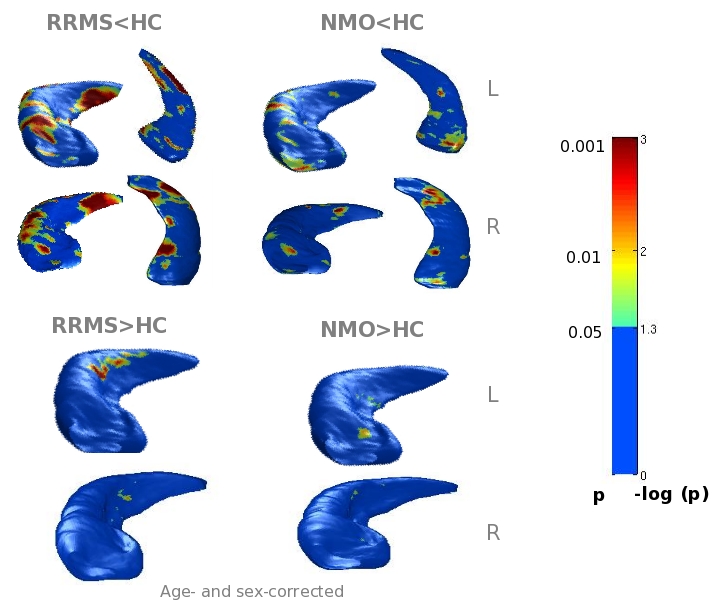
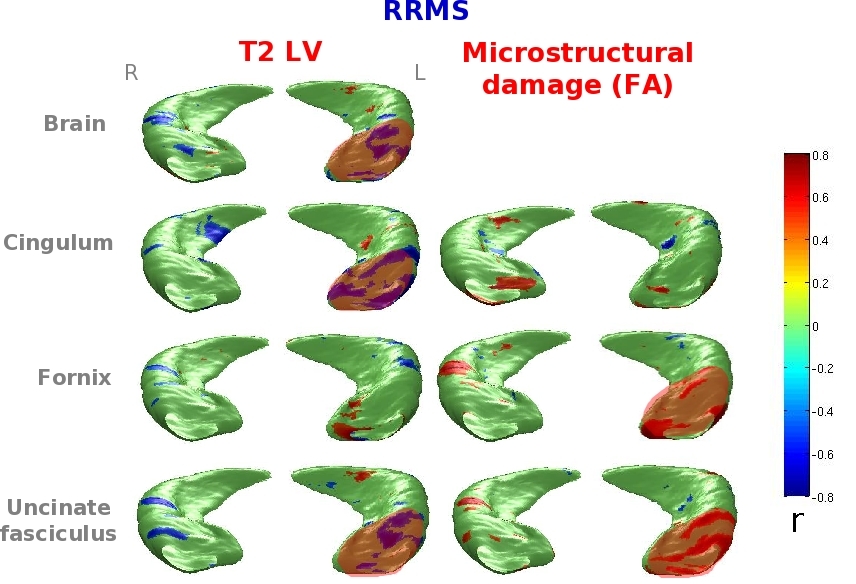
Compared to HC, NMOSD patients had similar global hippocampal volumes. The subregional analysis showed only mild atrophy in the Cornus Ammonis (CA) 1 subfield. Compared to HC, MS patients had significant hippocampal atrophy (p<0.001), especially in the CA1 and subiculum. Evidence of DG hypertrophy was found in MS (right p<0.05, left p<0.001), but not in NMOSD (Figure 2). Hippocampal anatomical connections were damaged in MS (p<0.001) and preserved in NMOSD. No correlation was found between regional hippocampal atrophy, brain T2 and T1 LVs and measures of hippocampal disconnection in NMOSD patients. In MS patients, hippocampal volume abnormalities were significantly related to brain T2 and T1 LVs and to damage of the cingulum and UF (r=-0.8, p=0.01) (Figure 3).Discussion
Hippocampal volumetric abnormalities were detectable in both groups of patients, but less severe in NMOSD. The alterations were found mainly in CA1, which has a high susceptibility to damage in neuroinflammatory diseases. Hippocampal anatomical connections were damaged in MS and preserved in NMOSD, in whom no visible T2 lesions were detected. The presence of lesions and microstructural abnormalities at the level of WM tracts (especially the cingulum and uncinate fasciculus) contributed to explain hippocampal volumetric alterations in MS.Conclusions
The preferential susceptibility to damage of the CA1 is a common feature in neuroinflammatory diseases but DG hypertrophy is a peculiar finding of MS, suggesting that other factors, in addition to inflammation, contribute to this process.Acknowledgements
No acknowledgement found.References
1. Rocca MA, Longoni G, Pagani E et al. In vivo evidence of hippocampal dentate gyrus expansion in multiple sclerosis.Hum Brain Mapp. 2015;36(11):4702-13. 2. Wingerchuk DM, Banwell B, Bennett JL, et al. International consensus diagnostic criteria for neuromyelitis optica spectrum disorders.Neurology. 2015;85(2):177-89. 3. Polman CH, Reingold SC, Banwell B, et al. Diagnostic criteria for multiple sclerosis: 2010 revisions to the McDonald criteria. Ann. Neurol. 2011;69(2):292-302. 4. Pruessner JC, Li LM, Serles W, et al. Volumetry of hippocampus and amygdala with high-resolution MRI and three-dimensional analysis software: minimizing the discrepancies between laboratories. Cereb. Cortex. 2000;10(4):433-42. 5. Thompson PM, Hayashi KM, De Zubicaray GI, et al. Mapping hippocampal and ventricular change in Alzheimer disease. Neuroimage 2004; 22:1754–1766. 6. Jim 8, Xinapse Systems Ltd., Colchester, United Kingdom 7. Behrens TE, Berg HJ, Jbabdi S, et al. Probabilistic diffusion tractography with multiple fibre orientations: What can we gain? Neuroimage 2007;34(1):144-55.Figures