1369
Multi-modal Cervical Cord MRI in MOGAD, AQP4-Ab NMOSD & MS1Nuffield Department of Clinical Neurosciences, University of Oxford, Oxford, United Kingdom, 2Oxford University Hospitals NHS Foundation Trust, Oxford, United Kingdom, 3The Key Laboratory of Behaviour Science, Institute of Psychology, Chinese Academy of Sciences, Beijing, China
Synopsis
Spinal cord involvement is an important feature of antibody-mediated demyelination, as in AQP4-Ab-positive NMOSD and MOGAD, as well as in MS. In this study of 80 participants (20 MOGAD, 20 AQP4-Ab, 20 MS, 20 health volunteers) we use multimodal cervical cord MRI to show that MOGAD may predominantly affect the grey matter; AQP4-Ab disease shows the most severely affected cord, localised to lesional areas; and that MRI metrics in the cervical cord do not differentiate these three conditions but have clinical relevance in their association with disability and pain scores, independent of disease type.
Introduction
Spinal cord involvement is an important feature of aquaporin-4 antibody (AQP4-Ab)-positive neuromyelitis optica spectrum disorder (NMOSD), myelin-oligodendrocyte glycoprotein-antibody disease (MOGAD) and multiple sclerosis (MS)[1]. In this study we use multimodal spinal cord MRI to study these conditions and correlate these measures with clinical outcomes. In particular, this is the first study to our knowledge that studies the spinal cord in MOGAD, a recently described entity, using these techniques.Methods
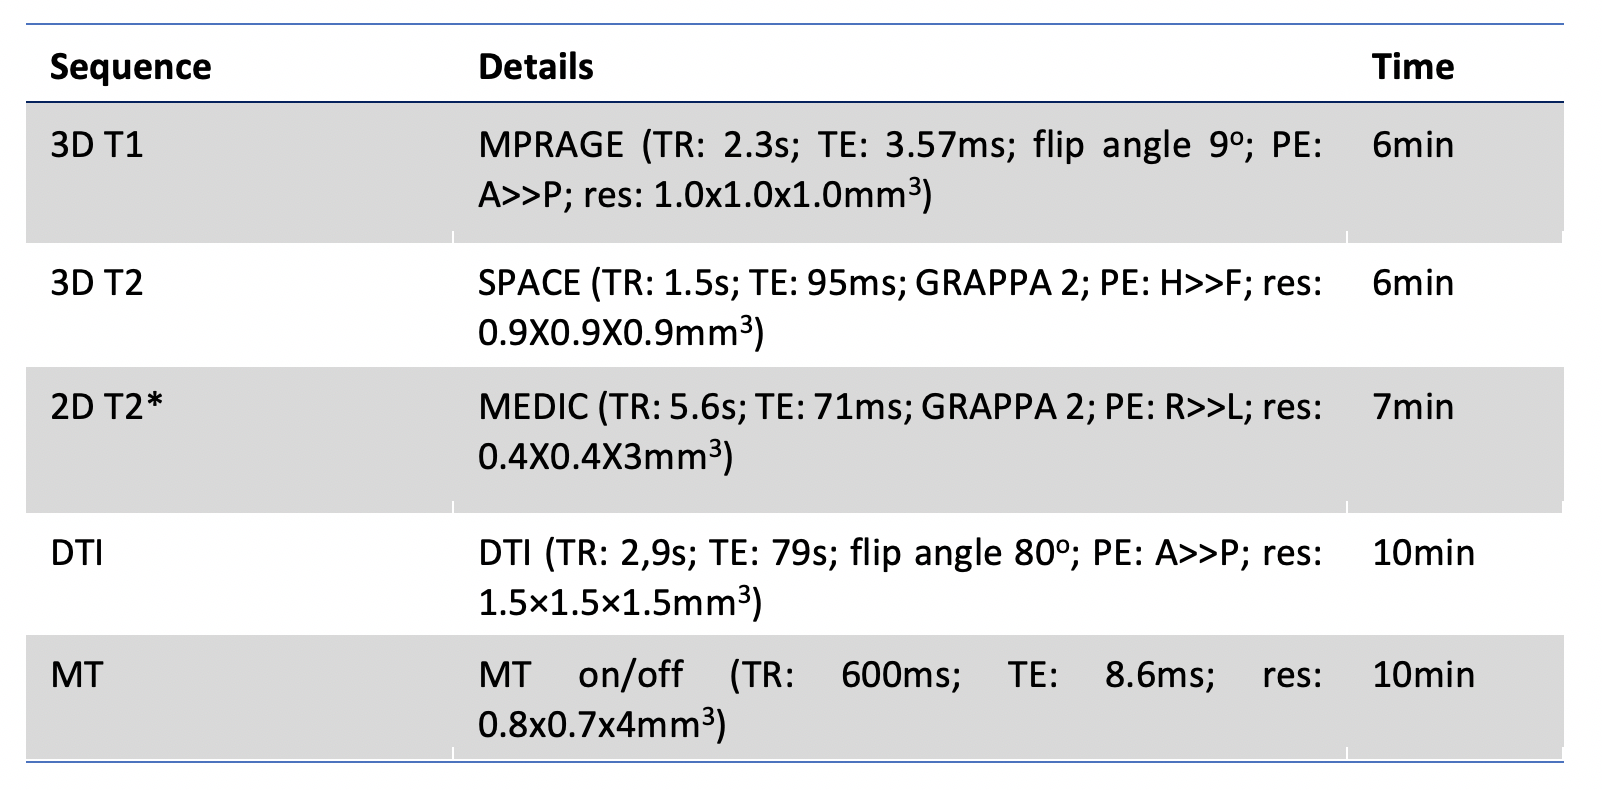
Adults with spinal cord involvement and either MOGAD (n=20), AQP4-Ab disease (n=20), or MS (n=20, disease control) were recruited at least six months outside of an acute relapse. An Expanded Disability Status Scale (EDSS)[2], pain scoring using the Brief Pain Inventory[3] and a multimodal MRI of the cervical cord (see Figure 1) were done. Twenty healthy volunteers (HV) underwent the same MRI. Cross-sectional area was calculated using Spinal Cord Toolbox (SCT)[4] on T1 images. Grey matter segmentation and volumetrics were done with SCT using T2* images. Lesions were manually segmented into binary masks using FSLeyes[5] by two raters (one blinded) from axial and sagittal T2w images. Diffusion imaging was pre-processed using FSL topup[6] and eddy[7] and then registration and metric extraction were done using SCT[4]. MT-weighted images were processed and MTR calculated and extracted using SCT[4].Structural images were compared to baseline clinical imaging to allocate all patients into one of three within-group categories based on lesion status: 1) Persistent: lesion present on clinical scan and follow-up research scan; 2) Resolved: lesion present on clinical scan but no longer identifiable; or 3) None: no lesion in the cervical cord on clinical or research scan. The patients in group 3 would have had lower cord involvement.
Statistical analysis was performed using RStudio. Kruskal-Wallis with post-hoc Dunn test were used to compare groups. Multivariate regression models were used to identify factors associated with disability and pain. P values were 2-tailed and statistical significance was set at .05.
Results
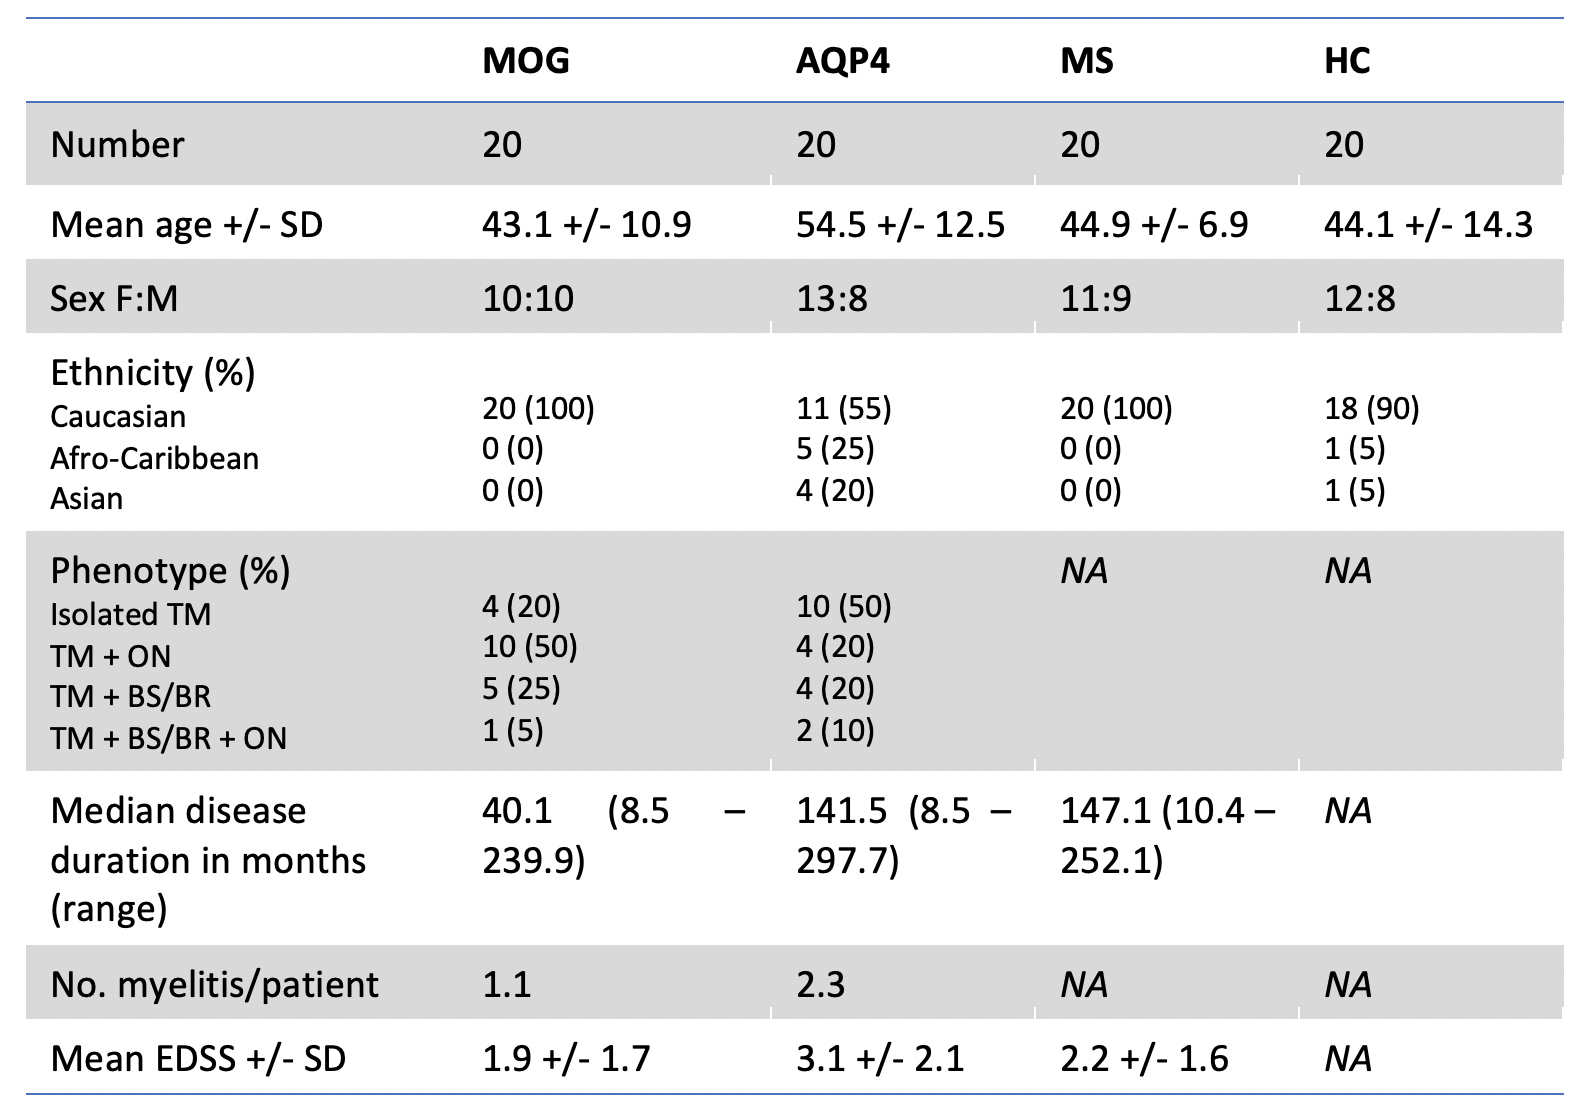
Demographics:The study consisted of 80 participants (20 in each group). Where possible, key baseline characteristics were matched. The demographics are presented in Figure 2. The sagittal location of spinal cord involvement can be seen in Figure 3.
Between-group analysis:
The MOGAD group had no residual lesions, and did not show a significant reduction in cross-sectional area, FA, MD or MTR compared to HV. The AQP4-Ab group showed the most significantly reduced cross-sectional area (p=0.0288), FA (p=0.0085) and MTR (p=<0.0001) compared to healthy to HV. The MS group showed the most significantly reduced grey matter volume (p=0.0273), increased MD (p=0.0008) as well as significantly reduced FA (p=0.0204) and MTR (p=0.0106) compared to HV. There was no difference in lesional volumes or metrics between the AQP4-Ab disease and MS groups, although the MS group had a significantly higher number of lesions (p=<0.0001).
Within-group analysis:
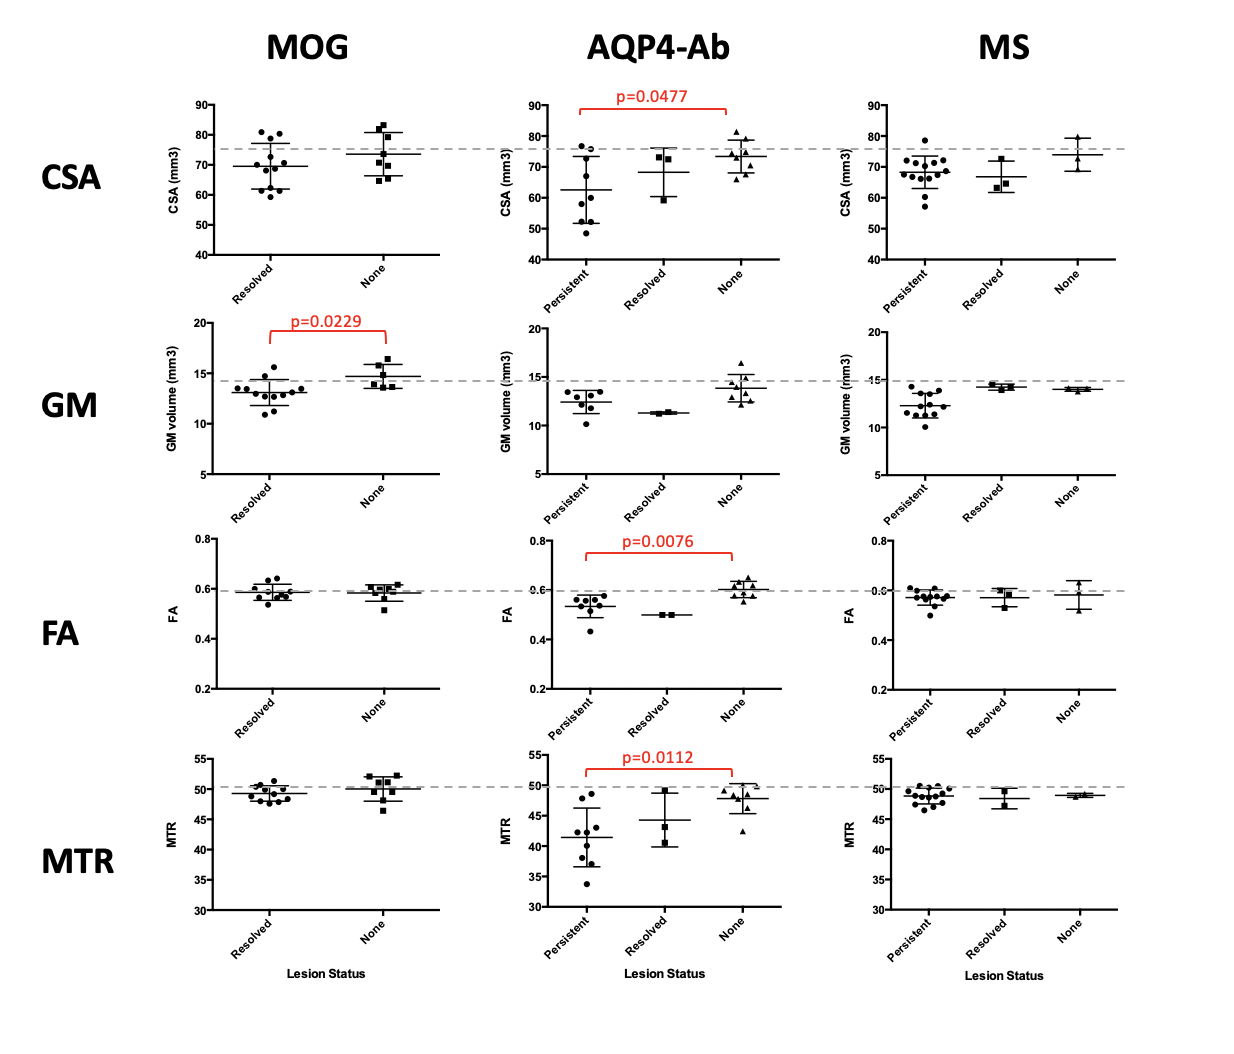
In MOGAD the only metric that differed between the ‘resolved’ and ‘none’ sub-groups was grey matter volume. No other metrics showed a difference, with the means in both being comparable to HV in all instances. In AQP4-Ab disease, the reduction in quantitative metrics was driven by those with cervical cord involvement; those with an unaffected cervical cord had values comparable to HV. In MS there was a trend that metrics were worse in those with persistent lesions but the relationship was not as prominent as in AQP4-Ab disease (see Figure 4).
Clinical associations:
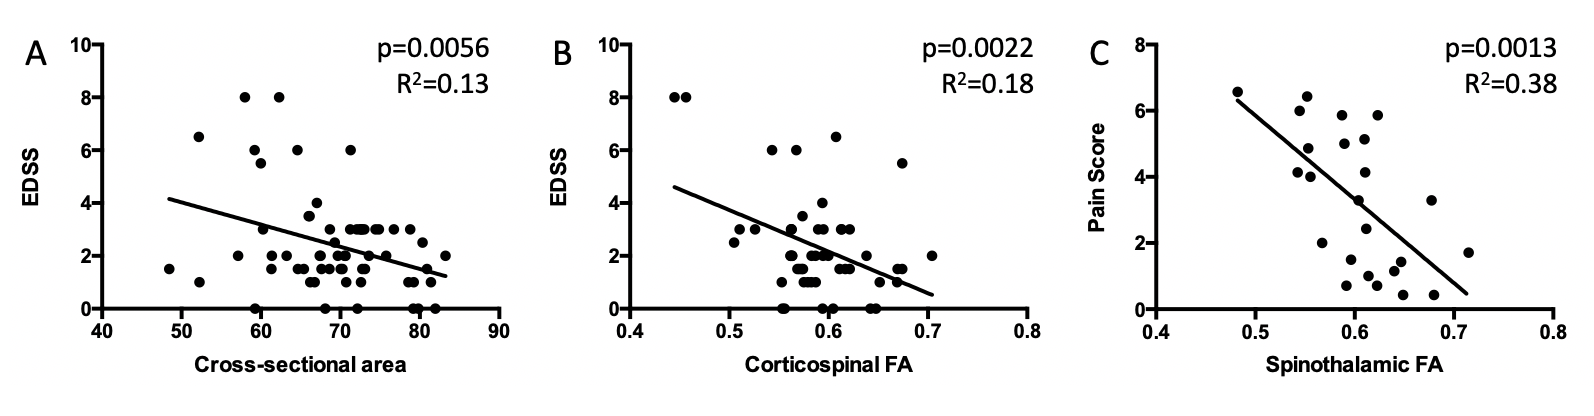
Both cross-sectional area and FA correlated with EDSS. The relationship between FA and disability was strengthened when only considering mean corticospinal tract FA (p=0.0022, R2=0.18). In a model that included age, cross-sectional area and corticospinal tract FA, the cross-sectional area was the strongest predictor of disability (p=0.0270, R2=0.15). AQP4-Ab disease and mean FA in the spinothalamic tract were both significant in a multivariate regression model of pain (p=0.004, R2=0.19) (see Figure 5).
Discussion
MOGAD is a recently described entity[8] and is being established as a disease separate from both AQP4-Ab disease and MS. In this study we show that grey matter atrophy is a significant finding in MOGAD, while other metrics i.e. FA and MTR, traditionally measures thought to represent white matter integrity[9], are comparable with healthy controls when measured outside of the acute setting. A recent study by Dubey et al. described the ‘H’ sign on acute clinical T2-weighted imaging of myelitis in MOGAD, in which involvement of the cord is limited to the grey matter[10]. Our finding of grey matter atrophy supports this and may shed light on the underlying pathogenesis of MOGAD. Myelitis in AQP4-Ab disease shows the most severe, localised damage. In MS, metrics show significant change in comparison to healthy controls, however, the relationship with lesion status is not as pronounced, which is as expected from previous studies in MS where background neuro-degeneration has been well described[11]. Cross-sectional area and FA values are clinically relevant, independent of disease type, when considering EDSS score and pain scores, as shown above.Conclusion
MOGAD may predominantly affect the grey matter. AQP4-Ab disease shows the most severely affected cord, localised to lesional areas. The MRI metrics used in this study do not differentiate these conditions but have clinical relevance in their association with disability and pain scores, independent of disease type.Acknowledgements
We thank the patients and volunteers that participated, the Oxford University Hospitals NHS Foundation Trust and the Wellcome Centre for Integrated Neuroimaging, University of Oxford.References
[1] Ciccarelli O, Cohen JA, Reingold SC, et al. Spinal cord involvement in multiple sclerosis and neuromyelitis optica spectrum disorders. Lancet Neurol. 2019;18(2):185-197. doi:10.1016/S1474-4422(18)30460-52.
[2] Kurtzke JF. Rating neurologic impairment in multiple sclerosis: An expanded disability status scale (EDSS). Neurology. 1983;33(11):1444-1452. doi:10.1212/wnl.33.11.14443.
[3] Cleeland CS, Ryan KM. Pain assessment: Global use of the Brief Pain Inventory. Ann Acad Med Singapore. 1994;23(2):129-138.4.
[4] De Leener B, Lévy S, Dupont SM, et al. SCT: Spinal Cord Toolbox, an open-source software for processing spinal cord MRI data. Neuroimage. 2017;145(October):24-43. doi:10.1016/j.neuroimage.2016.10.0095.
[5] McCarthy P. FSLeyes. September 2019. doi:10.5281/ZENODO.34036716.
[6] Andersson JLR, Skare S, Ashburner J. How to correct susceptibility distortions in spin-echo echo-planar images: Application to diffusion tensor imaging. Neuroimage. 2003;20(2):870-888. doi:10.1016/S1053-8119(03)00336-77.
[7] Andersson JLR, Sotiropoulos SN. An integrated approach to correction for off-resonance effects and subject movement in diffusion MR imaging. Neuroimage. 2016;125:1063-1078. doi:10.1016/j.neuroimage.2015.10.0198.
[8] Jurynczyk M, Messina S, Woodhall MR, et al. Clinical presentation and prognosis in MOG-antibody disease: A UK study. Brain. 2017;140(12):3128-3138. doi:10.1093/brain/awx2769.
[9] Wozniak JR, Lim KO. Advances in white matter imaging: A review of in vivo magnetic resonance methodologies and their applicability to the study of development and aging. Neurosci Biobehav Rev. 2006;30(6):762-774. doi:10.1016/j.neubiorev.2006.06.00310.
[10] Dubey D, Pittock SJ, Krecke KN, et al. Clinical, Radiologic, and Prognostic Features of Myelitis Associated with Myelin Oligodendrocyte Glycoprotein Autoantibody. JAMA Neurol. 2019;76(3):301-309. doi:10.1001/jamaneurol.2018.405311.
[11] Novakova L, Axelsson M, Malmeström C, et al. Searching for neurodegeneration in multiple sclerosis at clinical onset: Diagnostic value of biomarkers. PLoS One. 2018;13(4):1-14. doi:10.1371/journal.pone.0194828
Figures