1368
Contrasting brain MRI features in Ab-mediated demyelinating diseases and MS: investigating the pathogenesis of brain damage1Nuffield Department of Clinical Neurosciences, University of Oxford, Oxford, United Kingdom, 2Oxford University Hospital NHS Foundation Trust, Oxford, United Kingdom, 3University of Adelaide, Adelaide, Australia
Synopsis
The previous non-conventional MRI studies included both AQP4 positive and negative patients, thus yielding differing results, partly explained by cohort heterogeneity (i.e. antibodies status). No studies are available in MOG-Ab disease. We compared, using non-conventional imaging, brain MRI findings in 73 subjects with AQP4-ab, MOG-Ab disease, Multiple Sclerosis and in healthy controls. We found that MOG-Ab disease have a lower lesions load when compared to MS and AQP4-Ab disease and we demonstrated, for the first time, that significant changes occur in the deep grey matter while no significant changes were detected in the non-lesional white matter in MOG-Ab disease.
INTRODUCTION
Multiple Sclerosis (MS) is the commonest cause of progressive disability in young adults and the aetiology is unknown 1. In recent years the study of neuroinflammatory conditions has led to the identification of two diseases, which can mimic MS and have a clear aetiology (i.e. AQP4 and MOG antibodies). Although the symptoms can overlap, there are important clinical differences between the antibody-mediated diseases and MS. In particular, antibody-mediated diseases lack a progressive phase thus disability depends solely on relapses. Antibody-mediated diseases mainly present with long spinal cord lesions, although short lesions in AQP4-Ab and MOG-Ab diseases, and long lesions in MS have been described. Spinal cord lesions in AQP4 and MOG are often indistinguishable 2,3.In light of this, we may be able to learn more about the different pathologies, by contrasting and comparing the brain features in MS (a primary demyelinating mainly T-cell-mediated disease), AQP4-Ab disease (antibody-mediated astrocytopathy, where demyelination is a secondary event) and MOG-Ab disease (antibody-mediated primary demyelinating disease). The previous non-conventional MRI studies included both AQP4 positive and negative patients, thus diluting out the potential discriminatory findings 4,5.No conventional and non-conventional MRI studies aiming at comparing AQP4-Ab and MOG-Ab disease with MS, have been done so far. This study compares and contrast, using non-conventional and quantitative imaging, brain MRI findings in 73 subjects across these three diseases and in healthy controls (HC). For AQP4-ab and MOG-Ab diseases we predominantly selected patients with brain lesions. We described in the remission phase across the four groups: I) the number of brain lesions in the three diseases; II) the presence of whole brain and regional atrophy; III) the white matter diffusion metrics.METHODS
18 relapsing-remitting MS, 18 MOG-Ab, 19 AQP4-Ab disease and 18 HC were included. Brain MRI was acquired at 3T (Siemens Magnetom Prisma) using a 64-channels receive head/neck coil. All subjects underwent the same imaging protocol, including 3DT1-weighted, fluid attenuated inversion recovery (FLAIR), proton density (PD), and multi-shell diffusion-weighted sequences. Lesions were segmented manually on FLAIR. The T1 images were bias-corrected and the lesions were filled using lesions masks6. The 3D-T1 image was used to calculate the total brain volume with SIENAX tool7, and the deep grey matter structures using the automated segmentation tool FIRST8, both part of FSL9. Voxel-wise statistical analysis of FA was carried out using Tract-Based-Spatial-Statistic (TBSS)10, part of FSL9.RESULTS
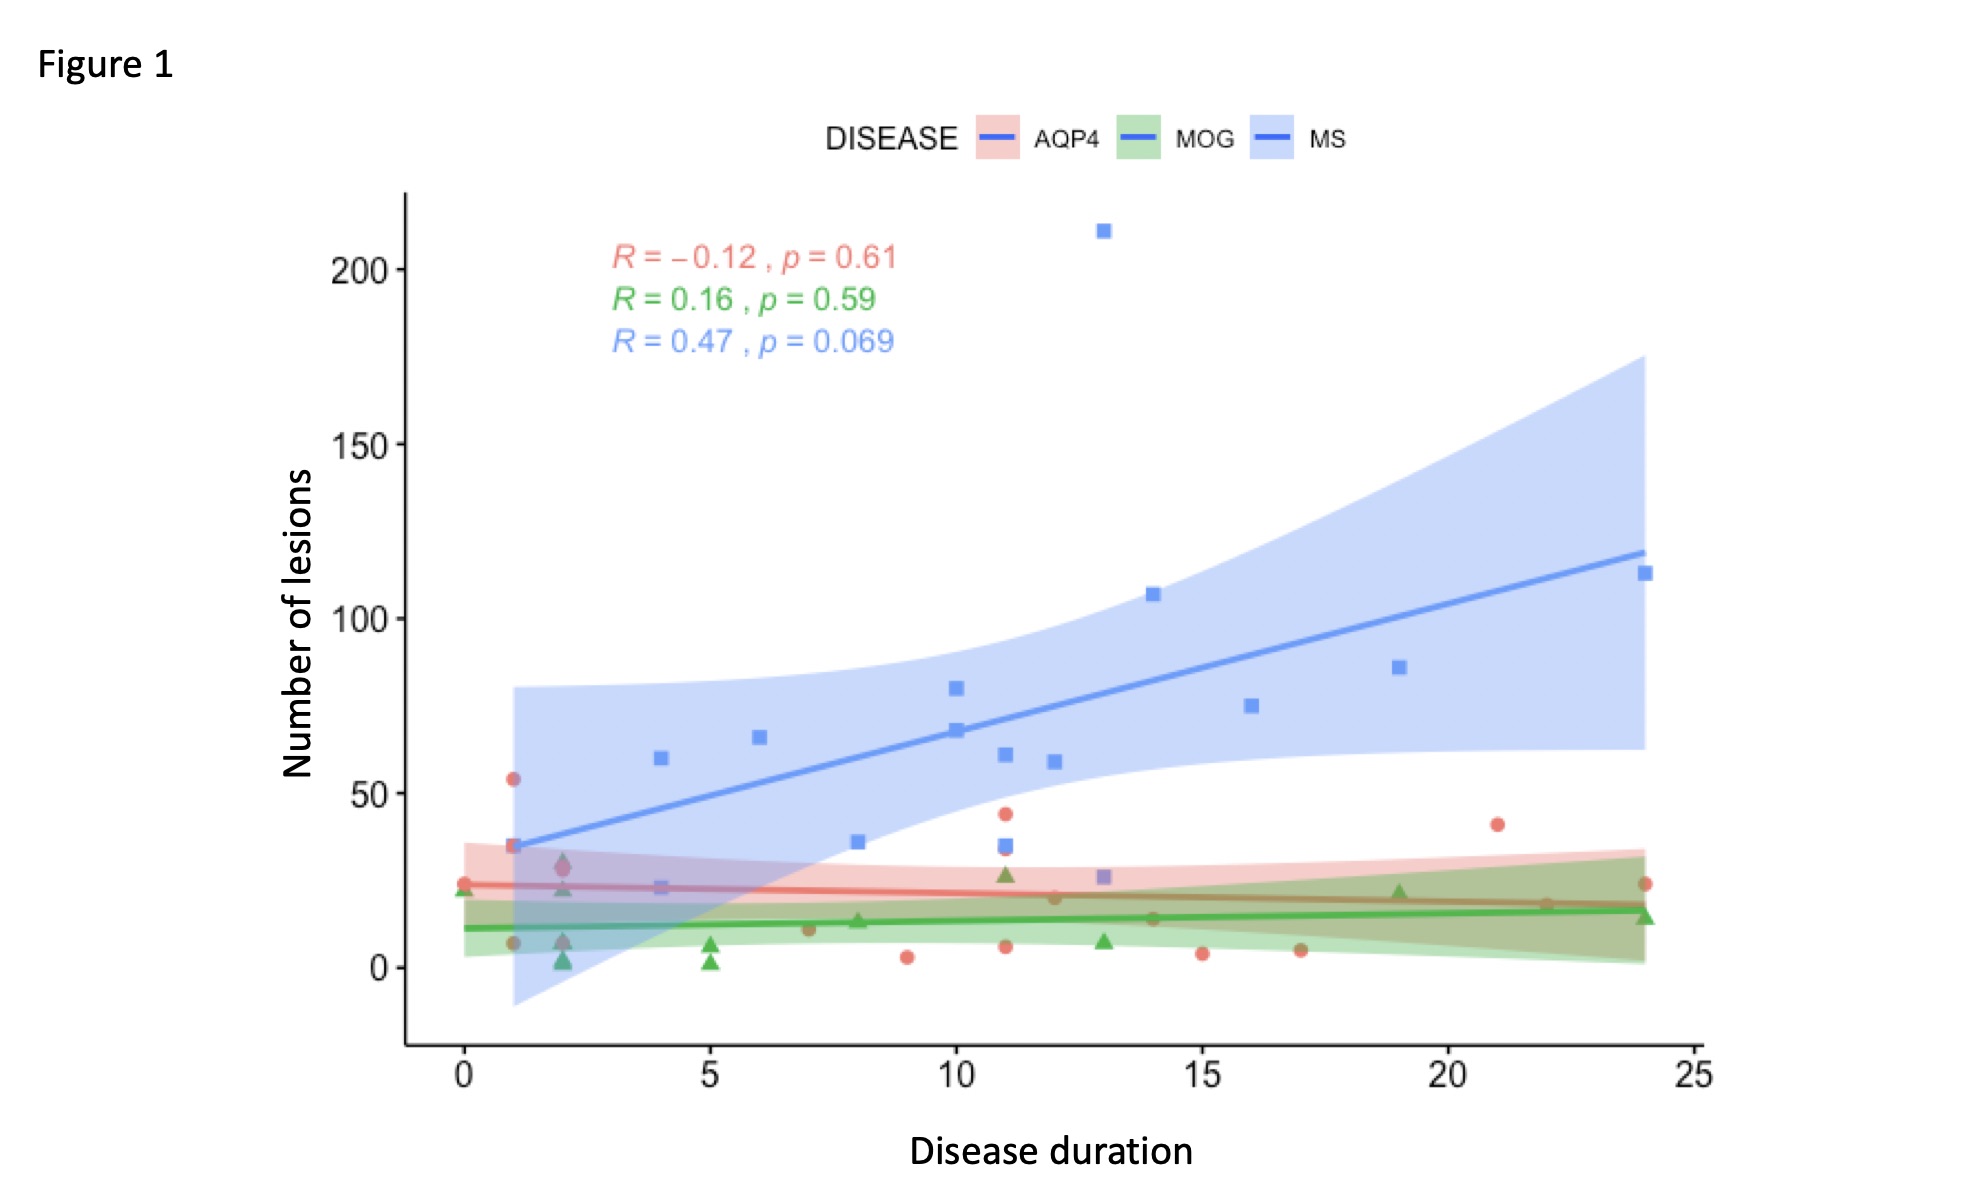
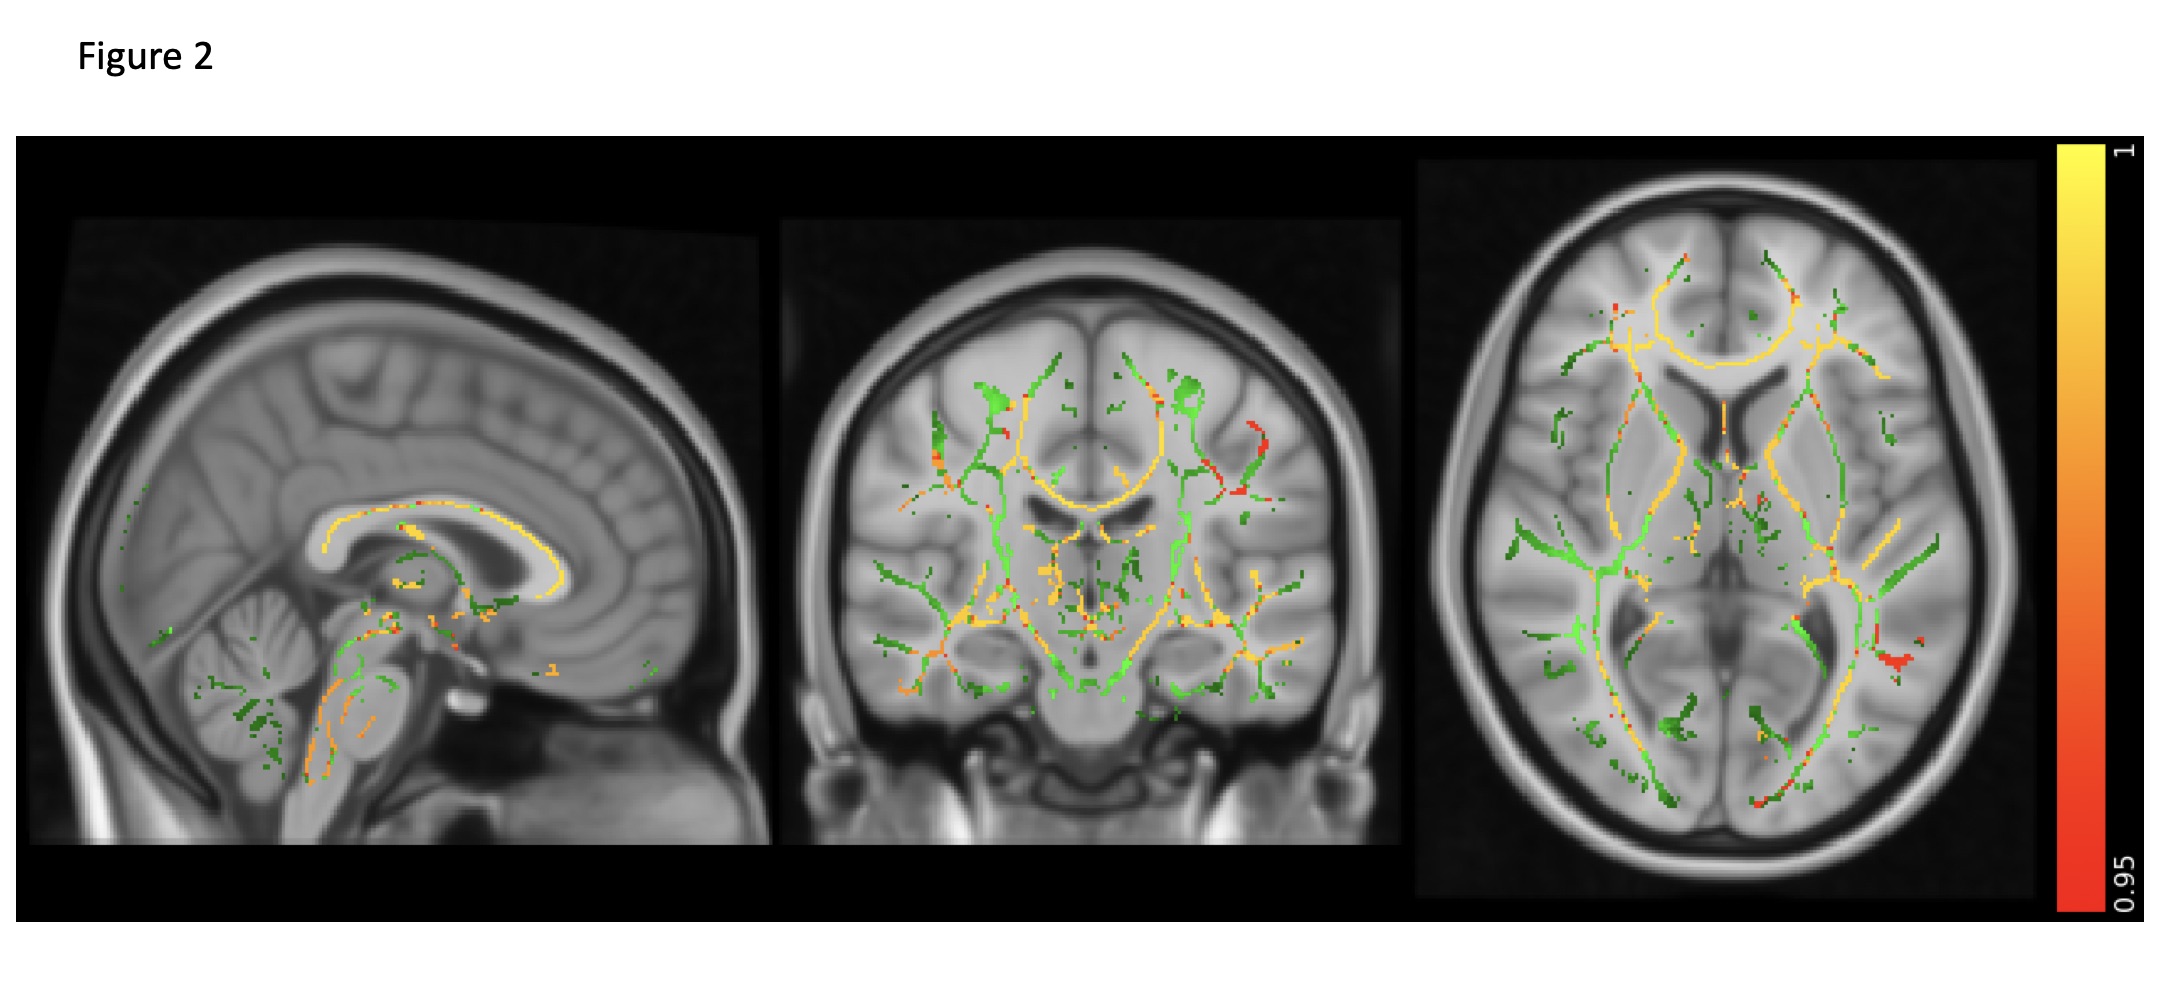
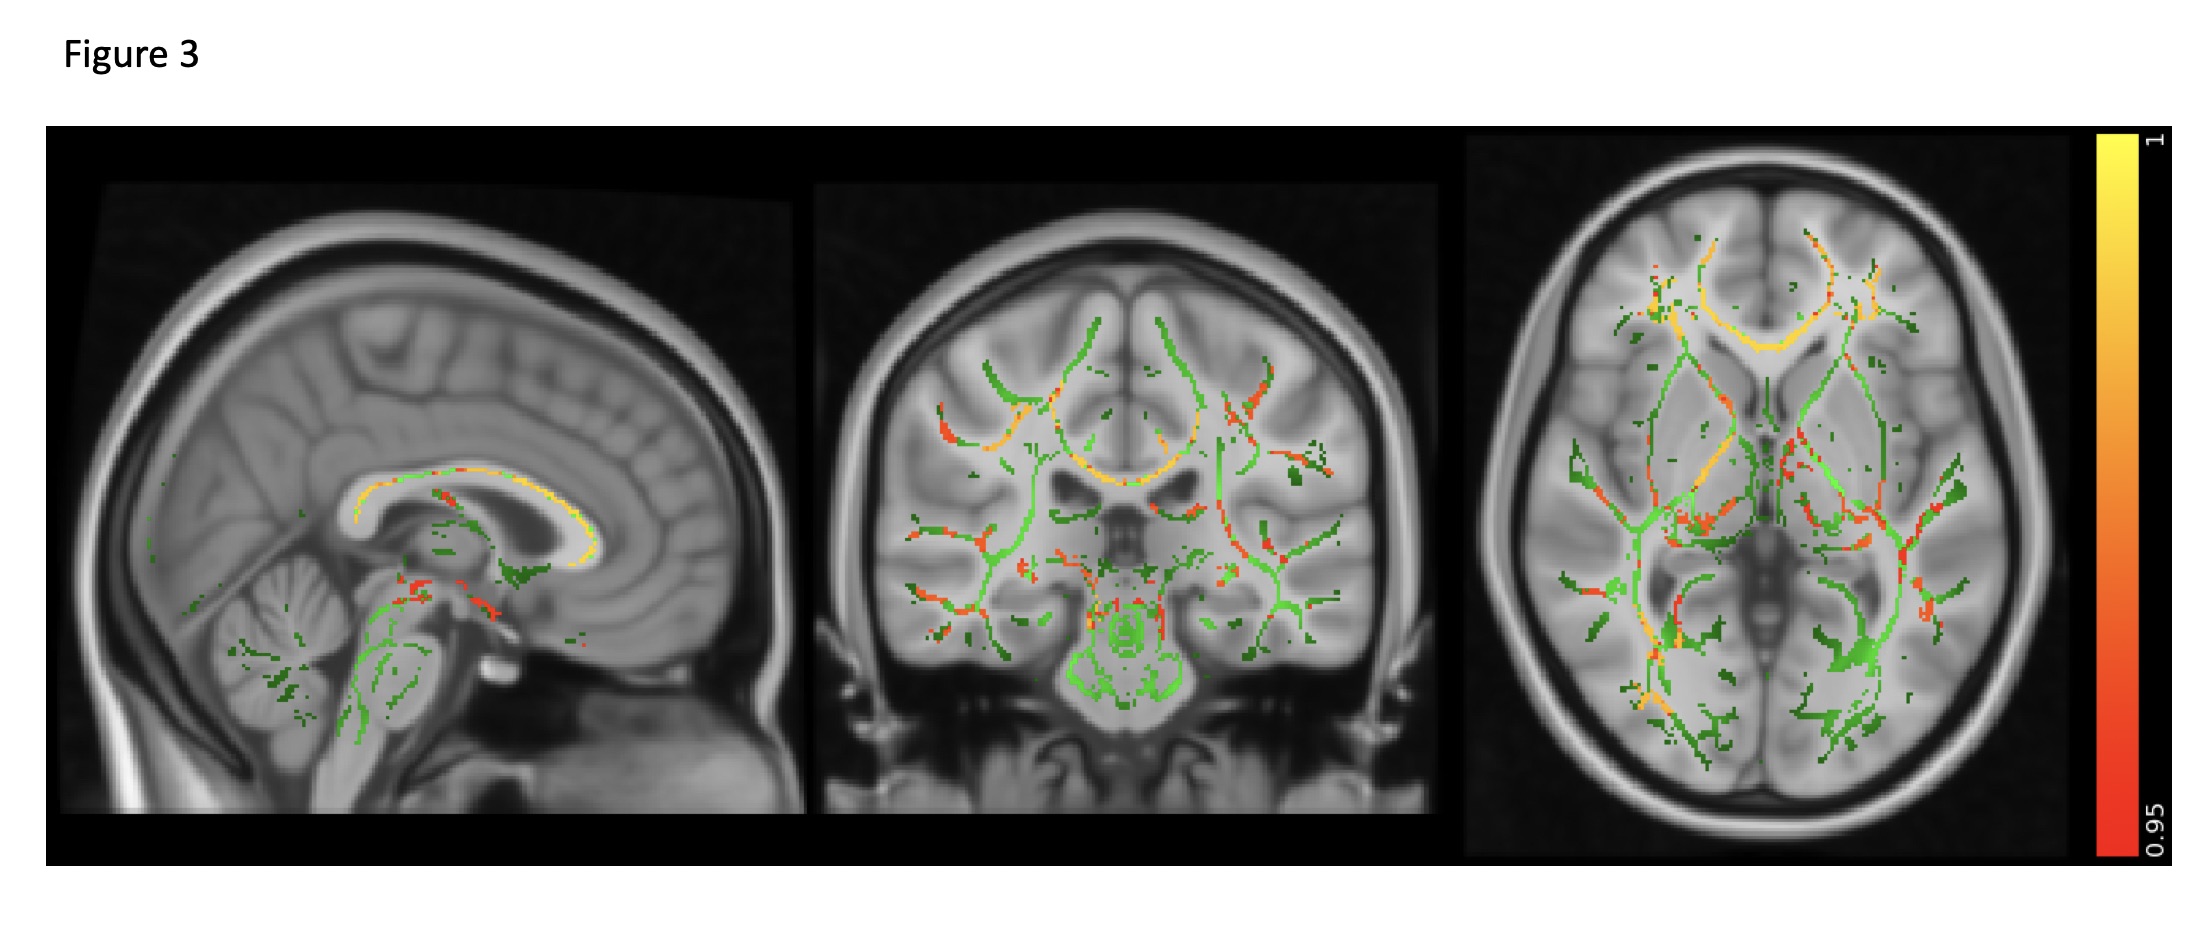
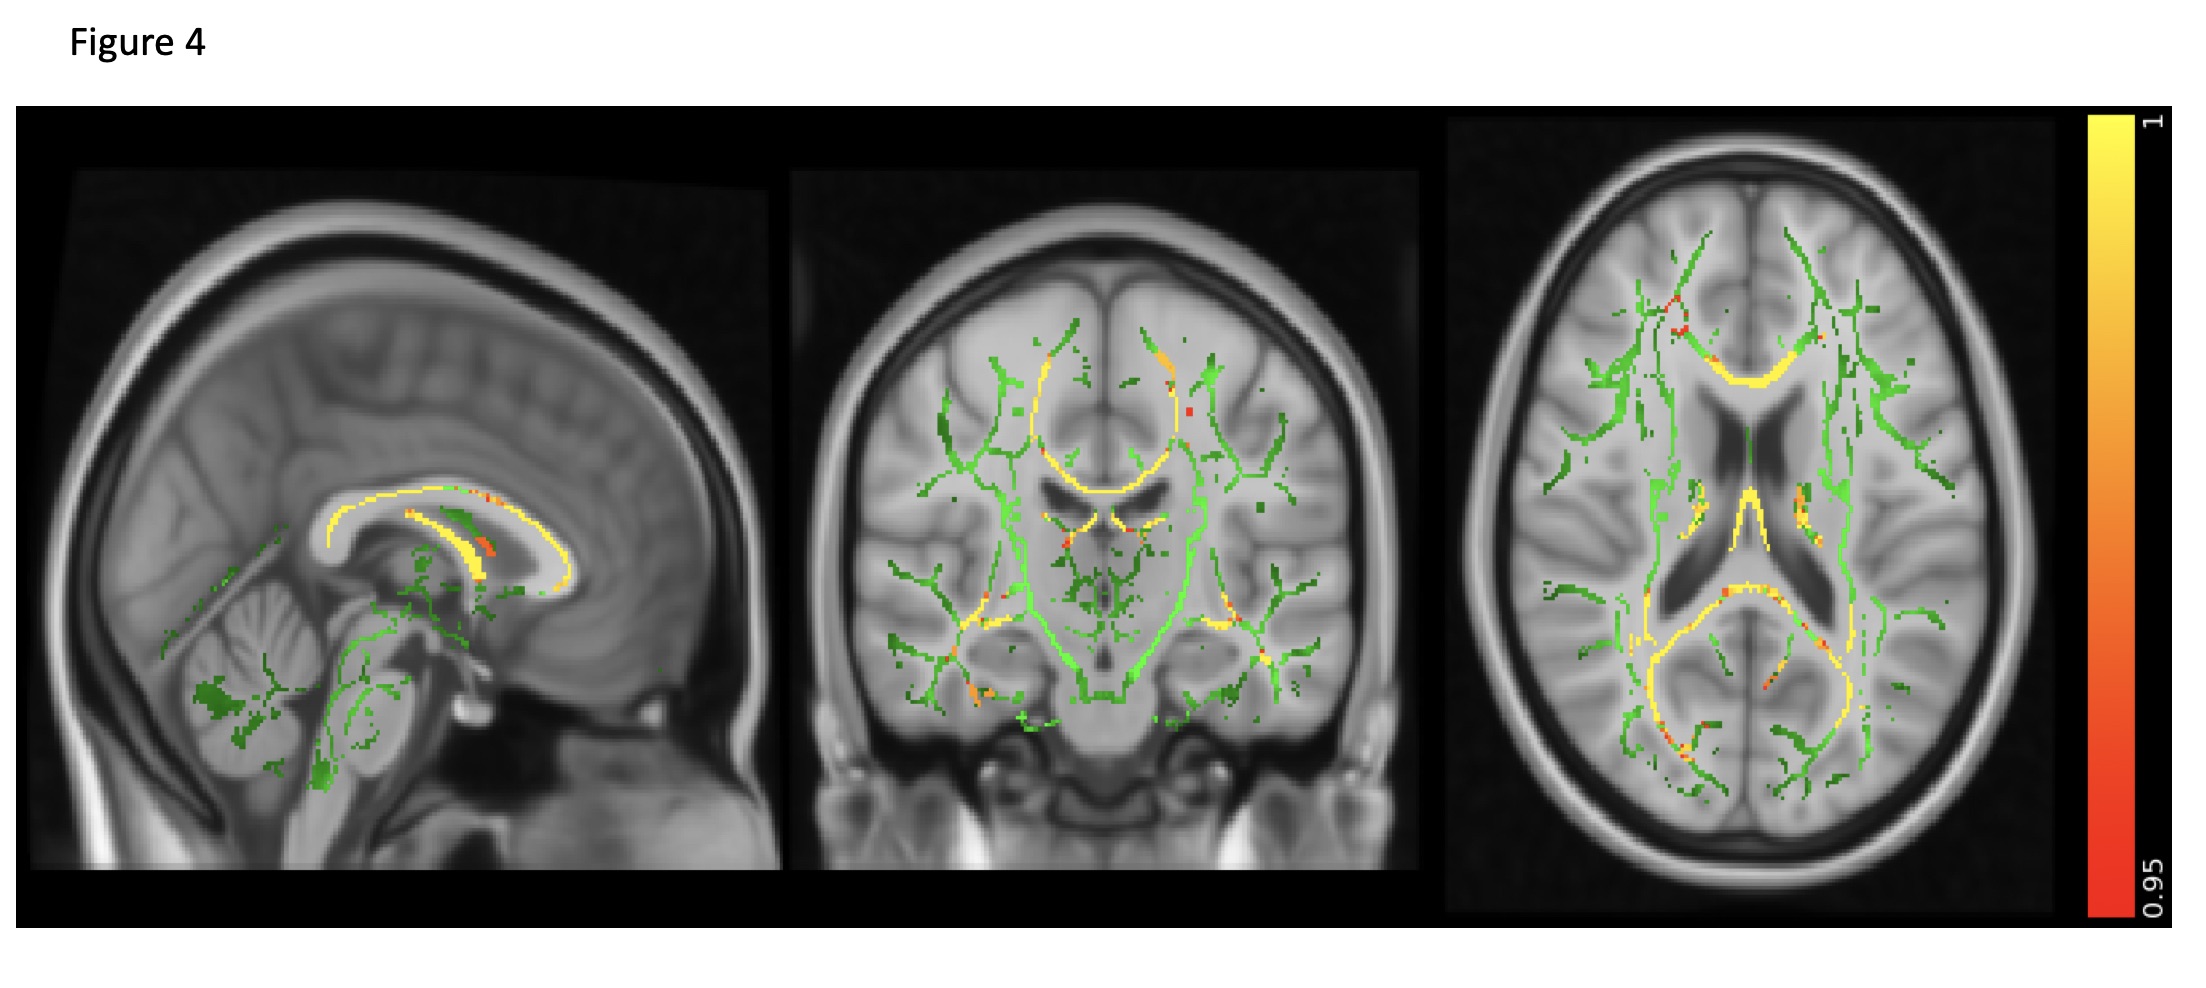
MS has the highest lesion-load compared to AQP4-Ab and MOG-Ab diseases, despite selecting the latter group for predominantly having brain lesions (p<0.0001). Lesions increased with disease duration, not seen in the two antibody-diseases (R=0.47, p=0.069, see figure 1).Brain volume was not significantly abnormal in any group compared to HC (p=0.08), although there was a trend for lower volumes in AQP4-Ab disease and MS compared to MOG-Ab disease. The normalised averaged thalamic, caudate and hippocampus volumes were lower in the disease groups, compared to HC (thalamic volume p=0.04; caudate volume p=0.01; hippocampus p=0.03). Lesional-FA was not different between groups, but lesional-MD was higher in the three diseases compared to HC NAWM (p<0.0001).NAWM-FA was lower in AQP4-Ab disease compared to MOG-Ab disease (p<0.05). NAWM-MD was similar between diseases and HC.Between lesions and NAWM; FA was different in MOG-Ab disease (p=0.008), while MD was different in all the three diseases (AQP4-Ab disease, p=0.0001; MOG-Ab disease, p=0.002; MS, p<0.0001). The voxel-wise comparison analysis of FA showed reduced NAWM in NMOSD-AQP4 compared to HC and MOG-Ab disease (see figure 2 and 3), and in MS compared to HC (see figure 4). There is no difference between MOG-Ab disease and HC.DISCUSSION
This is the first study using conventional and non-conventional MRI to assess MOG-Ab disease and to compare it with AQP4-Ab disease and MS. We found that MOG-Ab disease have a lower lesions load when compared to MS and AQP4-Ab disease, and this did not show increases over time. Interestingly, all the three disease groups have lower deep grey matter volumes (thalamus, caudate, hippocampus), when compared to HC. FA is significantly different between lesions and non-lesional are only in MOG-Ab disease because NAWM appears preserved in MOG-Ab disease, suggesting that the white matter abnormalities can cause a focal tissue disruption and not a retrograde degeneration in the white matter bundles.CONCLUSIONS
MOG-Ab disease is clinically less severe than MS and AQP4-Ab disease11. Patients tend to recover completely, and the conventional MRI often shows resolution of the brain and spinal cord lesions. Our study shows, for the first time, that significant changes occur in the deep grey matter while no significant changes in the non-lesional white matter were detected in MOG-Ab disease. This finding provides further insight into disease pathogenesis and may illuminate mechanisms behind “invisible” symptoms (i.e. cognitive impairment and fatigue) and also identify imaging measures suitable as surrogate markers for long term clinical outcomes.Acknowledgements
We are really grateful to all the patients and their relatives who participated in our study.References
1. Compston A, Coles A. Multiple sclerosis. Lancet. Oct 25 2008;372(9648):1502-1517.
2. Kitley J, Woodhall M, Waters P, et al. Myelin-oligodendrocyte glycoprotein antibodies in adults with a neuromyelitis optica phenotype. Neurology. Sep 18 2012;79(12):1273-1277.
3. Kitley J, Waters P, Woodhall M, et al. Neuromyelitis optica spectrum disorders with aquaporin-4 and myelin-oligodendrocyte glycoprotein antibodies: a comparative study. JAMA Neurol. Mar 2014;71(3):276-283.
4. Chanson JB, Lamy J, Rousseau F, et al. White matter volume is decreased in the brain of patients with neuromyelitis optica. Eur J Neurol. Feb 2013;20(2):361-367.
5. Liu Y, Duan Y, Huang J, et al. Multimodal Quantitative MR Imaging of the Thalamus in Multiple Sclerosis and Neuromyelitis Optica. Radiology. Dec 2015;277(3):784-792.
6. Gelineau-Morel R, Tomassini V, Jenkinson M, Johansen-Berg H, Matthews PM, Palace J. The effect of hypointense white matter lesions on automated gray matter segmentation in multiple sclerosis. Hum Brain Mapp. Dec 2012;33(12):2802-2814.
7. Smith SM, Zhang Y, Jenkinson M, et al. Accurate, robust, and automated longitudinal and cross-sectional brain change analysis. Neuroimage. Sep 2002;17(1):479-489.
8. Patenaude B, Smith SM, Kennedy DN, Jenkinson M. A Bayesian model of shape and appearance for subcortical brain segmentation. Neuroimage. Jun 1 2011;56(3):907-922.
9. Smith SM, Jenkinson M, Woolrich MW, et al. Advances in functional and structural MR image analysis and implementation as FSL. Neuroimage. 2004;23 Suppl 1:S208-219.
10. Smith SM, Jenkinson M, Johansen-Berg H, et al. Tract-based spatial statistics: voxelwise analysis of multi-subject diffusion data. Neuroimage. Jul 15 2006;31(4):1487-1505.
11. Jurynczyk M, Messina S, Woodhall MR, et al. Clinical presentation and prognosis in MOG-antibody disease: a UK study. Brain. Dec 1 2017;140(12):3128-3138.
Figures