1367
White matter resting-state BOLD signals depend on the orientation of the local diffusion tensor axis relative to the B0-field1Athinoula A. Martinos Center for Biomedical Imaging, Massachusetts General Hospital, Harvard Medical School, Charlestown, MA, United States, 2VA Boston Healthcare System, Boston, MA, United States, 3Division of Health Sciences and Technology, Massachusetts Institute of Technology, Cambridge, MA, United States
Synopsis
We aimed to test whether the amplitudes of resting-state BOLD signals within the white matter depend on the orientation of the local diffusion tensor relative to the B0-field. This was assessed using resting-state BOLD and diffusion data provided by the HCP. Baseline BOLD signals were about 11% higher in voxels where primary DTI directions were parallel to B0 compared to perpendicular. Because myelinated fibres will change local tissue T2*, which will also impact the BOLD signal, we tested whether the observed BOLD orientation effect was driven by static effects on the baseline or dynamic effects from changes in blood oxygenation.
Introduction
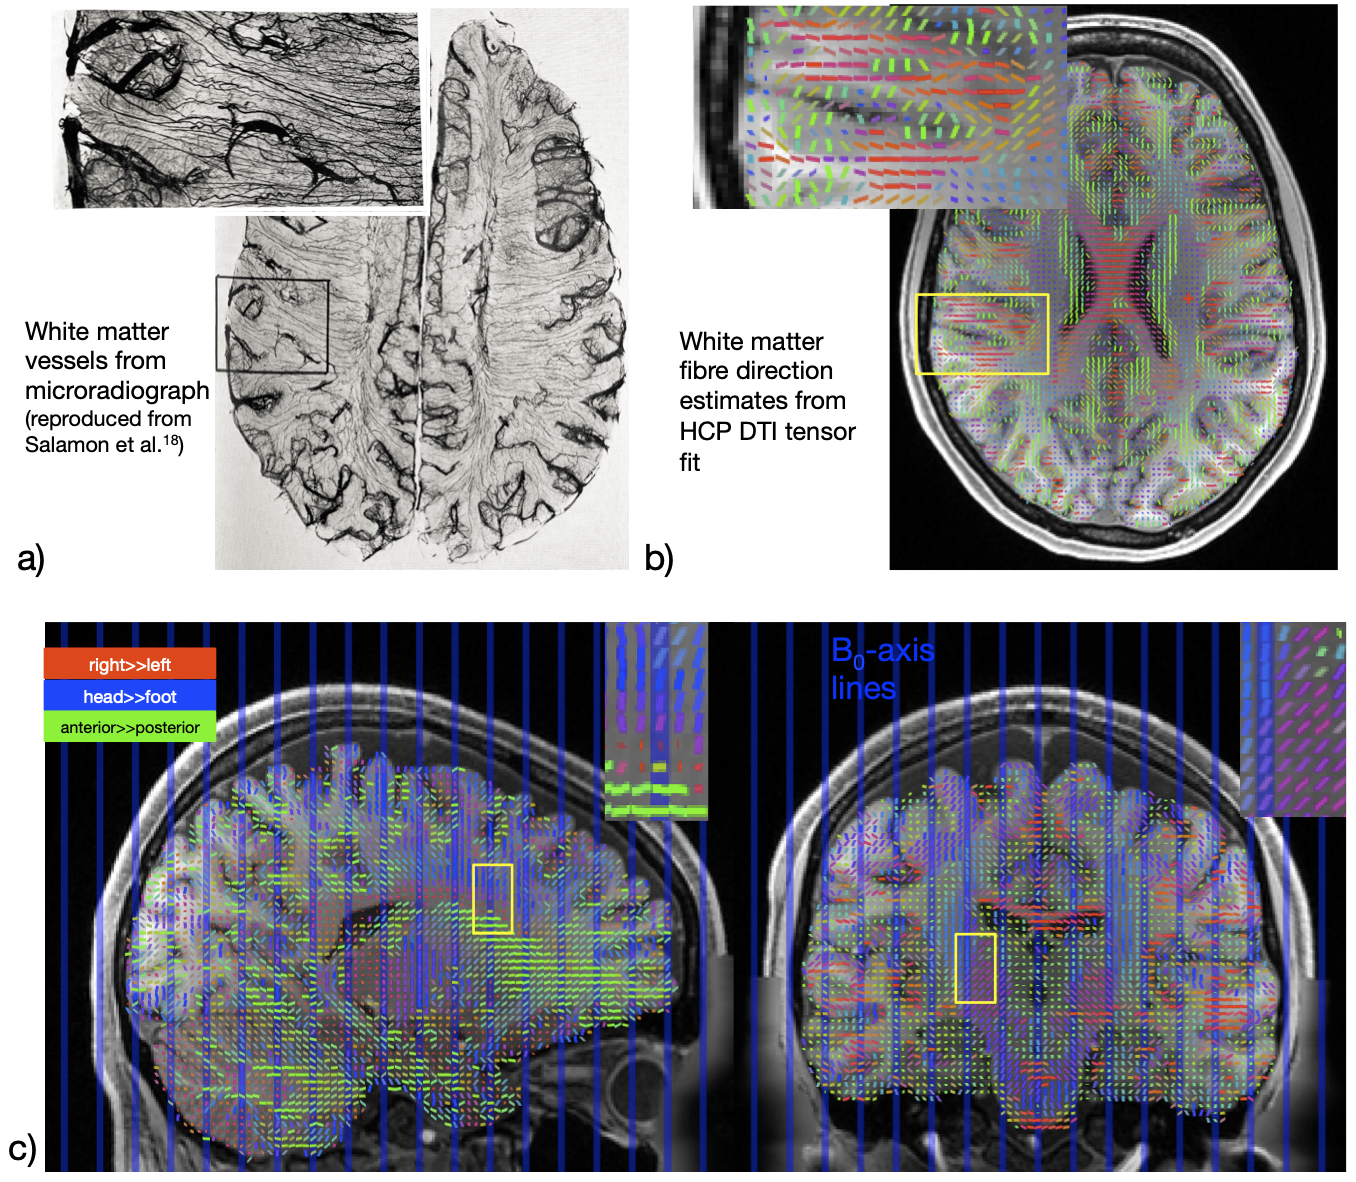
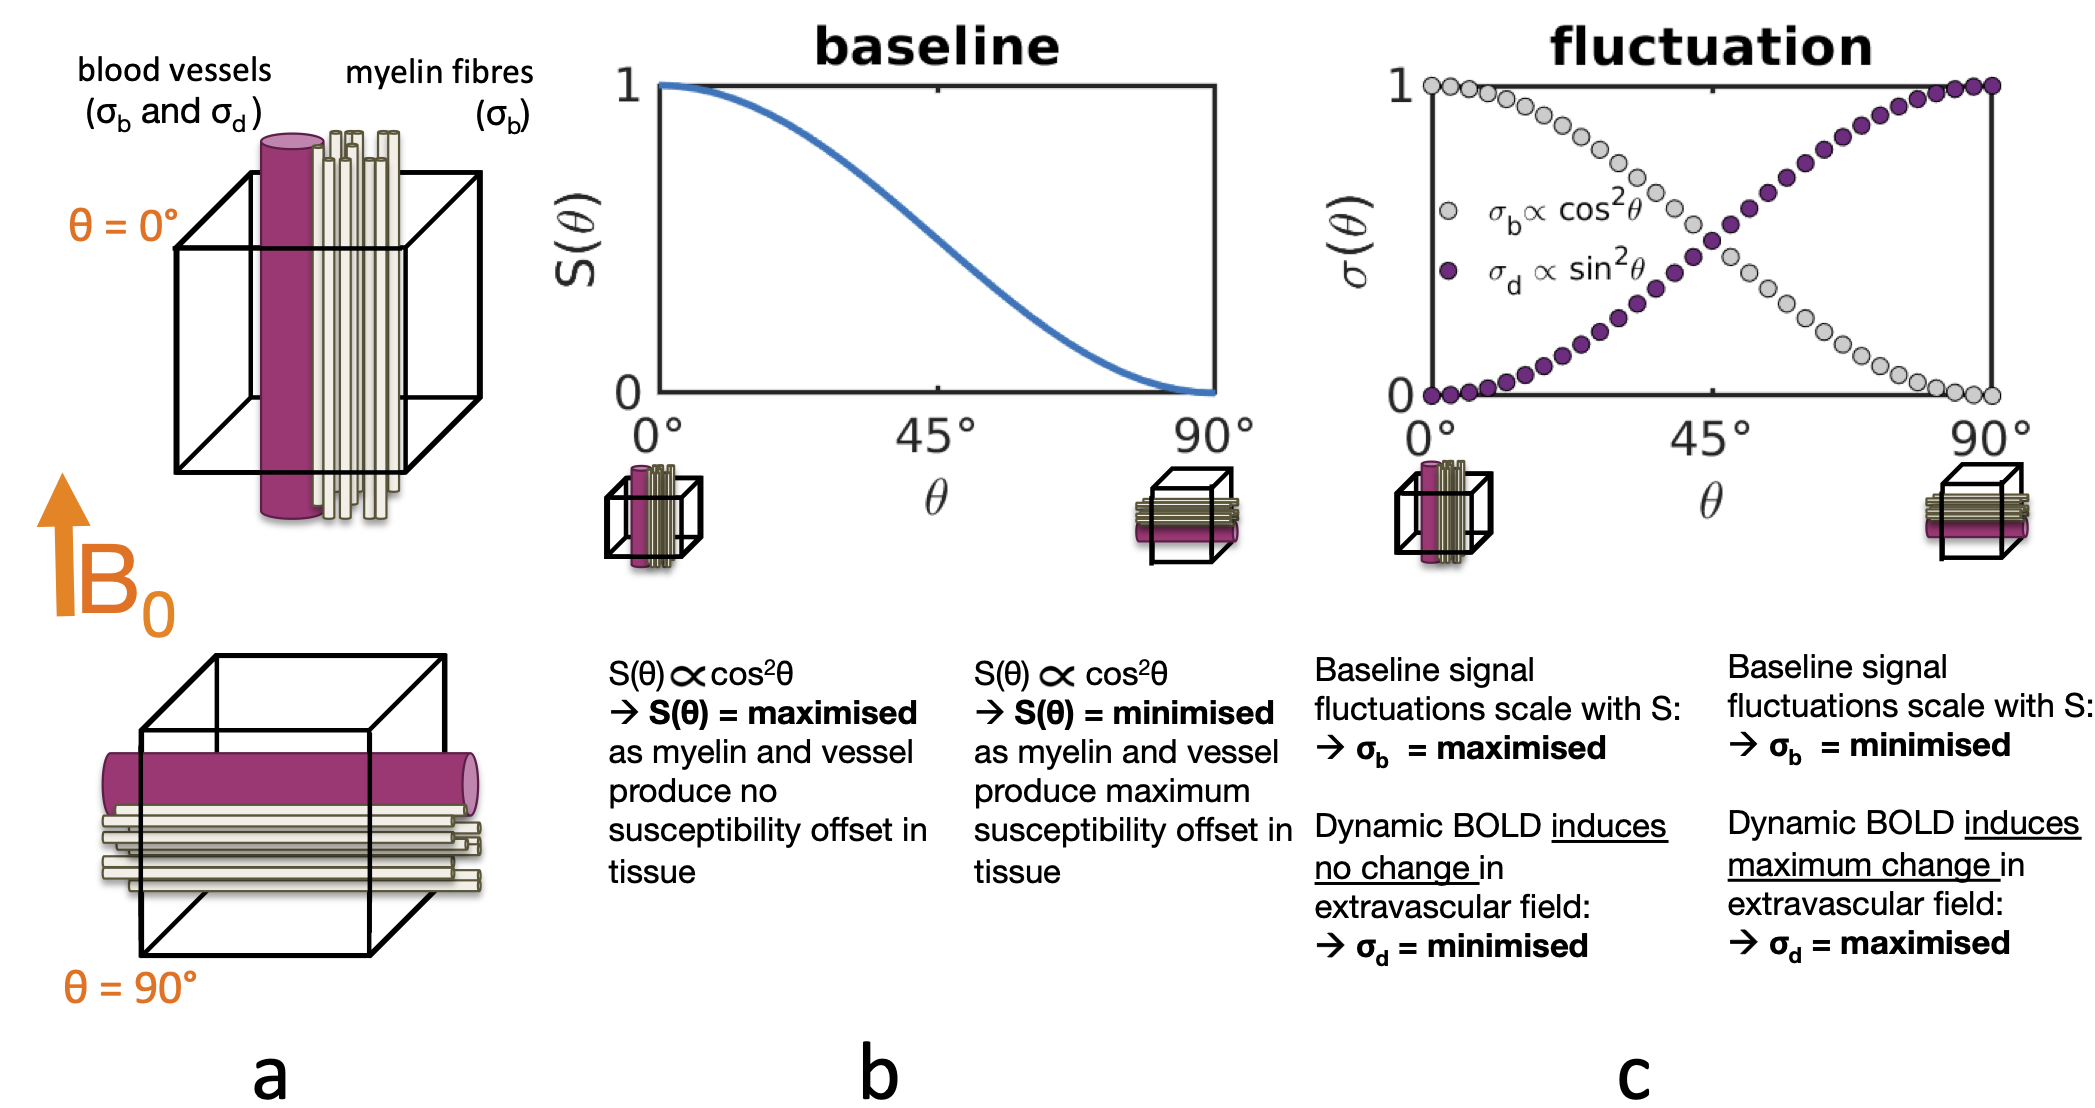
Functional MRI activity has ben reported within the cerebral white matter (WM) during task1, rest2,3,5 and sleep4, typically using gradient-echo BOLD. The spatial pattern of this activity appears to follow the known fibre anatomical architecture3,5. Classical anatomical studies have demonstrated that blood vessels closely follow the course of several WM fibre tracts (Fig.1a), which recently is supported by in vivo MR angiography7,8. The question arises as to whether vessels are simply packed between fibre bundles or if vessel anatomy perhaps reflects blood flow regulation and individual fibre bundles possess dedicated vessels to support their metabolic demand.Cerebral cortical orientation relative to B0 has been shown to affect the resting-state (rs) BOLD fluctuation amplitudes due to the coupling between the vascular and cortical anatomy9,10. Similar orientation effects have been reported in WM in quantitative BOLD11 and dynamic susceptibility contrast imaging12. We tested if the potential coupling of WM fibre geometry and vasculature imparts a similar influence in WM rs-BOLD. Mainly two factors likely cause this effect (Fig.2):
(1) static factors: Myelin T2* depends on the orientation of the myelinated structure relative to B0. Similarly the T2* of tissue surrounding a vessel depends on the vessel's B0-orientation. Consequently the static baseline BOLD signal level exhibits an orientation dependence $$$S\propto\text{cos}^2\theta$$$13. The associated signal fluctuation component,$$$\,\sigma_b$$$, scales positively with the baseline:$$$\,\sigma_b=\lambda\cdot\,S(\theta)\,$$$(well-known in the context of physiological noise14) and therefore$$$\,\sigma_b\propto\text{cos}^2\theta$$$, and amplitudes are largest for vessels and myelin parallel to B0.
(2) dynamic factors: Intra- and extravascular field variations induced by deoxyhemoglobin concentration changes also depend on the vessel's B0-orientation, hence the dynamics of the BOLD signal will also exhibit an orientation effect. We define$$$\,\sigma_d$$$, the fluctuation due to dynamics, that is known to scale as$$$\,\sigma_d\propto\text{sin}^2\theta\,$$$9,10, and amplitudes are smallest for vessels parallel to B0.
In brief, static and dynamic factors oppositely influence the orientation dependence of BOLD fluctuation amplitudes. We exploited this to probe the static and dynamic BOLD sources in WM fMRI by analysing rs-fMRI time-series mean and standard deviation as a function of fibre orientation within the whole WM and within individual fibre bundles.
Methods
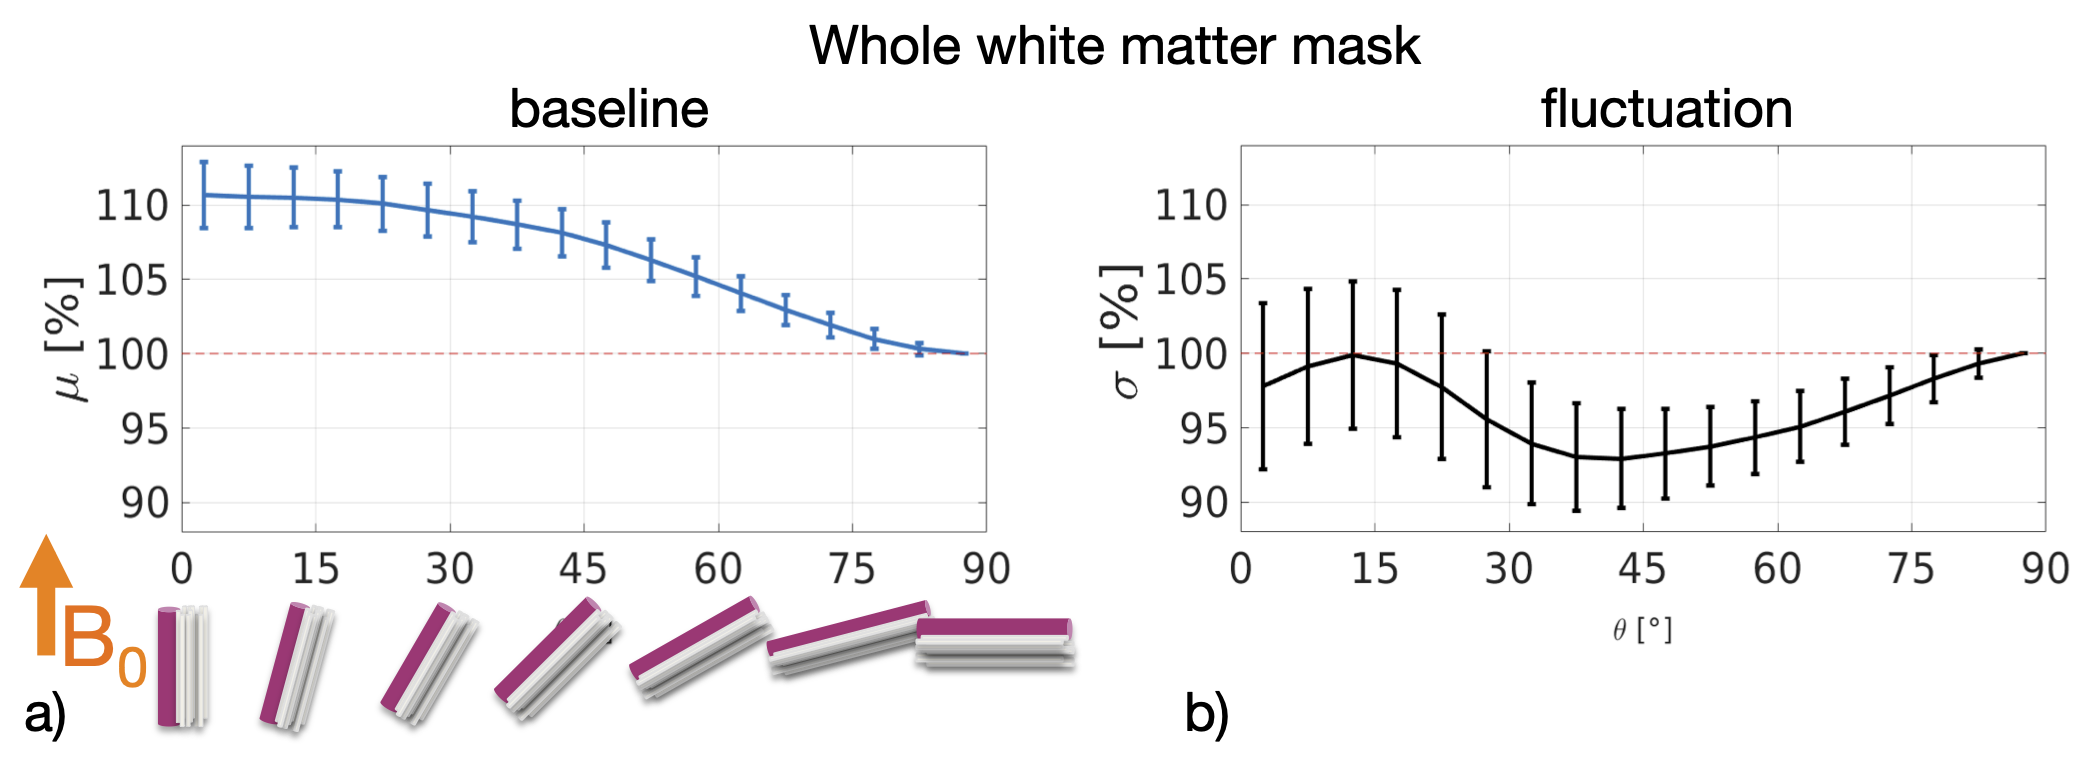
A total of 110 subjects from the Human Connectome Project (HCP) 3T dataset (S1200, release 03/2017)15 were randomly chosen. The unprocessed T1w-MPRAGE, four rs-BOLD fMRI scans (gradient-echo EPI, 2mm iso., TR=720ms, TE=33ms, SMS=8, no GRAPPA) and the diffusion-weighted data (spin-echo EPI, 1.25mm iso., TR=5520ms, TE=89.5ms, SMS=3, b=[1,2,3]×103 s/mm2) were downloaded. We adapted and re-ran the HCP minimal processing pipeline16 avoiding standard registration to MNI space to leave the data in native subject space. We estimated fibre directions by calculating the principal direction of the DTI tensor fit to the b=1.000s/mm2 data (Fig.1b/c). To test for inaccuracies from crossing fibres we also estimated directions from probabilistic tractography with bedpostX (3 sticks). Directions were rotated into the subject's head position during each rs-fMRI scan to assign fibre orientation angles$$$\,\theta\,$$$to each rs-BOLD voxel (nearest neighbour). Binary WM masks were created (from the FreeSurfer parcellation) and eroded. The fibre-labeled streamline density atlas of the IIT Human Brain Atlas17 was used to create 15 binary masks (Table 1) of the major fibre bundles in subject native space (using the non-linear registration between IIT anatomical reference and subject T1w-anatomical). Within each subject and mask, we then evaluated mean BOLD signal$$$\,\mu(\theta)\,$$$(the baseline signal level) and standard deviation$$$\,\sigma(\theta)\,$$$(the signal fluctuation amplitude) as a function of fibre orientation relative to B0 and averaged these over all subjects.Results
The WM baseline signal$$$\,\mu\,$$$showed an orientation dependence and was ~11% higher in voxels that contained parallel fibres (Fig.3a). This translates to a transverse relaxation rate change $$$\Delta\,R_2^*\,$$$of 3.1 Hz, similar to a previously reported WM orientation dependence of$$$\,\Delta\,R_2^*\,$$$2.5 Hz11. Averaged over the entire WM the signal fluctuation$$$\,\sigma\,$$$showed a mixed bias relationship (Fig.3b) suggesting a spatially heterogeneous mix of static$$$\,\sigma_b\,$$$and dynamic$$$\,\sigma_d\,$$$orientation biases. These effects disentangled more when plotted for individual fibre masks (Fig.4). The maximum orientation bias ($$$\Delta\mu=\mu(\theta=)^\circ)−\mu(\theta=90^\circ)\,\text{and}\,\Delta\sigma=\sigma(\theta=0^\circ)-\sigma(\theta=90^\circ))\,$$$varied strongly between individual bundles. Table 1 sorts bundles into three categories: dynamics dominated with negative biases (total of 7 bundles;$$$\,\Delta\sigma\,$$$up to -19%); baseline dominated with positive biases (total of 3 bundles;$$$\,\Delta\sigma\,$$$up to +21%) and unclassifiable bundles with little or mixed biases within errorbars (total of 5 bundles). Fig.4 shows an animated plot of all$$$\,\mu(\theta)\,\text{and}\,\sigma(\theta)\,$$$profiles. The bundles with the strongest negative fluctuation bias also exhibited the strongest baseline biases, suggesting that not only myelin, but also vessels (especially veins) might run in congruence and act as static signal sources.Crossing fibres cause inaccuracies in DTI direction estimates, however our findings did not change when we repeated analysis with fibre directions from bedpostX tractography.
Discussion
This analysis shows that WM gradient-echo BOLD signals are consistently influenced by the fibre geometry. As such, spatial patterns of WM fMRI activity might partially reflect the underlying anatomical structures, e.g. myelinated fibres but potentially also vessels running alongside them. If both structures contribute only static signal components to the fMRI time-series the fluctuations should scale positively with baseline orientation effects. This was only observed in a few fibre bundles. Almost half of them exhibited an opposite fluctuation orientation bias, suggesting that vessels in these bundles not only act as static, but also as dynamic BOLD sources.Acknowledgements
We would like to thank Dr. Konstantinos Arfanakis (Illinois Institute of Technology) for advising us on details of the IIT brain atlas.
This work was supported in part by the NIH NIBIB (grants P41-EB015896 and R01-EB019437), by the BRAIN Initiative (NIH NIMH grant R01-MH111419), and by the MGH/HST Athinoula A. Martinos Center for Biomedical Imaging; and was made possible by the resources provided by NIH Shared Instrumentation Grants S10-RR023043 and S10-RR019371. Data were provided by the Human Connectome Project, WU-Minn Consortium (Principal Investigators: David Van Essen and Kamil Ugurbil; U54-MH091657) funded by the 16 NIH Institutes and Centers that support the NIH Blueprint for Neuroscience Research; and by the McDonnell Center for Systems Neuroscience at Washington University.
References
[1] Mazerolle EL et al. Detecting functional magnetic resonance imaging activation in white matter: Interhemispheric transfer across the corpus callosum; BioMed Central Neuroscience 2008; 9:84; DOI:10.1186/1471-2202-9-84
[2] Ding Z et al. Spatio-Temporal Correlation Tensors Reveal Functional Structure in Human Brain. PLoS ONE 2013; 8(12):e82107; DOI:10.1371/journal.pone.0082107
[3] Ding Z et al. Detection of synchronous brain activity in white matter tracts at rest and under functional loading. PNAS 2018; 115(3):595—600; DOI: 10.1073/pnas.1711567115
[4] Özbay PS et al. Contribution of systemic vascular effects to fMRI activity in white matter. NeuroImage 2018; 176:541—549; DOI:10.1016/j.neuroimage.2018.04.045
[5] Peer M. et al. Evidence for Functional Networks within the Human Brain’s White Matter. The Journal of Neuroscience 2017; 37(27):6394—6407, DOI: 10.1523/JNEUROSCI.3872-16.2017
[6] Rostrup E et al. Regional differences in the CBF and BOLD responses to hypercapnia: a combined PET and fMRI study. Neuroimage 2000; 11:87–97; DOI:10.1006/nimg.1999.0526
[7] Bernier M et al. Prospects for Improving Neuronal Specificity of fMRI with Ferumoxytol: an Evaluation of Vascular Segmentation and Cortical Depth-dependent Analysis. Proceedings of the ISMRM 2019. #537
[8] Bernier et al. White-matter vasculature using Ferumoxytol: Bundle-specific vessels and vascular densities Submitted to the ISMRM 2020.
[9] Gagnon et al. Quantifying the Microvascular Origin of BOLD-fMRI from First Principles with Two-Photon Microscopy and an Oxygen-Sensitive Nanoprobe. Journal of Neuroscience 2015; 35(8): 3663-3675; DOI: 10.1523/JNEUROSCI.3555-14.2015
[10] Viessmann et al. Dependence of resting-state fMRI fluctuation amplitudes on cerebral cortical orientation relative to the direction of B0 and anatomical axes. NeuroImage 2019; 196:337—350; DOI: 10.1016/j.neuroimage.2019.04.036
[11] Kaczmarz et al. Characterizing white matter fiber orientation effects on multi-parametric quantitative BOLD assessment of oxygen extraction fraction. Journal of Cerebral Blood Flow and Metabolism 2019; 0(0):1-15; DOI: 10.1177/0271678X19839502
[12] Doucette J et al. A. Rapid Solution of the Bloch-Torrey Equation in Anisotropic Tissue: Application to Dynamic Susceptibility Contrast MRI of Cere
[13] Denk et al. The influence of white matter fibre orientation on MR signal phase and decay. NMR in Biomedicine 2011; 24(3):246—252; DOI: 10.1002/nbm.1581
[14] Trianntafyllou et al. Comparison of physiological noise at 1.5 T, 3 T and 7 T and optimization of fMRI acquisition parameters. NeuroImage 2005; 28(1): 243-250; DOI: 10.1016/j.neuroimage.2005.01.007
[15] Van Essen, DC et al. The Human Connectome Project: A Data Acquisition Perspective. NeuroImage 2012; 62(4):2222—2231; DOI: 10.1016/j.neuroimage.2012.02.018
[16] Glasser MF et al. The Minimal Processing Pipelines for the Humans Connectome Project. NeuroImage 2013; 80:105—124; DOI: 10.1016/j.neuroimage.2013.04.127
[17] Zhang S and Arfanakis K. Evaluation of standardized and study-specific diffusion tensor imaging templates of the adult human brain: Template characteristics, spatial normalization accuracy, and detection of small inter-group FA differences. NeuroImage 2018;172:40-50.
[18] Salamon et al. Microradiographic Study of the Arterial Circulation of the Brain. Cerebral Circulation 1968; 30:31—41. DOI:10.1016/S0079-6123(08)61435-1 bral White Matter. NeuroImage 2019. 185:198—207; DOI: 10.1016/j.neuroimage.2018.10.035
Figures
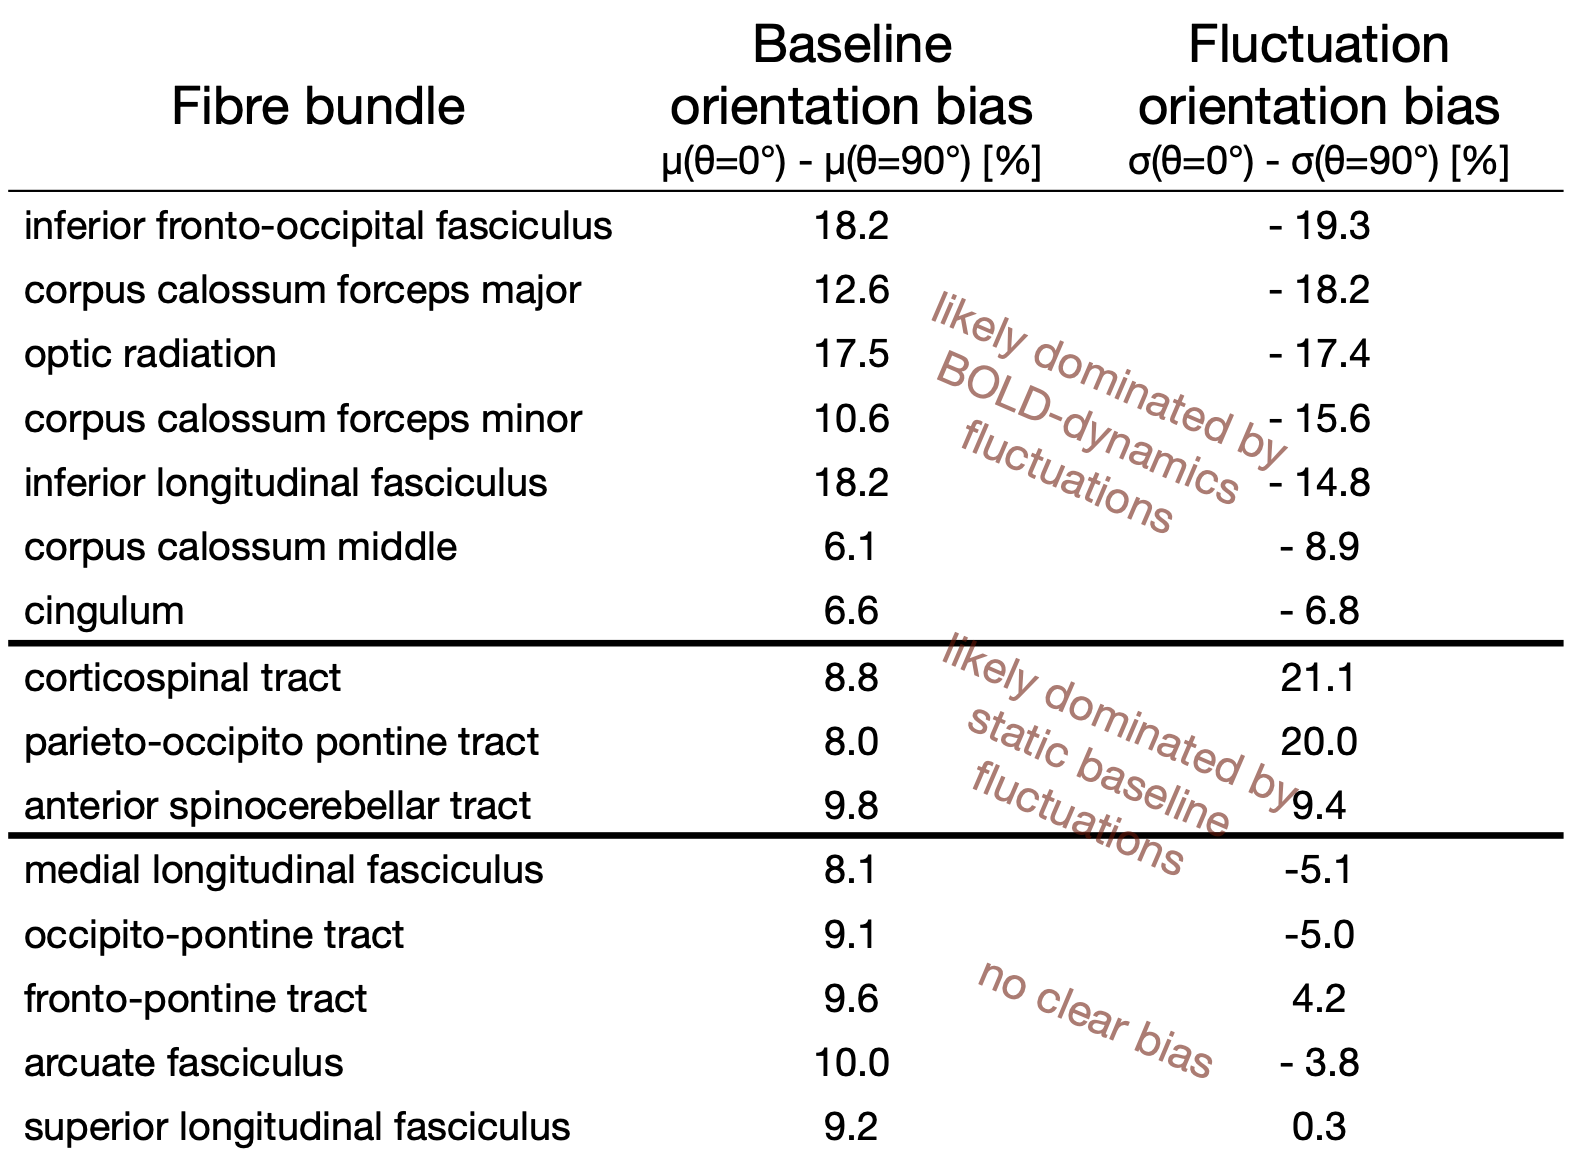
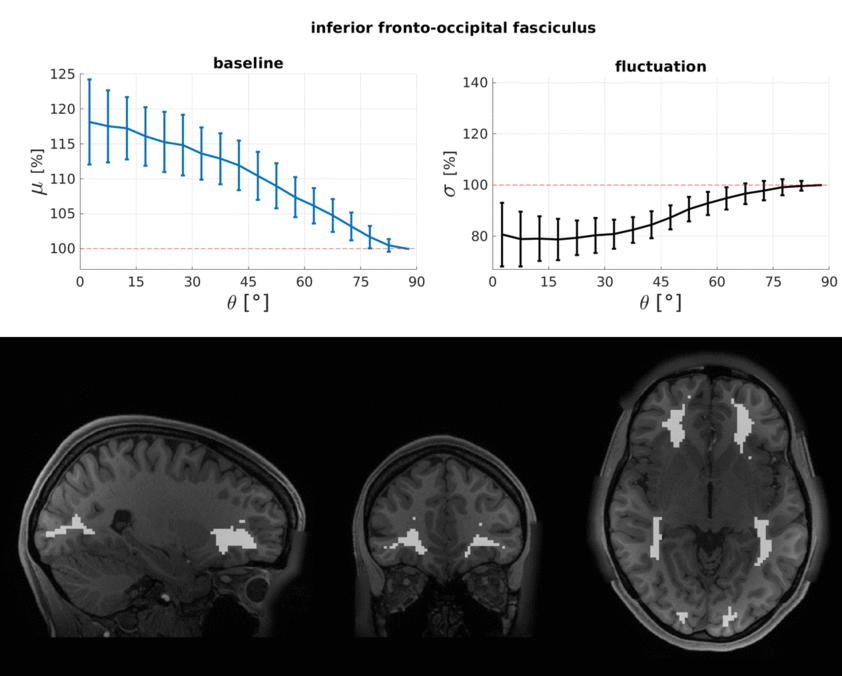
Top: The baseline μ(θ) and the temporal standard deviation σ(θ) averaged over 110 subjects (error bars are the standard deviation across the subjects). All bundles' baseline signals showed an approximate cos2θ trend. The fluctuation amplitudes were heterogeneous across bundles. Seven bundles had a negative fluctuation bias with parallel directions minimising σ (dynamics). In three bundles it was positive (static). Five bundles had mixed or no effects.
Bottom: Bundle masks in an exemplar subject.