1365
Transition Frequencies across the Brain States under Stress Differentiate Depression Vulnerability1Center for Biomedical Imaging Research, Department of Biomedical Engineering, School of Medicine, Tsinghua University, Beijing, China, 2Radiological Sciences Laboratory, Department of Radiology, Stanford University, Palo Alto, CA, United States, 3Department of Psychiatry, University of Connecticut School of Medicine, Farmington, CT, United States
Synopsis
Brain state transitions during resting-state reflect the variation of the baseline homeostasis, it is still unclear how the state interactions are modulated under stress. In the current study, the stress-induced change of the co-activation pattern transitions was examined in two independent cohorts by scanning resting-state fMRI pre- and post- a math task, its association with depression vulnerability was also explored. The post- versus pre-stress resting-state comparison showed an increased state transition frequency under stress, and those with higher depression scores shifted more post-stress in both cohorts, indicating the disturbed brain homeostasis under stress and lower recovery ability from stress.
Background
Brain networks and subnetworks coalesce and dissolve over time, state transitions during resting-state reflect the fluctuation of our brain homeostasis, which might be modulated by various stimulations/brain dysfunctions. Studies in depression have reported diminished fluctuations in dynamic functional connectivity1,2; it is still obscure, however, how the state interactions are manipulated by stress. In the current study, we examined and compared the state alternation frequencies in pre- and post-stress resting-state runs in two independent datasets, to explore the stress-induced changes of the brain homeostasis. We hypothesized that the brain would transit more frequently across different states under stress, and the post- versus pre-stress state alternations change would differentiate those depression vulnerable under both cohorts.Methods
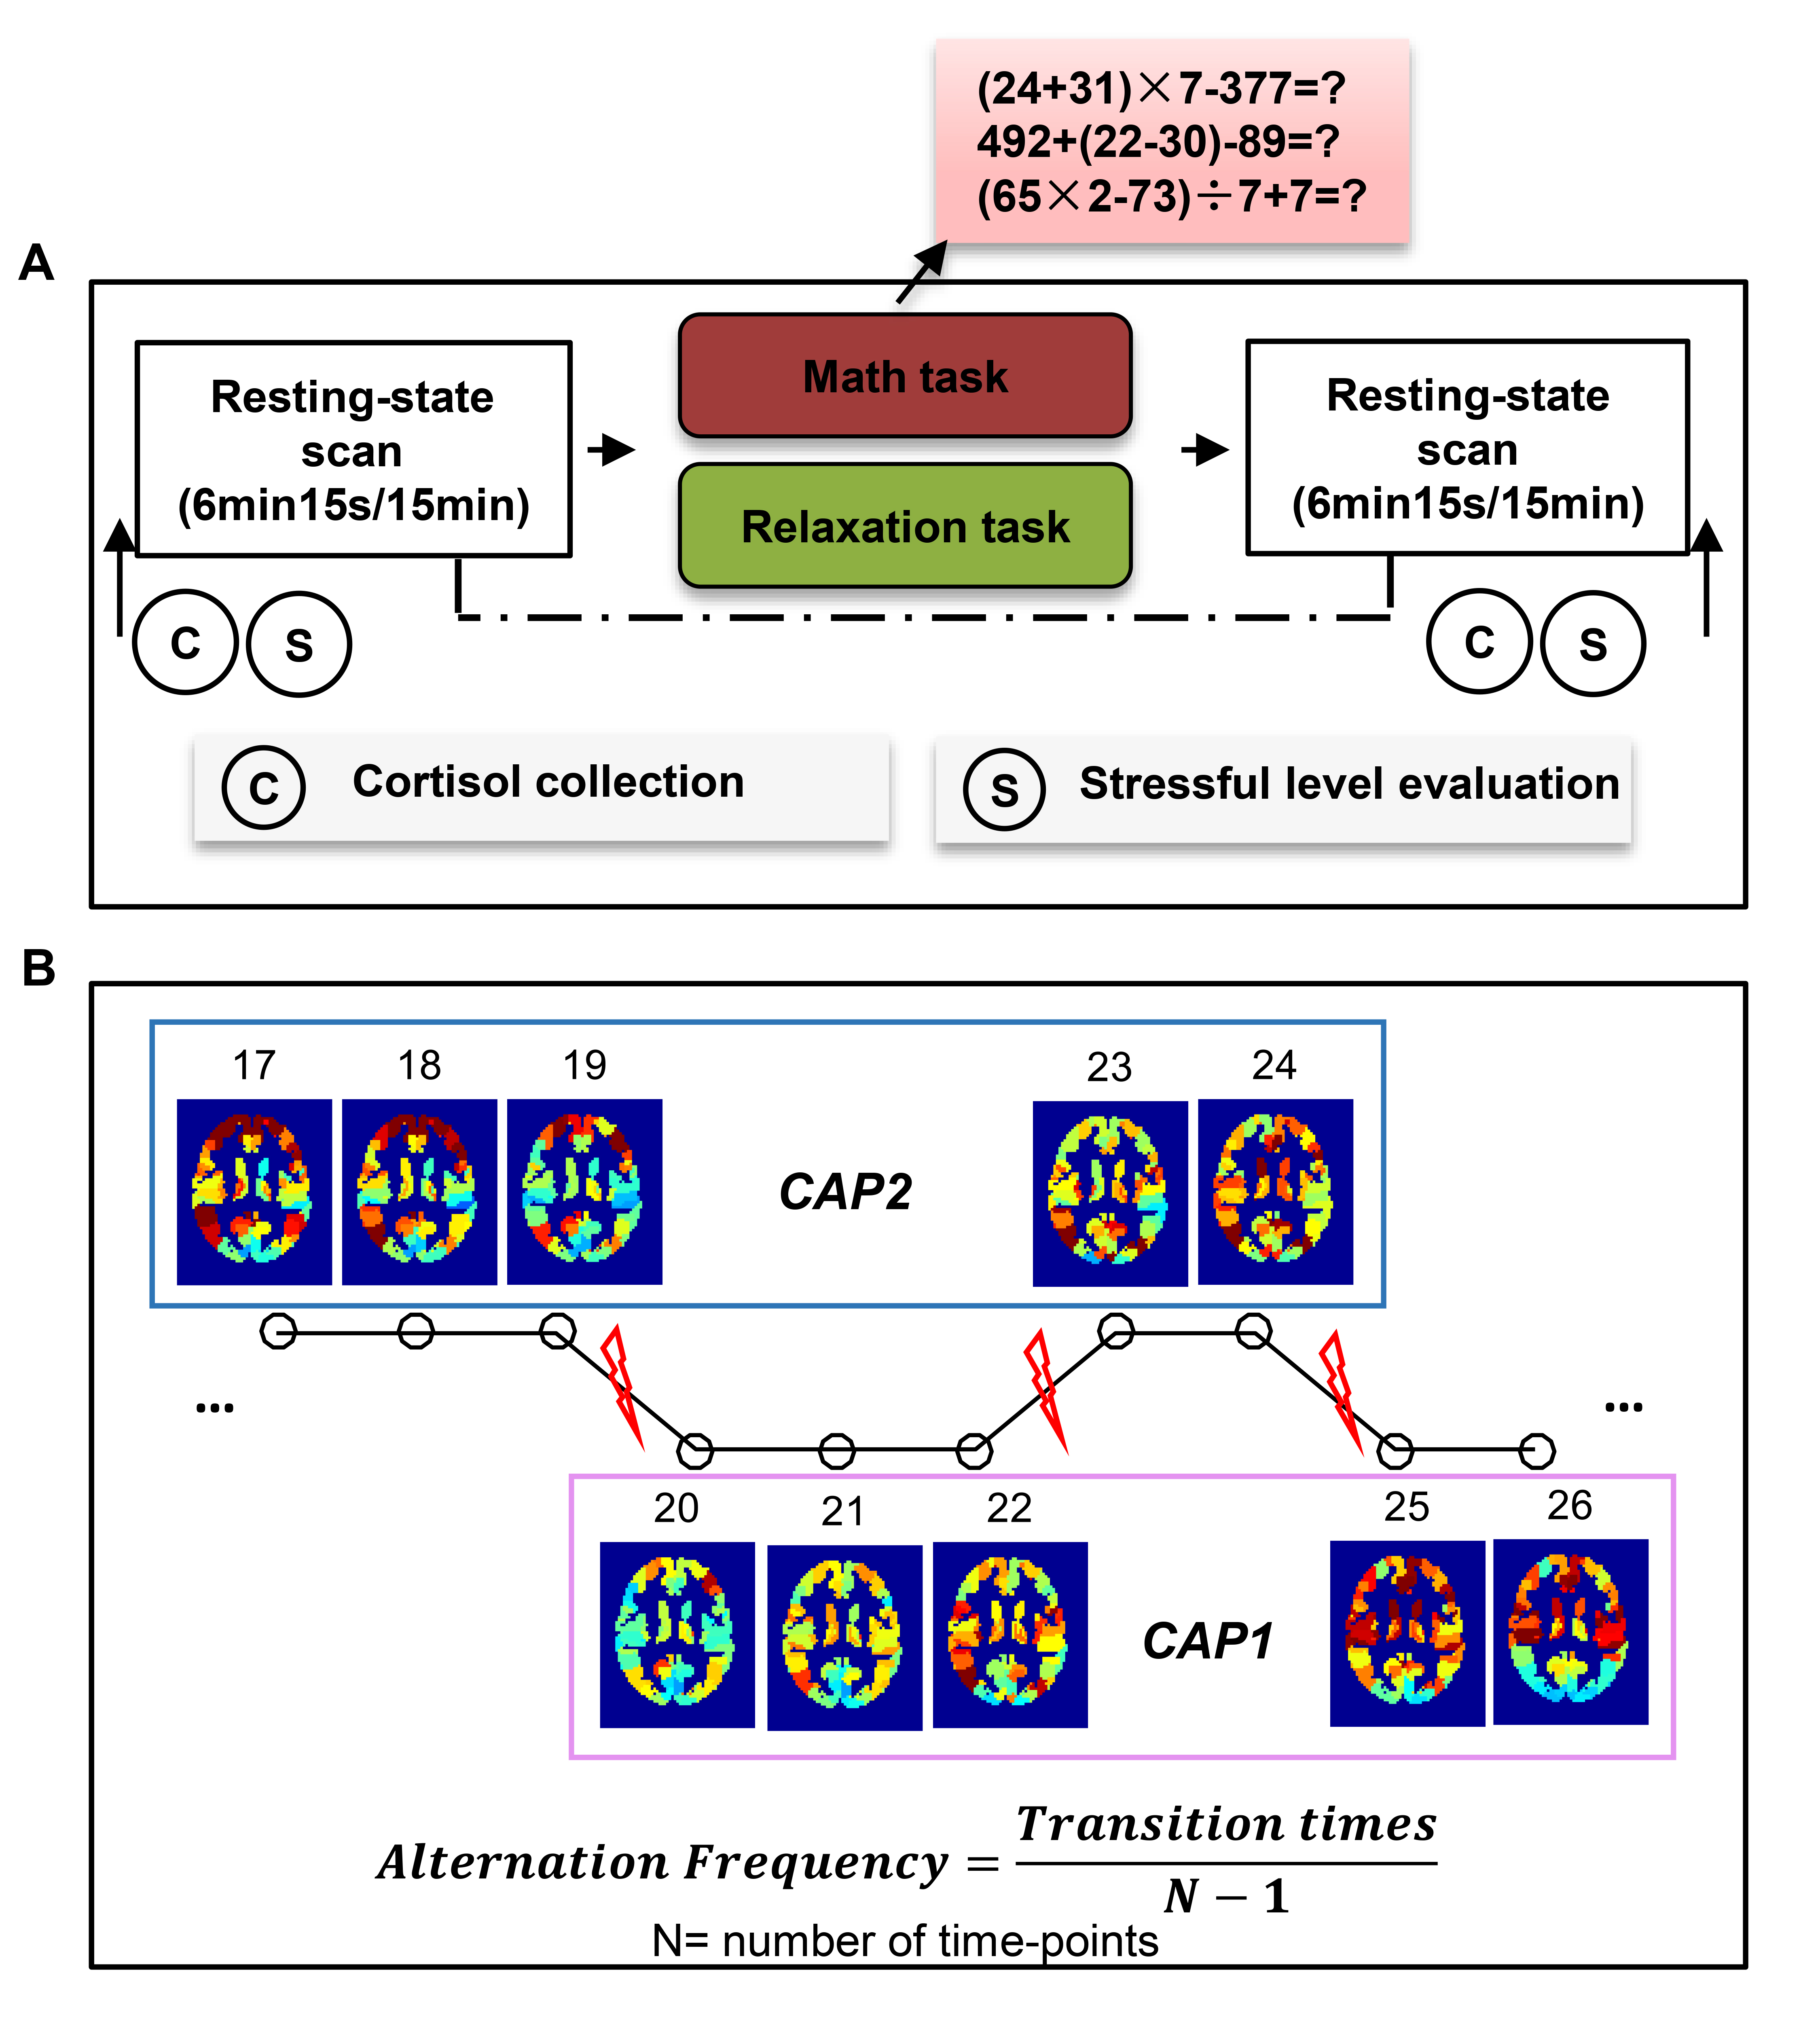
Subjects: Seventeen healthy subjects (age = 22.00 ± 0.68 years) in cohort/experiment 1 (Exp.1) and thirty-nine healthy subjects (age = 23.10 ± 2.70 years) in cohort/experiment 2 (Exp.2) were recruited through advertisement in two independent studies to complete similar scanning procedures. The 13-item Beck Depression Inventory (BDI) was used to assess depression symptoms 3. All subjects in Exp.2 were subdivided into low BDI group (BDI ≤ 7, n = 25, none to mild depression) and high BDI group (8 ≤ BDI ≤ 17, n = 14, moderate to severe depression); Subjects in Exp.1 were not divided given the smaller sample size.Data acquisition: In both cohorts/experiments, a mathematic calculation task (examples in Fig. 1A) and a counting breath task were employed to induce a stressful and relaxing state, respectfully. A resting-state fMRI (6min and 15s in Exp.1 and 15min in Exp.2) was acquired before and after each task (Fig. 1A) with conventional fMRI parameters (TR = 2.5s, voxel size = 3.5 × 3.5 × 3.85 mm3 in Exp.1; TR = 2s, voxel size = 3.5 × 3.5 × 4 mm3 in Exp.2). Subjects’ stressful levels were evaluated pre- and post-tasks. More details regarding the experiments are found in our previous publications 4,5.
Data analysis: The whole-brain co-activation pattern (CAP) analysis 6, which uses k-means clustering to classify time points into multiple groups based on spatial correlations of their instantaneous co-activation patterns, was implemented to define/divide brain states. Specifically, whole-brain time-series from each resting-state run were demeaned and variance-normalized after standard preprocessing, and the mean time-courses for 246 ROIs from a well-established template were extracted 7. For each task session (pre- and post-task resting-state runs in Exp.1 or Exp.2), all subjects’ data were concatenated into a 2D matrix [(subjects × time-points × 2 runs), ROIs], and entered into the k-means classification (k = 2,3 … 10 for Exp.1 considering the short scanning period; k = 2, 3 … 15 for Exp.2) with the spatial correlation of the CAPs as the distance measure 8. All classifications were repeated 100 times with randomized initial values to find the optimal clustering. CAPs were derived by calculating the centroids of each subgroup. Alternation frequency (AF) was calculated through the transition rate of CAPs, which is the number of times that the brain state shifts from the current CAP to another CAP, divided by the number of time-points minus one 9 (Fig. 1B).
Results
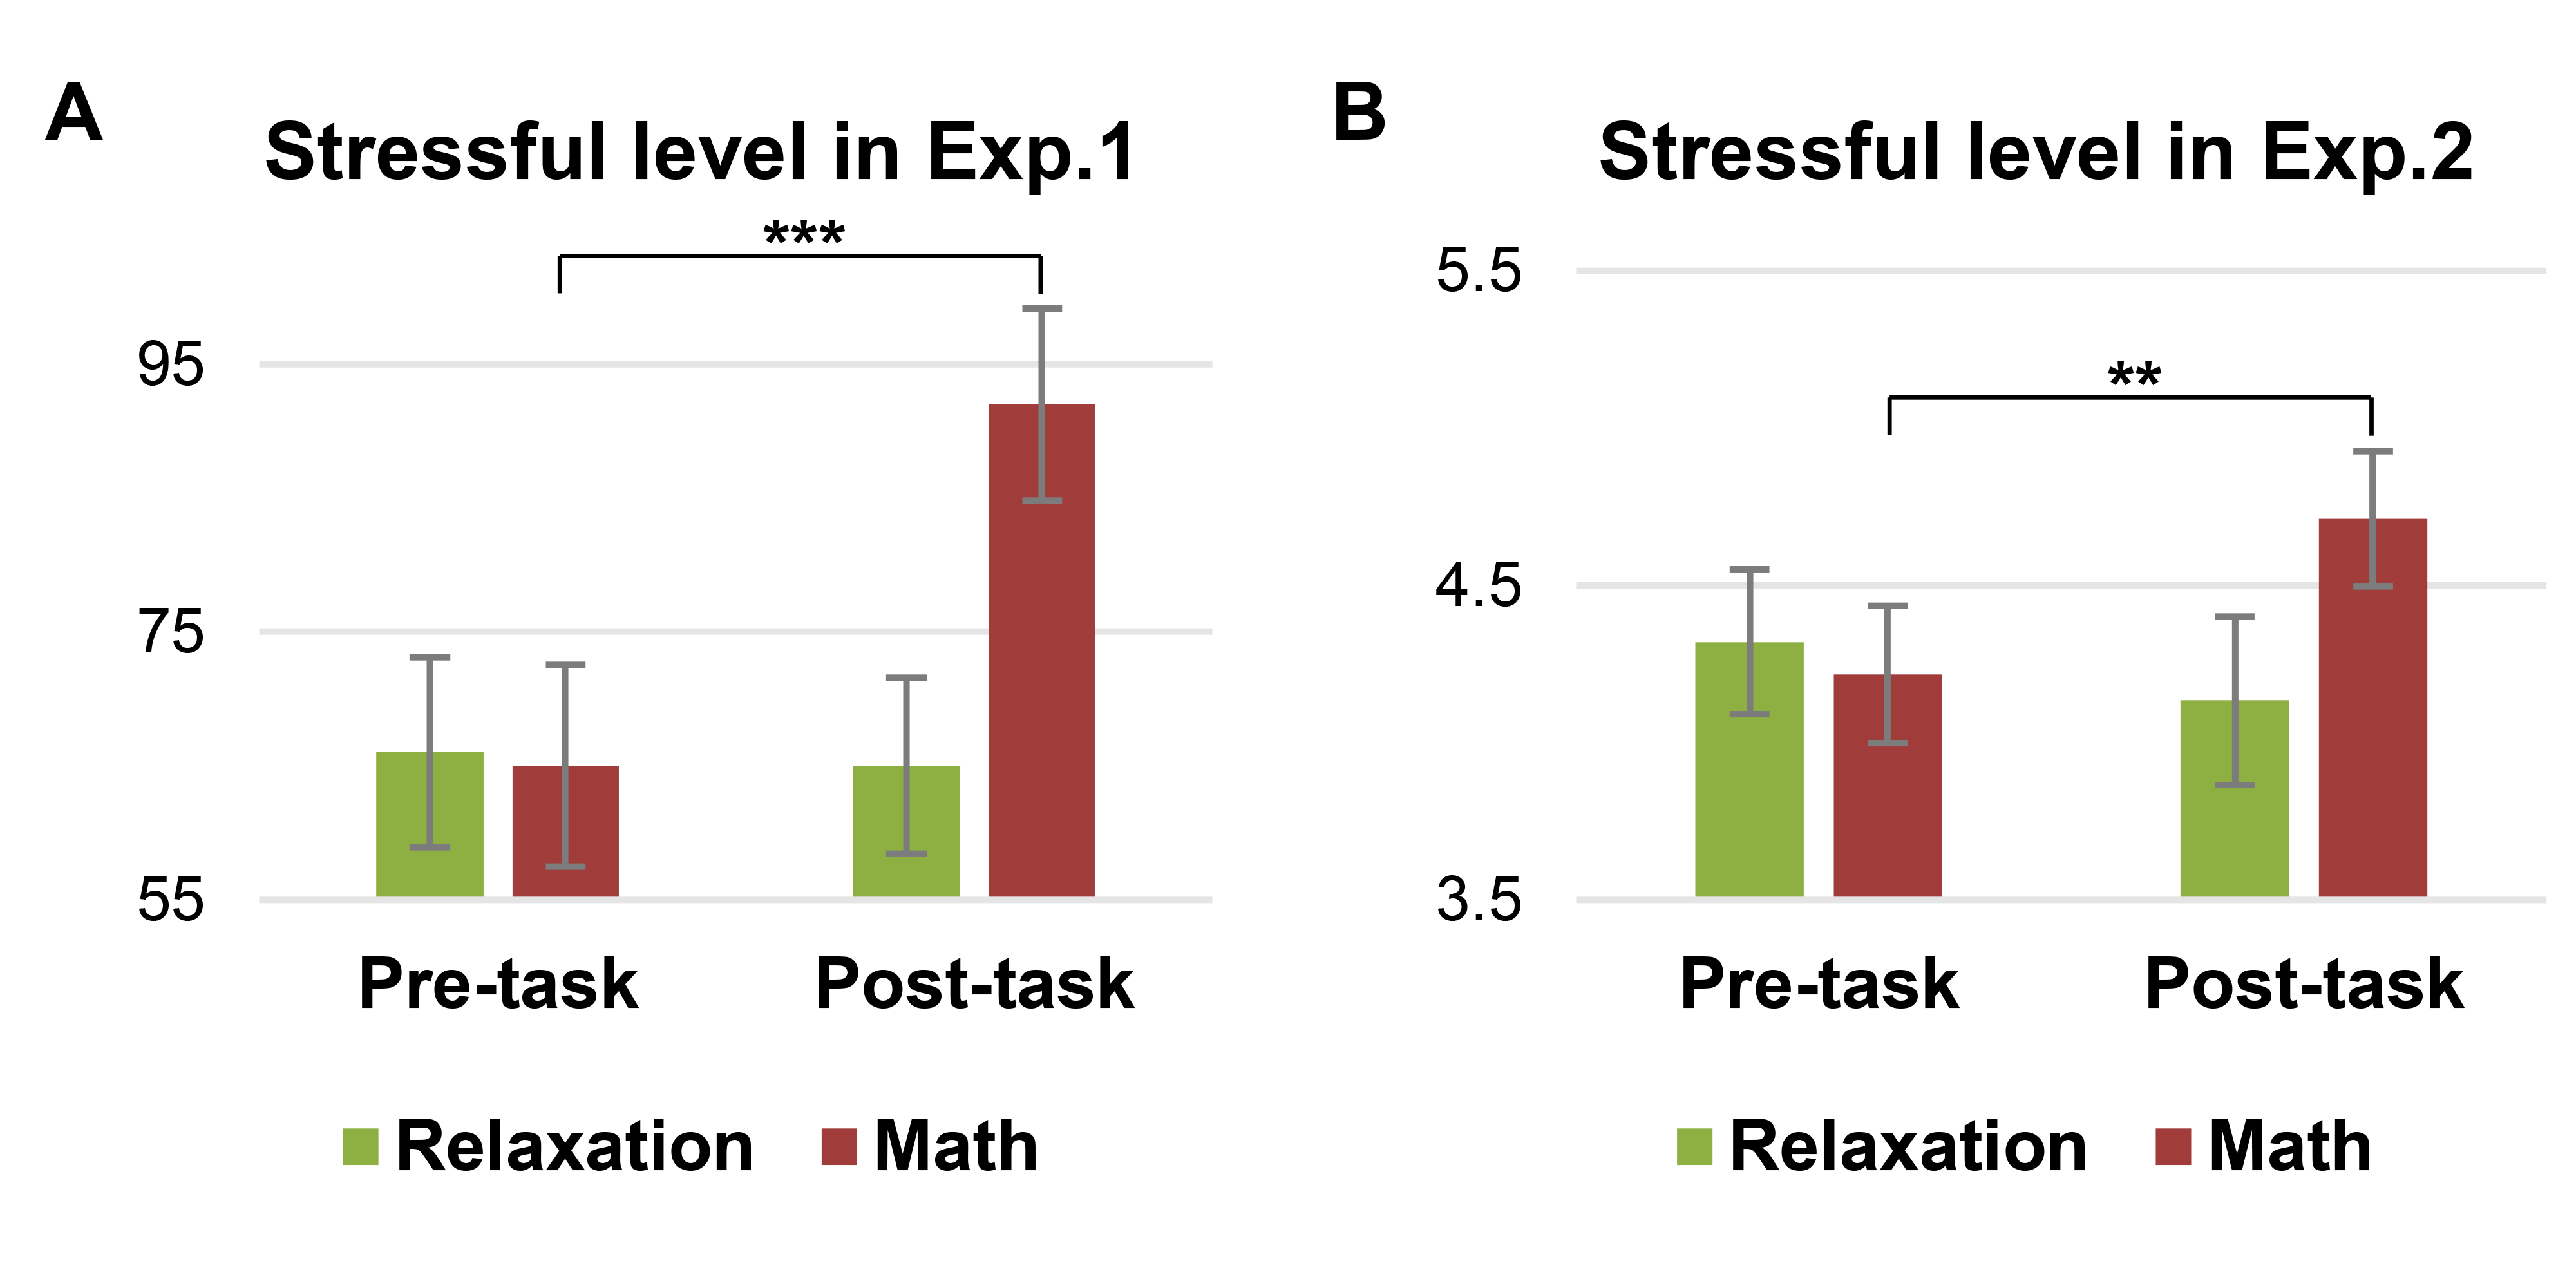
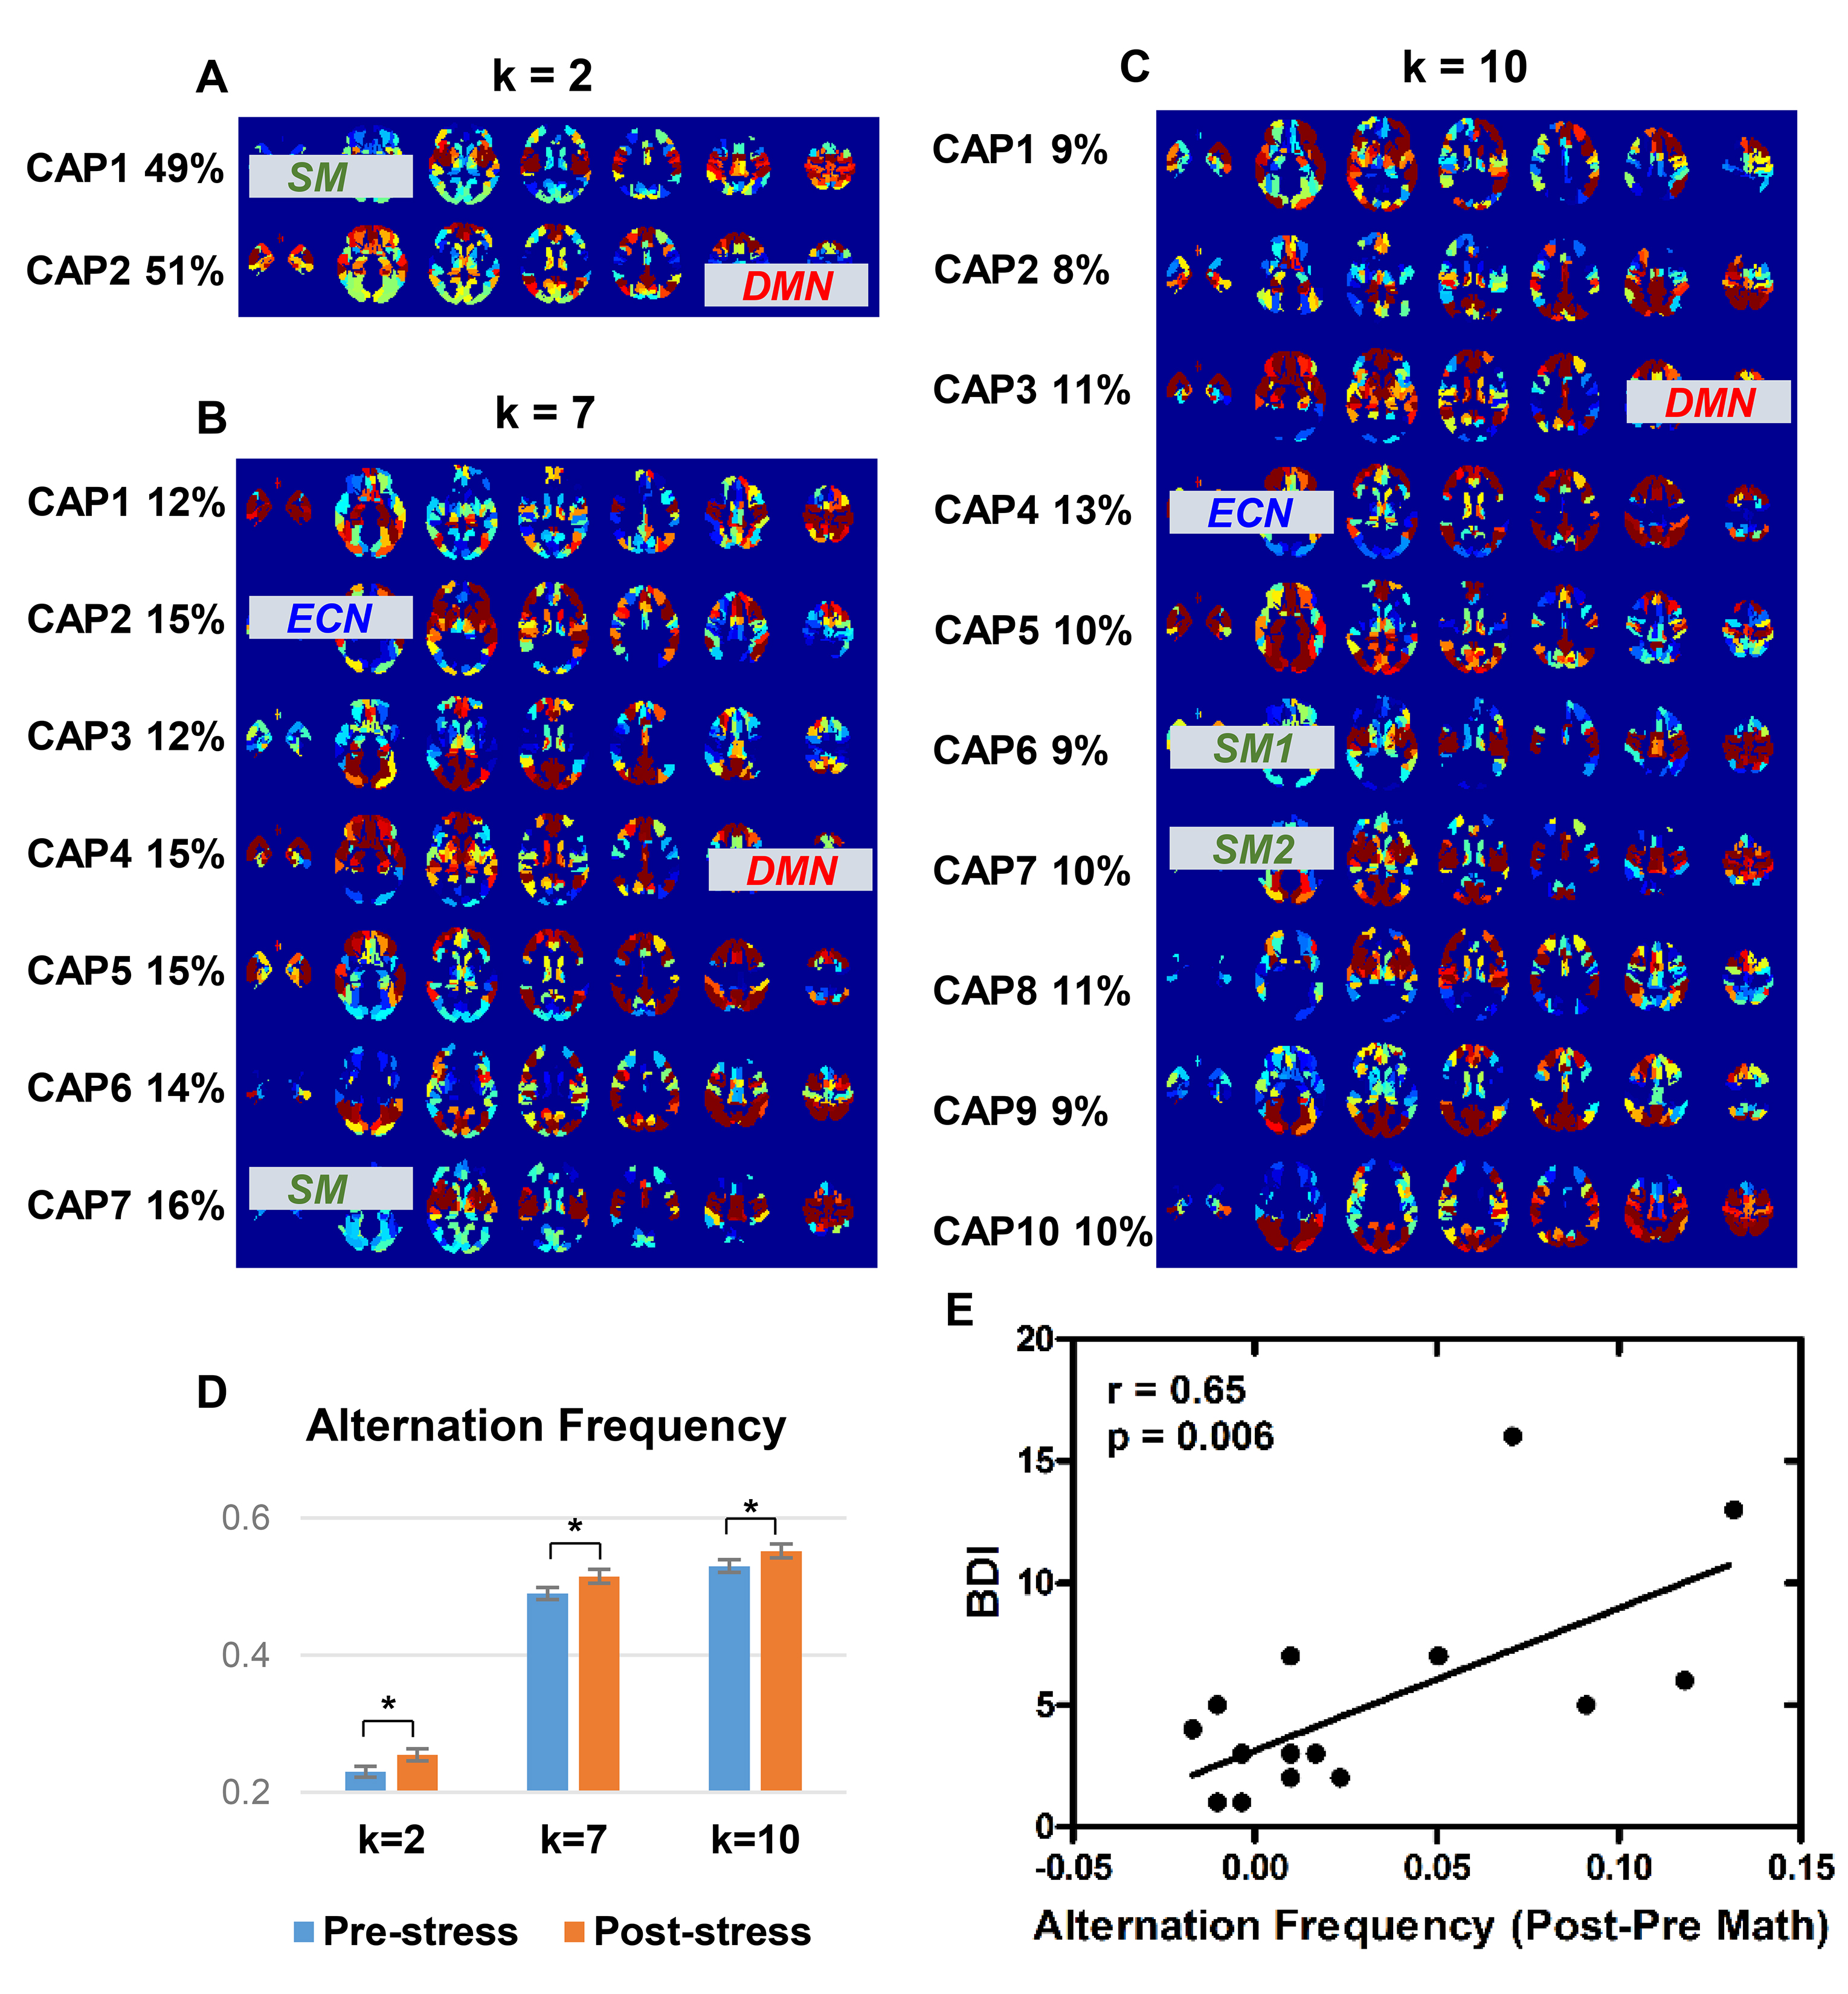
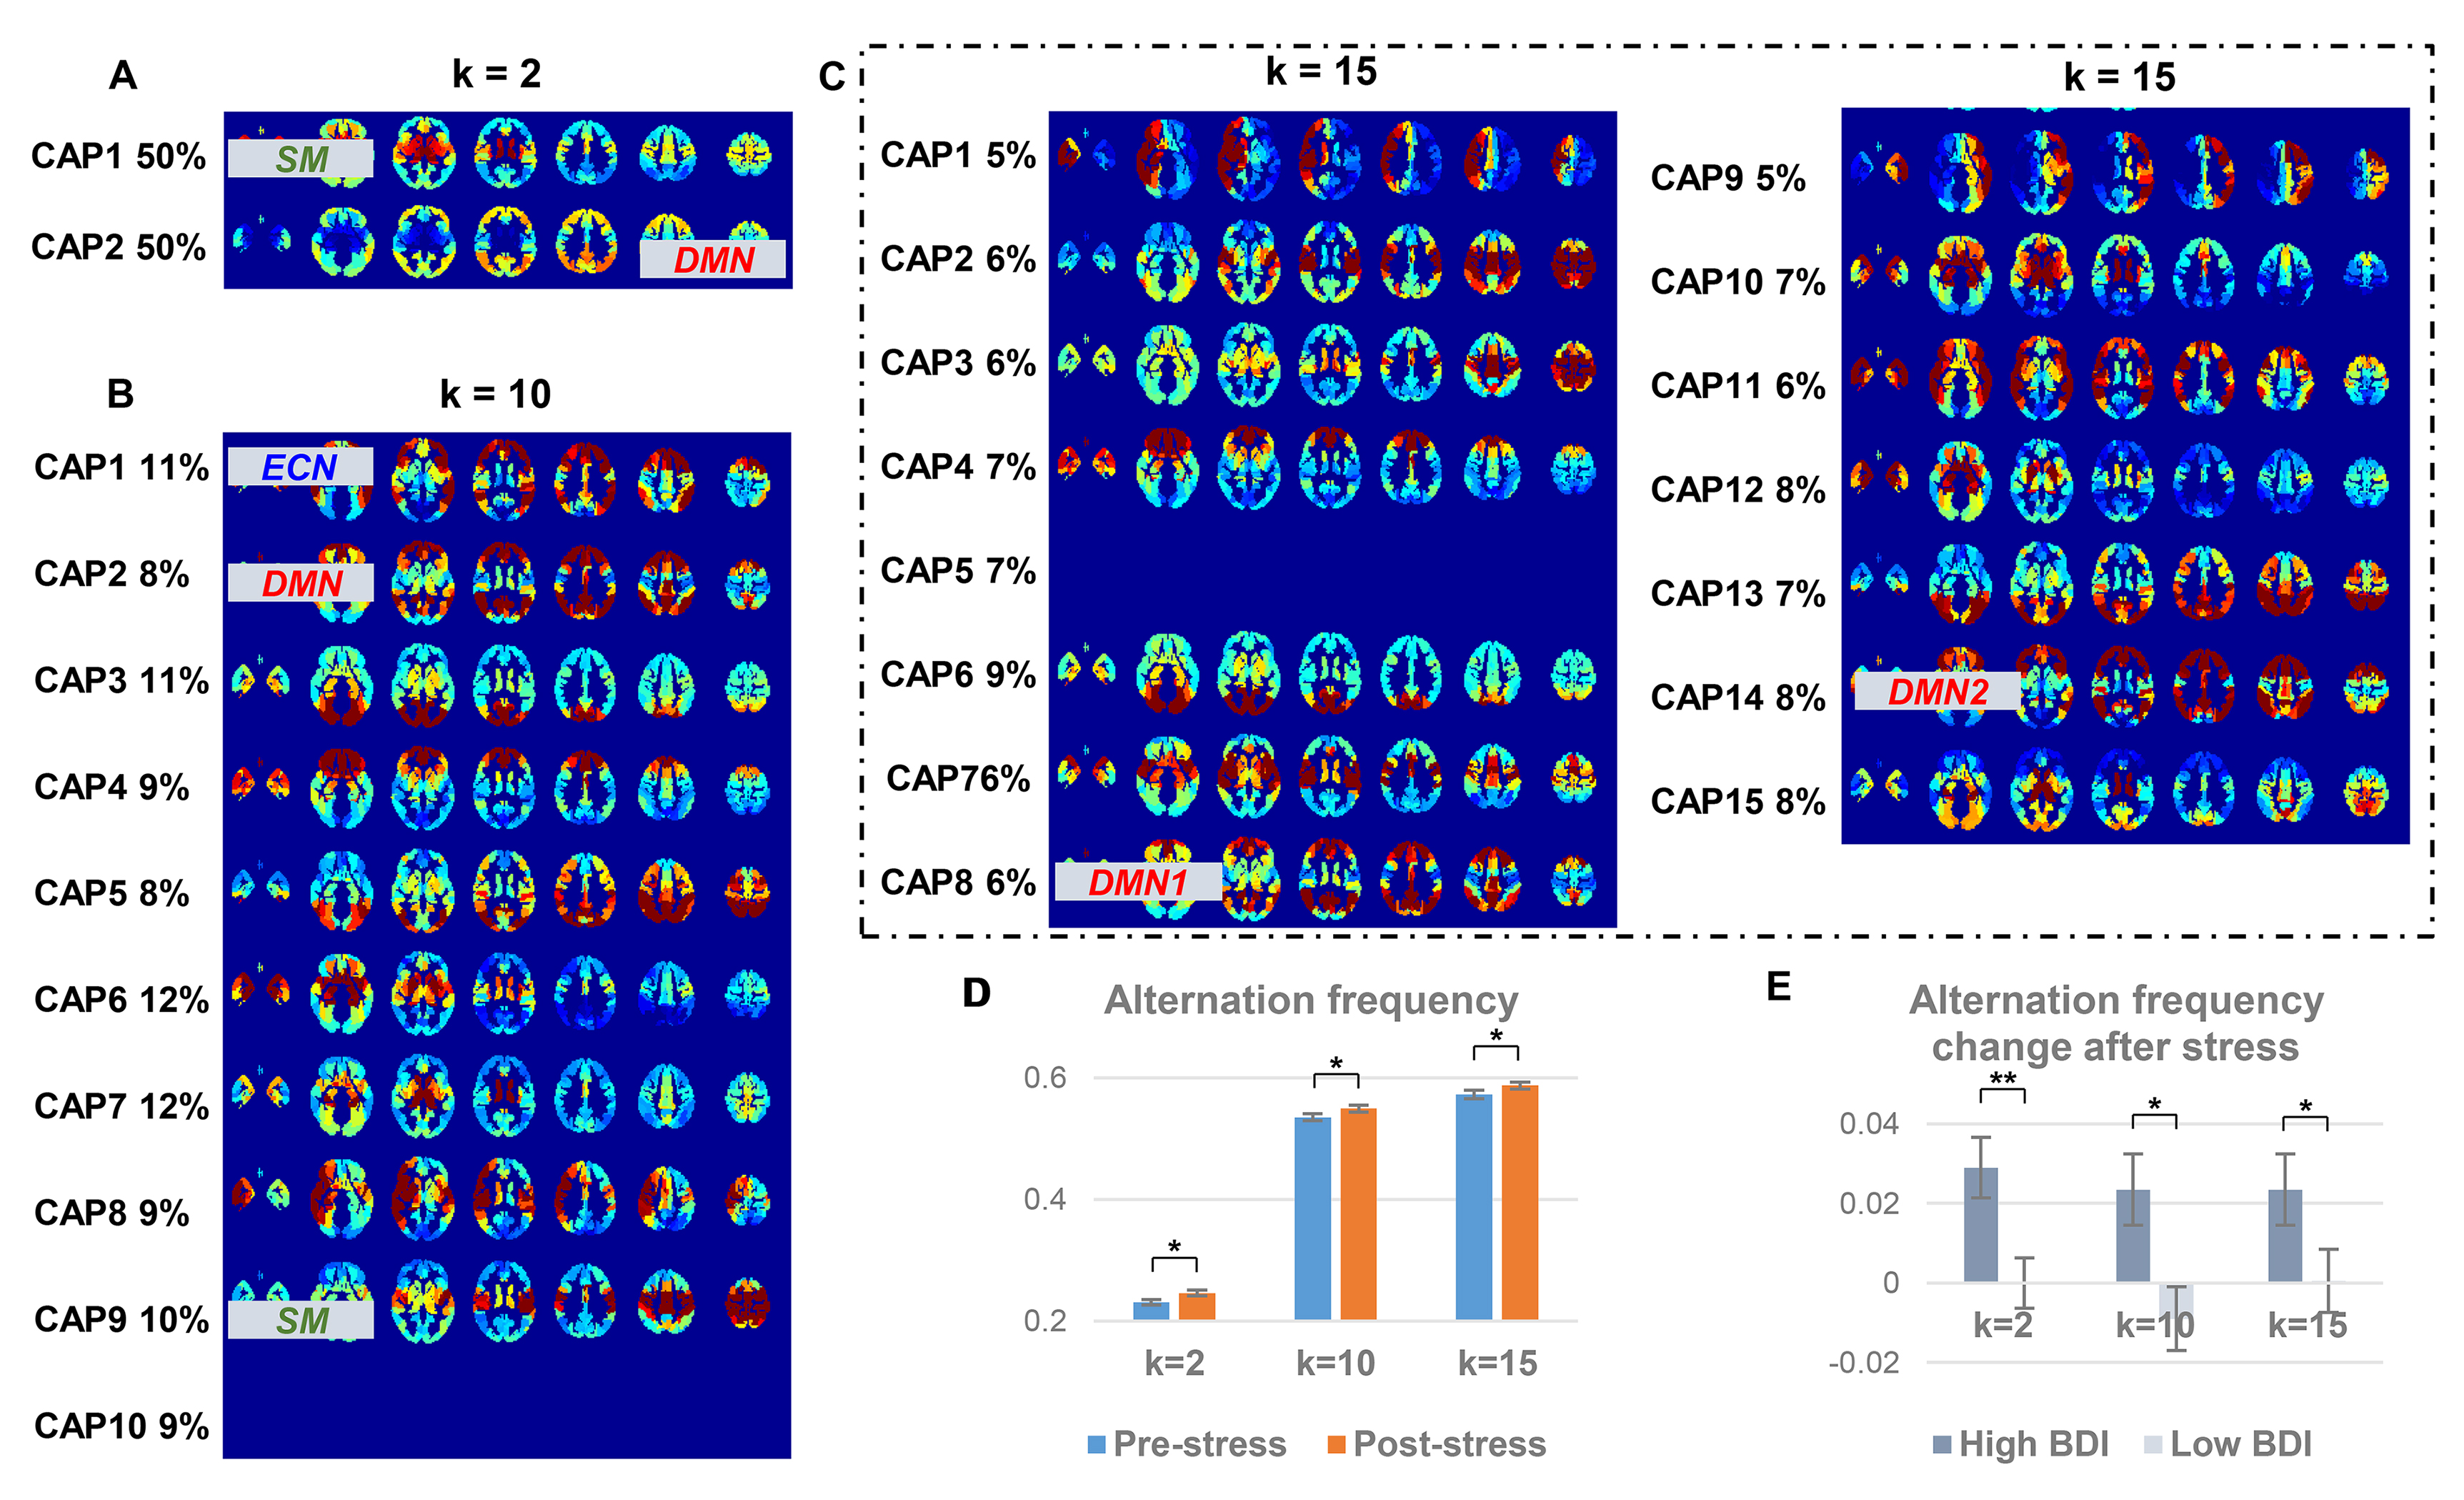
Individuals’ stressful levels increased after the math task in both cohorts (Fig. 2), indicating successfully inducing a stressful state.We here choose k = 2, 7, 10 for Exp.1 and k = 2, 10, 15 for Exp.2 to show the CAPs and AFs under stress conditions (Fig. 3 and Fig. 4); the results of the relaxation task are not shown considering no significant AF changes were observed post-relaxation task.
Some CAPs obtained from the two stress experiments show a high consistency with well-known functional networks regardless of the choice of k, others cover more than one network at a time. When k = 2 (Fig. 3A for Exp.1 and Fig. 4A for Exp.2), CAP1 involves sensory-motor areas and subcortical regions, CAP2 locates in the default mode network (DMN). When k = 10 (Fig. 3C for Exp.1 and Fig. 4B for Exp.2), CAP3 of Exp.1 and CAP2 of Exp.2 cover the DMN areas, CAP4 of Exp.1 and CAP1 of Exp.2 resemble the executive control network (ECN), and CAP6 and CAP7 of the Exp.1 and CAP9 of the Exp.2 include the sensory-motor regions.
The AF significantly increased post-stress tasks for 8 out of 9 k values in Exp.1 and 12 out of 14 k values in Exp. 2 (examples shown in Fig. 3D for Exp.1 and Fig. 4D for Exp.2). Interestingly, the AF change was positively correlated with the BDI scores in Exp.1 except k = 8 (k = 2 in Fig. 3E), and the AF increase post-stress was significantly greater in the high BDI group than the low BDI group in Exp.2 except k = 12 and k = 13 (k = 2, 10, 15 in Fig. 4E).
Conclusions
In the current study, we examined the stress-induced state alternation changes, consistent findings were reported in two independent cohorts. As we hypothesized, the stress task aggravated the state transition rate, indicating the stress-induced disturbance of the brain homeostasis. In addition, the transition frequency increase under stress could differentiate individuals with more severe depression symptoms, implying their incapacity to recover to the pre-stress state.Acknowledgements
The authors thank Dr. Gary H. Glover for helpful comments on the abstract. This study was supported by the National Natural Science Foundation of China (31271080, 61571258), and the National Key Research and Development Program of China (2017YFA0205904, 2017YFC0108900).References
1. Kaiser RH, Whitfield-Gabrieli S, Dillon DG, et al. Dynamic Resting-State Functional Connectivity in Major Depression. Neuropsychopharmacology 2016;41(7):1822-1830.
2. Demirtas M, Tornador C, Falcon C, et al. Dynamic Functional Connectivity Reveals Altered Variability in Functional Connectivity Among Patients With Major Depressive Disorder. Hum Brain Mapp 2016;37(8):2918-2930.
3. Beck AT, Beck RW. Screening depressed patients in family practice. A rapid technic. Postgrad Med 1972;52(6):81-85.
4. Zhang X, Huettel SA, Mullette-Gillman OA, Guo H, Wang LH. Exploring common changes after acute mental stress and acute tryptophan depletion: Resting-state fMRI studies. J Psychiatr Res 2019;113:172-180.
5. Zhang X, Li X, Steffens DC, Guo H, Wang L. Dynamic changes in thalamic connectivity following stress and its association with future depression severity. Brain Behav 2019:e01445.
6. Liu X, Chang C, Duyn JH. Decomposition of spontaneous brain activity into distinct fMRI co-activation patterns. Front Syst Neurosci 2013;7:101.
7. Fan L, Li H, Zhuo J, et al. The Human Brainnetome Atlas: A New Brain Atlas Based on Connectional Architecture. Cereb Cortex 2016;26(8):3508-3526.
8. Liu X, Duyn JH. Time-varying functional network information extracted from brief instances of spontaneous brain activity. Proc Natl Acad Sci U S A 2013;110(11):4392-4397.
9. Chen JE, Chang C, Greicius MD, Glover GH. Introducing co-activation pattern metrics to quantify spontaneous brain network dynamics. Neuroimage 2015;111:476-488.
Figures