1363
Exploring the neurovascular nature of spontaneous cerebral BOLD fluctuations in 1730 individuals – The Maastricht Study1Radiology and Nuclear Medicine, Maastricht University Medical Center, Maastricht, Netherlands, 2Mental Health and Neuroscience, Maastricht University, Maastricht, Netherlands, 3Electrical Engineering, Eindhoven University of Technology, Eindhoven, Netherlands, 4Computer Science, KU Leuven, Leuven, Belgium, 5Internal Medicine, Maastricht University Medical Center, Maastricht, Netherlands, 6School for Cardiovascular Disease, Maastricht University, Maastricht, Netherlands
Synopsis
In addition to spatial patterns, also temporal patterns can be identified in brain signal as non-stationary components. Fourier-transform provides only information about characteristic frequency components in dynamic brain signals and assumes that these are of stationary nature. However, brain signals are non-stationary and discrete wavelet transformation can be used to separate the signal into both frequency subbands and time-scales. In The Maastricht Study (n=1730), we found that wavelet analysis is a suitable method to demonstrate that physiological measures are associated with specific frequency subbands of the BOLD signal, and to separate the neurovascular signal into subbands representing different physiological measures.
Introduction
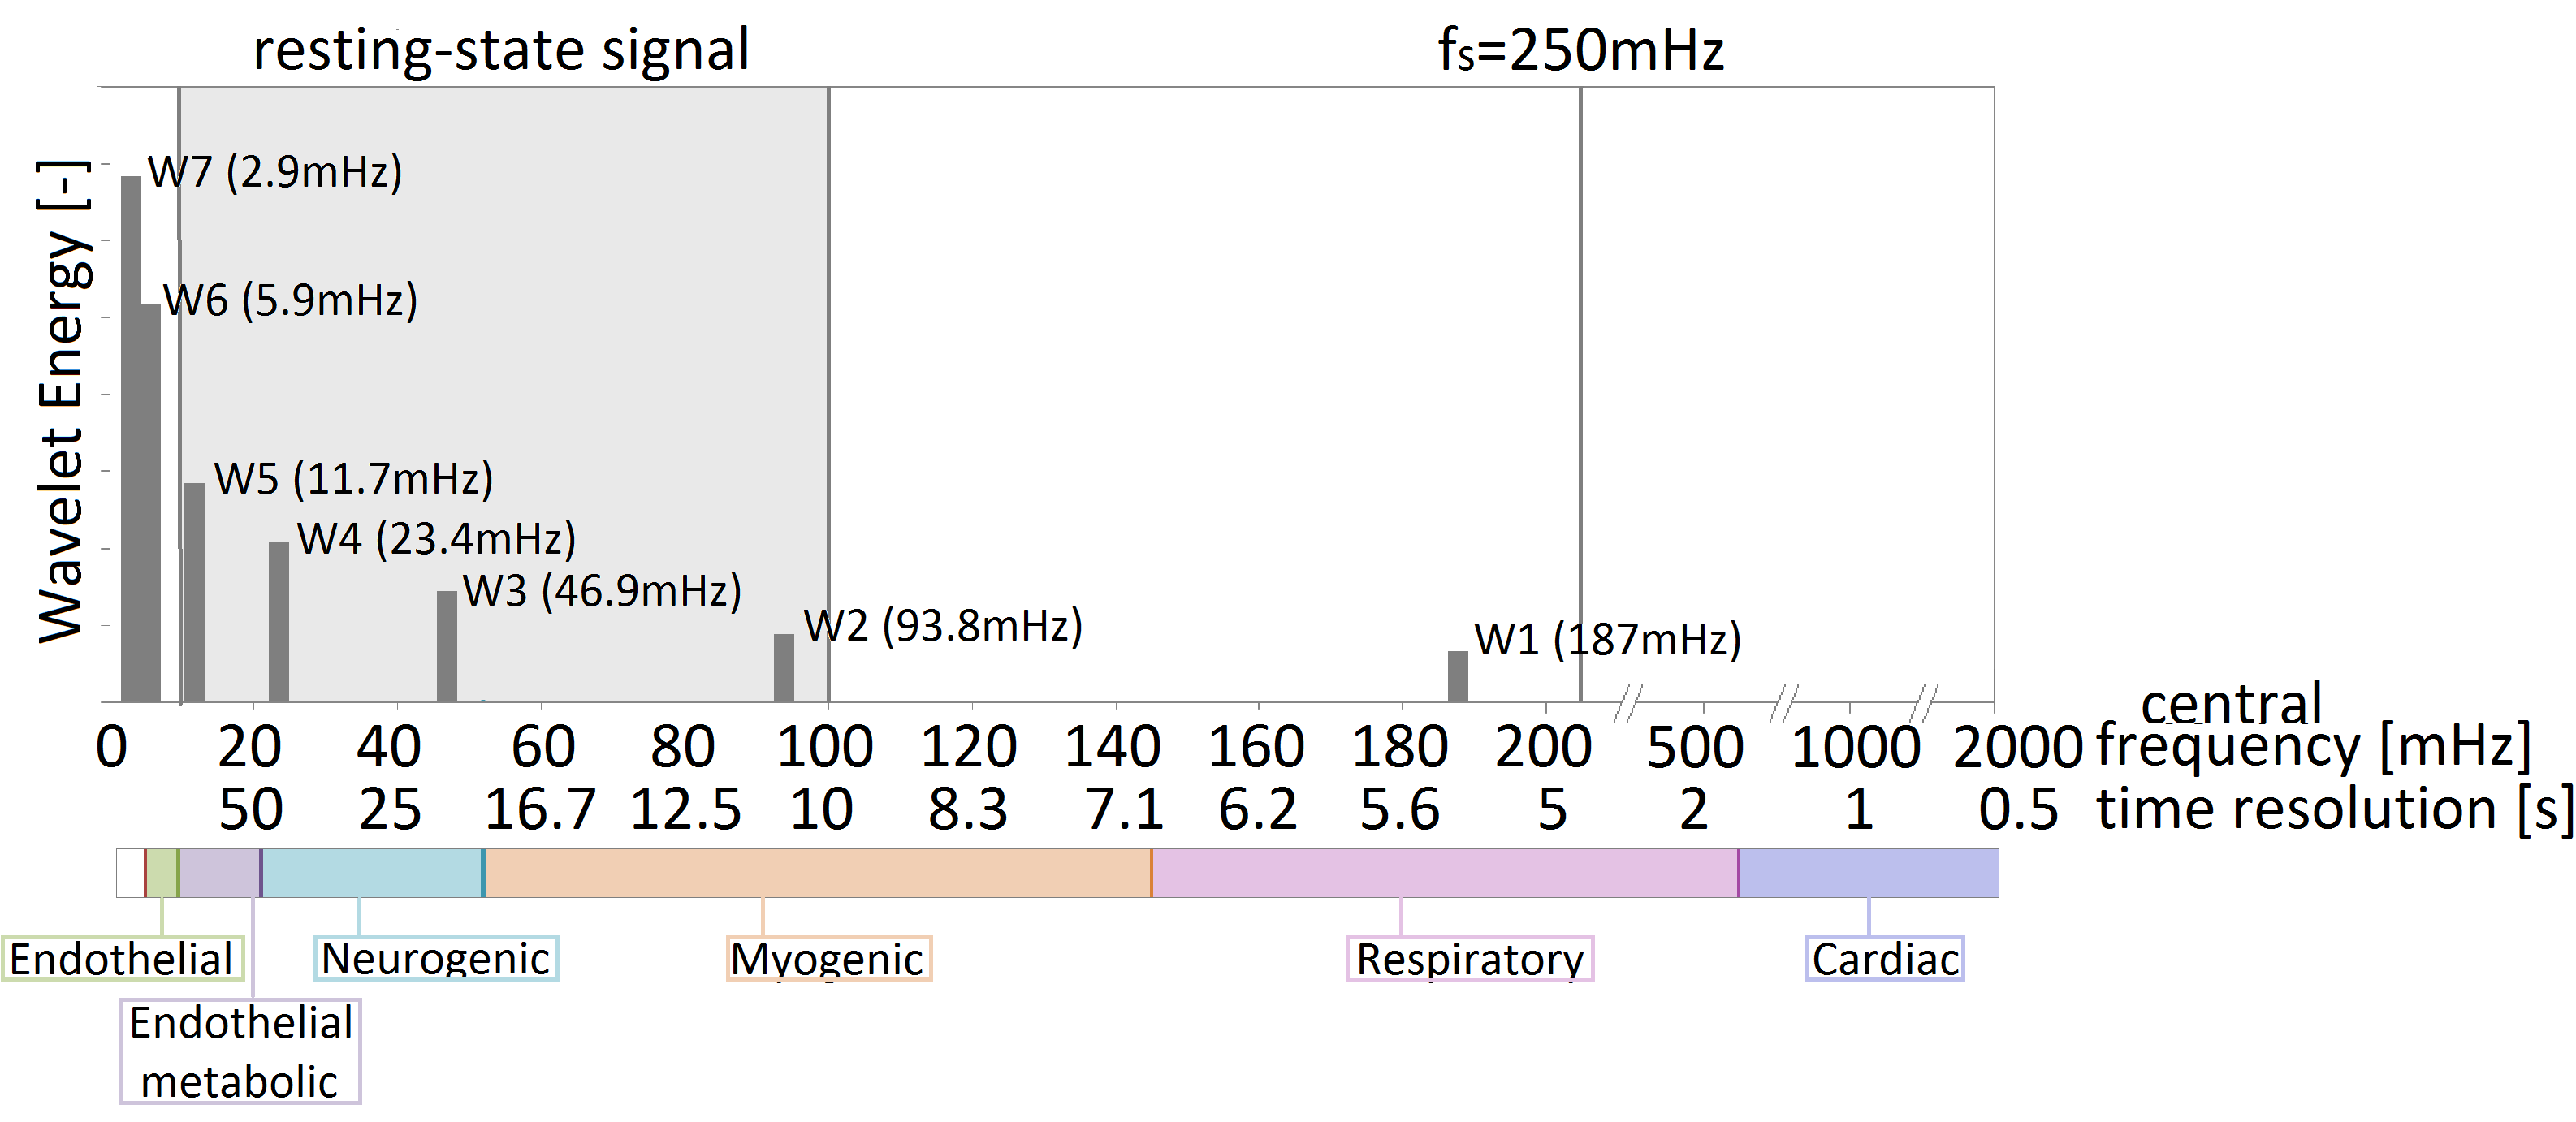
The vast majority of functional MRI studies investigating brain activity patterns consider the magnitude of the neuronal signal or correlations of dynamic signals between various brain regions to determine the brain network based on functional connectivity. In multiple studies, it has been demonstrated that the resting-state frequency (10-100 mHz) components reflects the neurovascular coupling signal as these components correlate with cognitive performance. Recent studies have indicated that, in addition to spatial patterns (i.e., functional activity as well as connectivity between brain regions); also temporal patterns (i.e., patterns at specific time-scales) can be found in the brain signal with non-stationary components1,2. Whereas Fourier-transform can reveal various characteristic frequency components in dynamic brain signals, it assumes periodically continuing components (i.e., stationary). Alternatively, discrete wavelet transformation (DWT) can be used to separate signal time-series into different frequency subbands with different time resolutions and it can properly manage non-stationary components.With this study, we aim to decompose the dynamic brain signal into wavelet components and explore to which extend the various frequency subbands (see Figure 1) correlate with obtained physiological measures in 1730 participants of the Maastricht study.
Methods
Subjects: In a subsample of the population-based Maastricht Study (n=1730, 52% men, aged 59±8 years), we performed 3T MRI (MAGNETOM Prisma fit, Siemens Healthcare, Erlangen, Germany).MRI: 3D T1-weighted magnetization prepared rapid acquisition gradient echo (MPRAGE) sequence (TR/TI/TE 2300/900/2.98 ms, 176 slices, 256×240 matrix size, 1.00 mm cubic voxel size). Resting-state functional MRI (rs-fMRI) data were acquired using a T2*-weighted blood oxygen level-dependent (BOLD) sequence (TR/TE 2000/29 ms, flip angle 90°, 32 slices, 104×104 matrix size, 2.00×2.00 mm pixel size, 4.00 mm thick transverse slices, and 195 dynamic volumes).
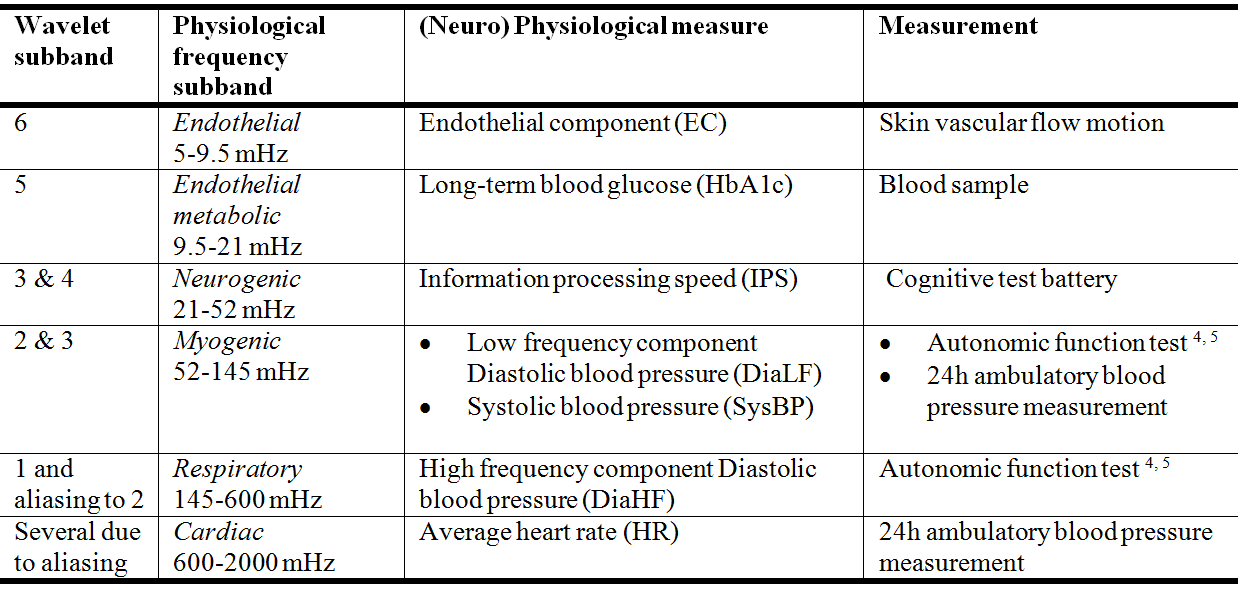
Physiological measures: Physiological measures for the physiological frequency subbands (as depicted in Figure 1) are described in Table 1. Further details about the measurements can be found in3.
Processing: Steps included correction for field-inhomogeneities, slice-timing, and head motion. Time-series were extracted for all gray matter voxels, standardized by subtraction of the mean signal, and divided by the standard deviation. For DWT, each time-series was decomposed into seven wavelet subbands, with the Daubechies-4 wavelet chosen as the mother wavelet function. To determine to which extend the signal is structured, the energy per decomposition level was calculated with the following formula: Energyj per decomposition level j: Ej=∑Sj(k)2, S=signal; k=time-point.
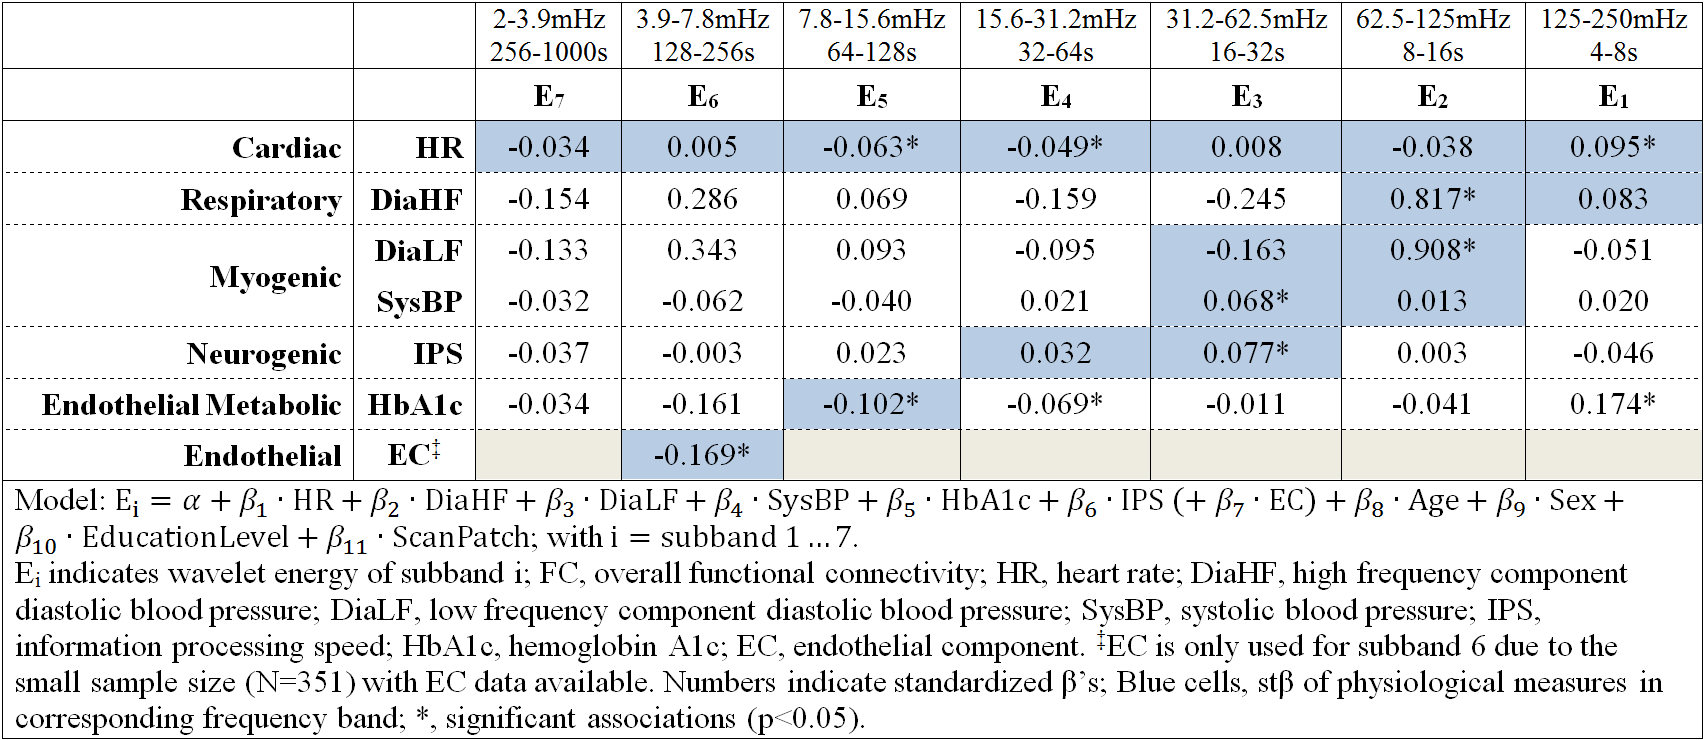
Statistics: Linear regression analysis was used to investigate the association of energy per subband with physiological measures. In this model, the energy per subband was used as the independent variable, and age, sex, educational level, and the physiological measures from Table 1 were included as dependent variables.
Results
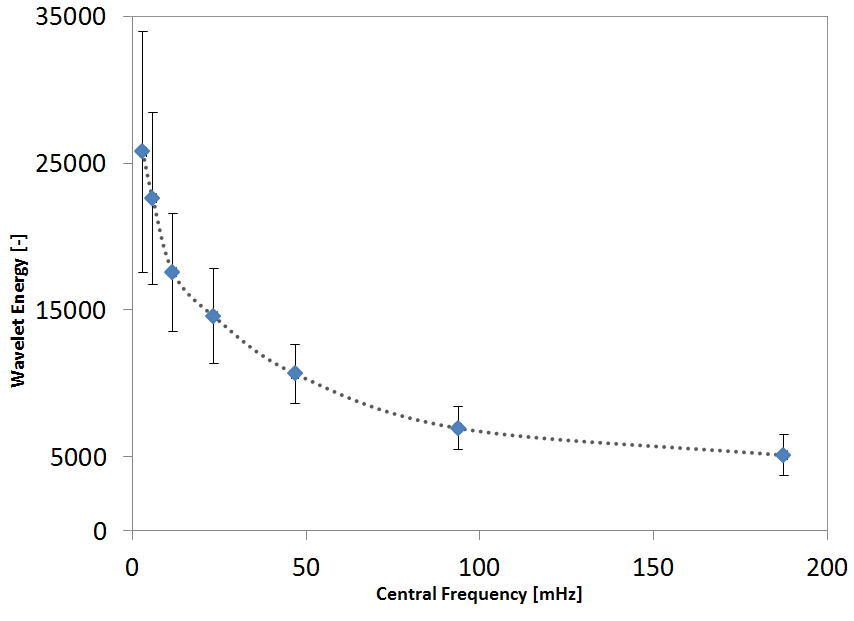
Figure 2 shows that the energy in the wavelet subbands more or less exponentially decreases from lower to higher frequency subbands, which is due to the low-pass nature of the slow and delayed hemodynamic response.In general, we observed significant associations between the energy of specific subbands with the expected physiological measures (Table 2). More specifically, we found associations of myogenic and respiratory measures with the energy of subband 2. SysBP and IPS with the energy of subband 3, long-term blood glucose (HbA1c) with the energy of subband 5, and the endothelial component of skin microvascular flow motion with the energy of subband 6. The HR is associated with the energy of subband 1, 4, and 5, which is likely due to aliasing of the cardiac signal into various lower frequency subbands, because of its high frequency compared to the maximum frequency of the fMRI signal (250 mHz). Long-term blood glucose (HbA1c) was also associated with the energy of subband 1, and the myogenic activity measures (DiaLF and SysBP) were both only significantly associated with one of the two matching subband energies (2 and 3).
Conclusion
These results suggest that physiological signals are associated with specific frequency subbands of the BOLD signal, but that some signals can also be detected in other subbands. The subband analysis showed that subband 3 contains the most specific information about the neurovascular signal in terms of cognitive function. To filter out cardiac and respiratory, scans with a lower repetition time (and thus higher sampling frequency) should be used. Interestingly, the low frequency subbands (<10mHz), which are usually excluded from fMRI analysis, contain relevant information about endothelial and metabolic activity. In future studies, these subbands can possibly be used to study the temporal influences of hypertension or diabetes on the neurovascular signal. In conclusion, wavelet analysis turned out to be a suitable method to separate the neurovascular signal into subbands representing different physiological measures.Acknowledgements
No acknowledgement found.References
1. Gupta L, Jansen JFA, Hofman PAM, Besseling RMH, de Louw AJA, Aldenkamp AP, et al. Wavelet entropy of BOLD time series: An application to Rolandic epilepsy. Journal of magnetic resonance imaging : JMRI. 2017;46(6):1728-37.
2. Smith RX, Jann K, Ances B, Wang DJ. Wavelet-based regularity analysis reveals recurrent spatiotemporal behavior in resting-state fMRI. Human brain mapping. 2015;36(9):3603-20.
3. Schram MT, Sep SJ, van der Kallen CJ, Dagnelie PC, Koster A, Schaper N, et al. The Maastricht Study: an extensive phenotyping study on determinants of type 2 diabetes, its complications and its comorbidities. Eur J Epidemiol. 2014;29(6):439-51.
4. Shiogai Y, Stefanovska A, McClintock PVE. Nonlinear dynamics of cardiovascular ageing. Physics Reports. 2010;488(2):51-110.
5. Zygmunt A, Stanczyk J. Methods of evaluation of autonomic nervous system function. Arch Med Sci. 2010;6(1):11-8.
Figures