1362
Locus Coeruleus derived norepinephrine alters intrinsic functional connectivity at the Default-Mode Network1Neurology, University of North Carolina at Chapel Hill, Chapel Hill, NC, United States, 2Radiology, University of North Carolina at Chapel Hill, Chapel Hill, NC, United States, 3Biomedical Imaging Center, University of North Carolina at Chapel Hill, Chapel Hill, NC, United States, 4Center for Animal MRI, University of North Carolina at Chapel Hill, Chapel Hill, NC, United States, 5Developmental Neurobiology, NIEHS/NIH, RDU, NC, United States, 6Developmental Neurobiology, NIH/NIEHS, RDU, NC, United States
Synopsis
Norepinephrine (NE) is suspected to rapidly modulate strength and structure of intrinsic functional connectivity (FC). We used chemogenetic fMRI to selectively isolate the role of NE Locus Coeruleus (LC) neurons, compared to NE A1/A2/A4 neurons, on FC modulation. Among 19 parcellated FC modules, NE-LC neurons significantly enhanced ReHo, ALFF and DC within the anterior Default-Mode, Motor and Somatosensory modules and enhanced FC strength within and between Default-Mode modules. Dynamic FC analysis found Default-Mode differences were attributed to two co-activation patterns (CAPs) associated with Default-Mode suppression that explains the ability of NE to focus wandering minds into sensory attention.
Pupose
Recent studies have shown that NE can dynamically shape FC topography by differentially modulating FC strength within and between anatomically connected brain networks1-4, but the origin of selected NE neuronal clusters with respect to their influence on brain networks remain unclear. Here we hypothesized that Default-Mode Network (DMN) is modulated by a specific population of NE neurons. To explore this, we used transgenic chemogenetic mouse models with fMRI to selectively isolate how distinct NE neurons alters FC. Our findings 1) highlighted the role of a specific population of NE neurons in the Locus Coeruleus (LC) in modulating global DMN, 2) identified their influences within DMN frontal module and across DMN frontal and association modules, and 3) revealed dynamic co-activation patterns (CAPs) that not only resembled results from FC modularity analysis, but also provides novel insights on specific enhancement and reduction of CAPs within DMN due to LC-induced NE release.Methods
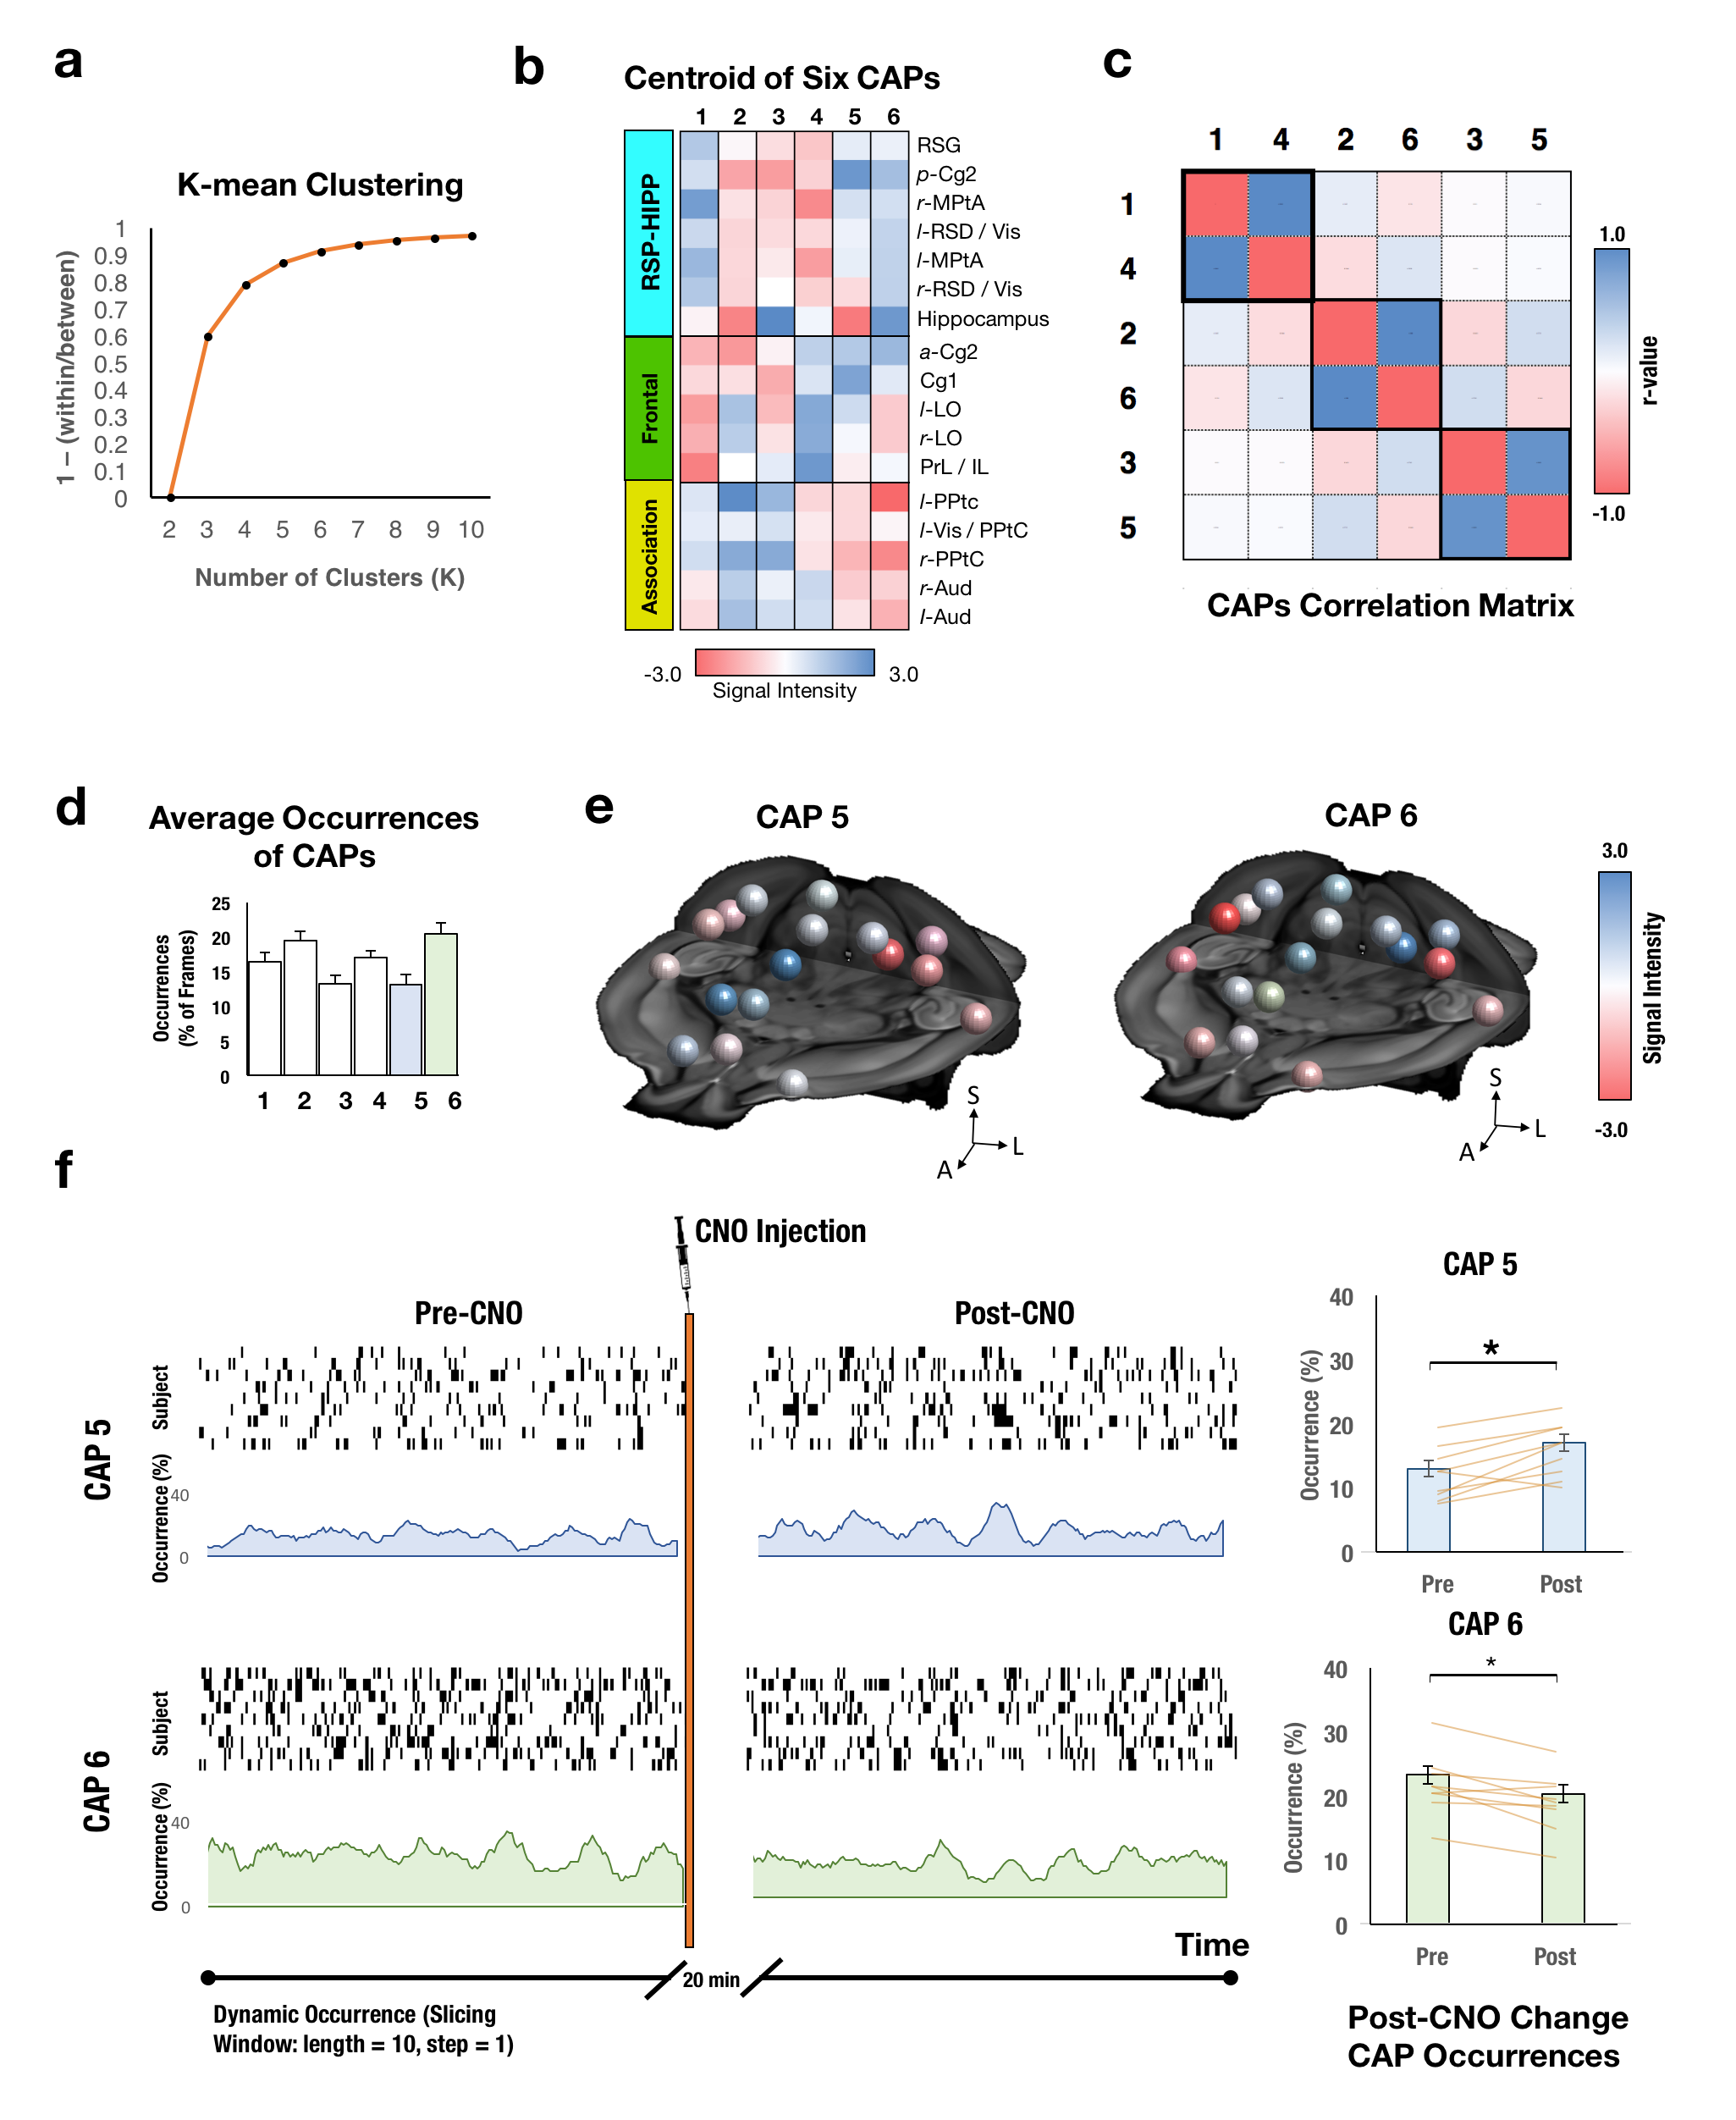
Utilizing two transgenic mouse lines that express hM3Dq-DREADD receptors among Dbh+ NE neurons that transiently expressed En1 or Hoxb1 during neurodevelopment to respectively isolate NE neuronal subpopulations in LC and A1/A2/A46-8. En1 lines project into neorcortical regions while Hoxb1 lines project primarily into the basal forebrain and hypothalamus (Fig. 1a-b). hM3Dq- littermate controls were used to remove CNO-related effects. CNO administration (1 mg/kg, i.p.) increases hM3Dq+ NE neuron firing in both lines7, 8. Static [18F]-FDG PET scans were collected in En1 (n=5), Hoxb1 (n=5) and littermate control mice (n=5) following both saline and CNO administration and analyzed using PMOD. CBV-fMRI studies were performed using a bolus CION contrast in 0.75-1% isoflurane anesthetized En1 (n=9), Hoxb1 (n=8) and control mice (n=12). fMRI were continuously acquired for 40 min with CNO being administered 10 min after scan onset using a single shot GE-EPI sequences (TR/TE = 3000/7.9 ms, matrix = 64x64, FOV = 1.92 cm2, slices = 26 and thickness = 0.3 mm) on a Bruker 9.4T scanner using a 72 mm quad-transmission volume coil and quad-receiver mouse brain coil. The brain was decomposed in 100 functional components using pre-CNO data across all groups with group-level ICA (FSL MELODIC). ICA spatial maps were back-reconstructed for each subject to estimate subject-specific temporal components and associated spatial maps by dual-regression (DR)9 and a t-test was performed to generate group component maps. Functional modules were parcellated using Louvain community detection algorithm. ALFF and ReHo were performed using AFNI. DMN subnetworks were analyzed using graph theory-based modularity analysis12. Timecourses were extracted from first stage of DR in each of the 17 preselected nodes to compute Pearson correlation, Fisher z-transformation between node pairs to form a correlation matrix. To discard weaker connections while keeping no isolated nodes in the DMN, the threshold of z-value = 0.28 was set in the mean rsFC matrix across all mice. Within- and between-module connectivity was defined as the average of FC across ROI pairs within or between the identified DMN subnetworks. The participant coefficient (PC) and within-module degree (WD) were estimated to identify hubs and connectors in DMN13. We conducted the network based-statistics (NBS) to investigate the significant connection changes within the identified frontal module and between the frontal module and association module. In brief, for each comparison, a primary component-forming threshold (two sample t-test of p<0.05, uncorrected) was applied to form a set of suprathreshold edges and all the remaining connected subnetworks in the matrix was then evaluated under the null hypothesis of random group membership (1000 permutations). Subnetworks that were significant at a corrected level of p< 0.05 were reported. To further identify the DMN dynamic metabolism change across time, we conducted the K-mean clustering with correlation-based distance in the raw CBV signal. The occurrence of each state in Pre-CNO and Post-CNO was estimated. A false discovery rate (FDR) corrected p<0.05 was considered significant.Results and Discussion
Twenty functional modules were parcellated across all subjects for subsequent ROI-analysis (Fig. 2b). In Default-Mode module ROI, NE released by LC neurons significantly reduced CBV (Fig. 2c), reduced brain glucose metabolism (Fig. 2d), enhanced ReHo (Fig. 2e) and enhanced ALFF (Fig. 2f), whereas NE from A1/A2/A4 neurons produced distinct modulation patterns. Using group-level ICA (gICA), three DMN modules (i.e. Anterior, RSC-HIPP, and Association) were identified in modularity analysis (Fig.3a&b) as previous reported10, 11. PC and WD indicates the intermodule and intramodule connectivity in DMN (Fig.3c&d). The significant higher FC is found in En1 compared to Hoxb1 and Control groups within frontal module (F(2,27) = 5.2, pcorrected<0.05) and between frontal and association modules (F(2,27) = 6.0, pcorrected<0.05) (Fig.3e), and the NBS analysis further indicates the significant connections (Fig.3f). Next, by using the K-mean clustering, six states were identified in En1 group (Fig. 4a-d). Among the six states, state 5 and 6 shows significant occurrence changes (pcorrected<0.05) before and after CNO injection (Fig.4e&f). These findings are the first to isolate the functional role of NE from LC neurons on DMN FC. This study provides novel insights on the influence of LC NE on DMN submodules and identified the specific enhancement and reduction of CAPs within DMN.Acknowledgements
Drs. Yu-Wei Chen and Patricia Jensen at NIEHS/NIH developed the transgenic mouse line used in this study. This work was graciously supported by NINDS R01 NS091236, NIMH R01 MH111429, R41 MH113252, R21 MH106939, NIAAA U01 AA020023, R01 AA025582, American Heart Association 15SDG23260025.References
[1] J Neurosci. 2016 Jul 27;36(30):7865-76.
[2] Cereb Cortex. 2017 Oct 1;27(10):4691-4700.
[3] Netw Neurosci. 2018 Sep 1;2(3):381-396.
[4] J Neurosci. 2018 Aug 22;38(34):7476-7491.
[6] Cell Rep. 2016 Jun 14;15(11):2563-73.
[7] Mol Psychiatry. 2019 May;24(5):710-725.
[8] Brain Res. 2016 Jun 15;1641(Pt B):234-44.
[9] Neuroimage. 2010 Feb 1;49(3):2163-77
[10] Proc Natl Acad Sci U S A. 2014 Dec 30;111(52):18745-50.
[11] Proc Natl Acad Sci U S A. 2016 Aug 2;113(31):E4541-7
[12] Neuroimage. 2010 Sep;52(3):1059-69.
[13] Nature. 2005 Feb 24;433(7028):895-900.
Figures
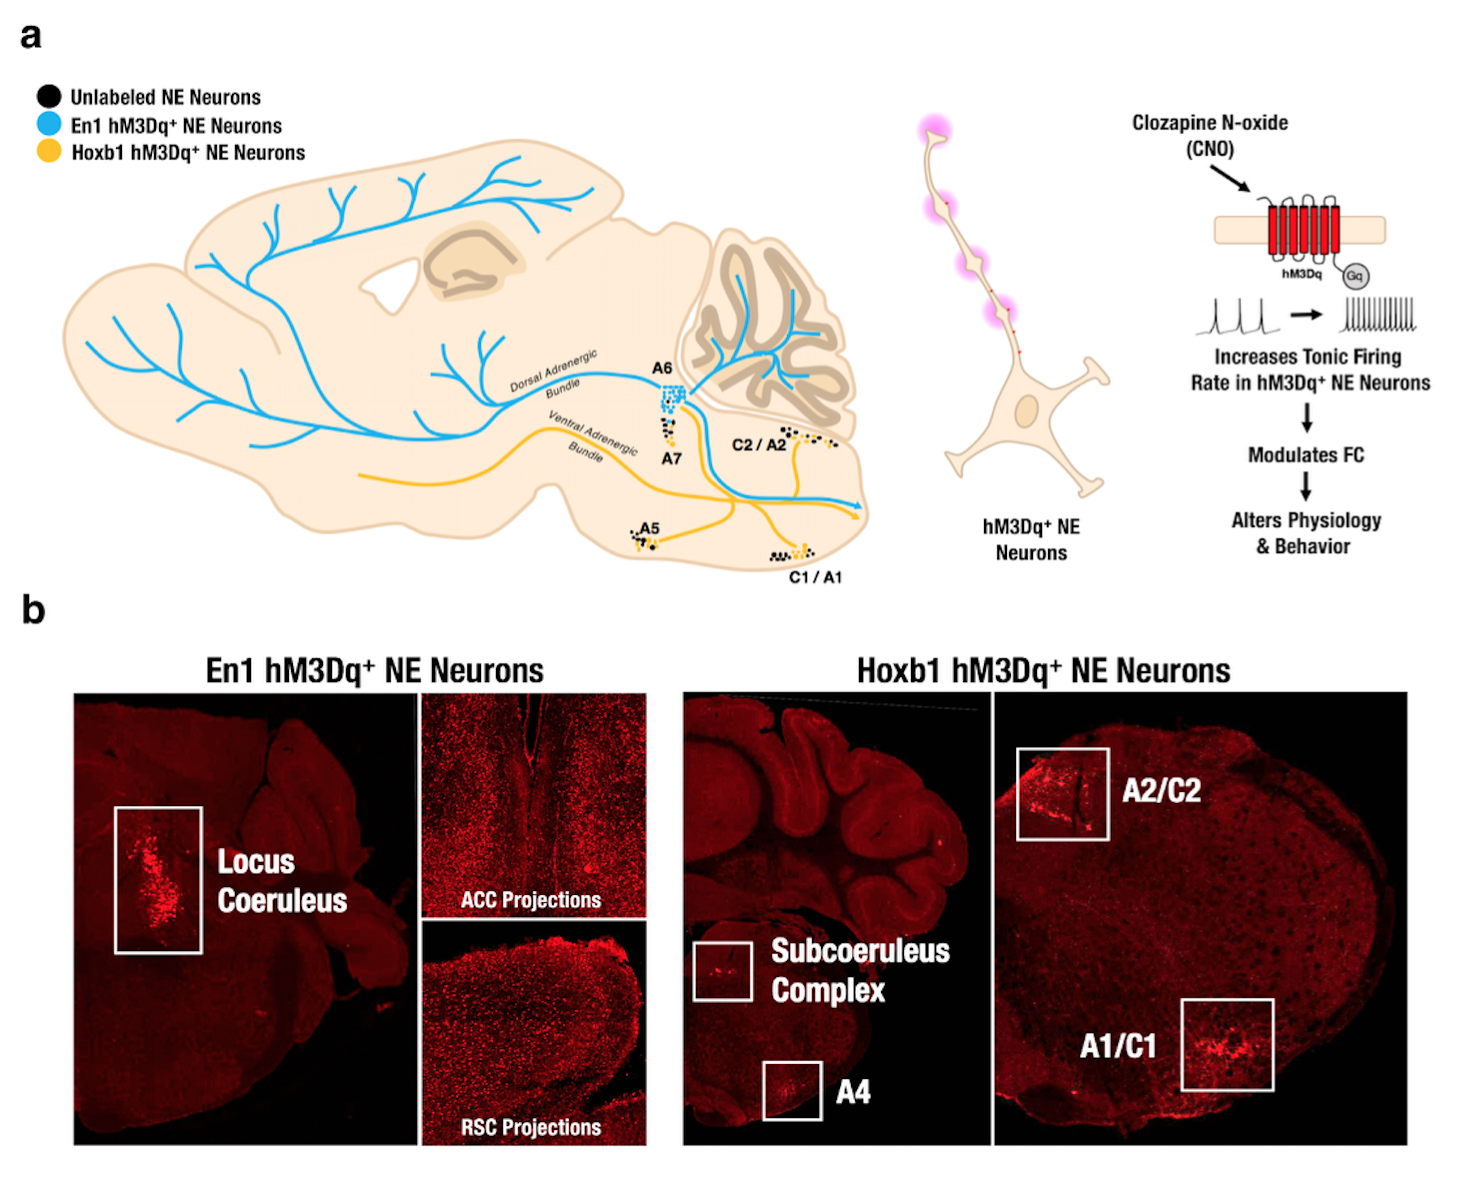
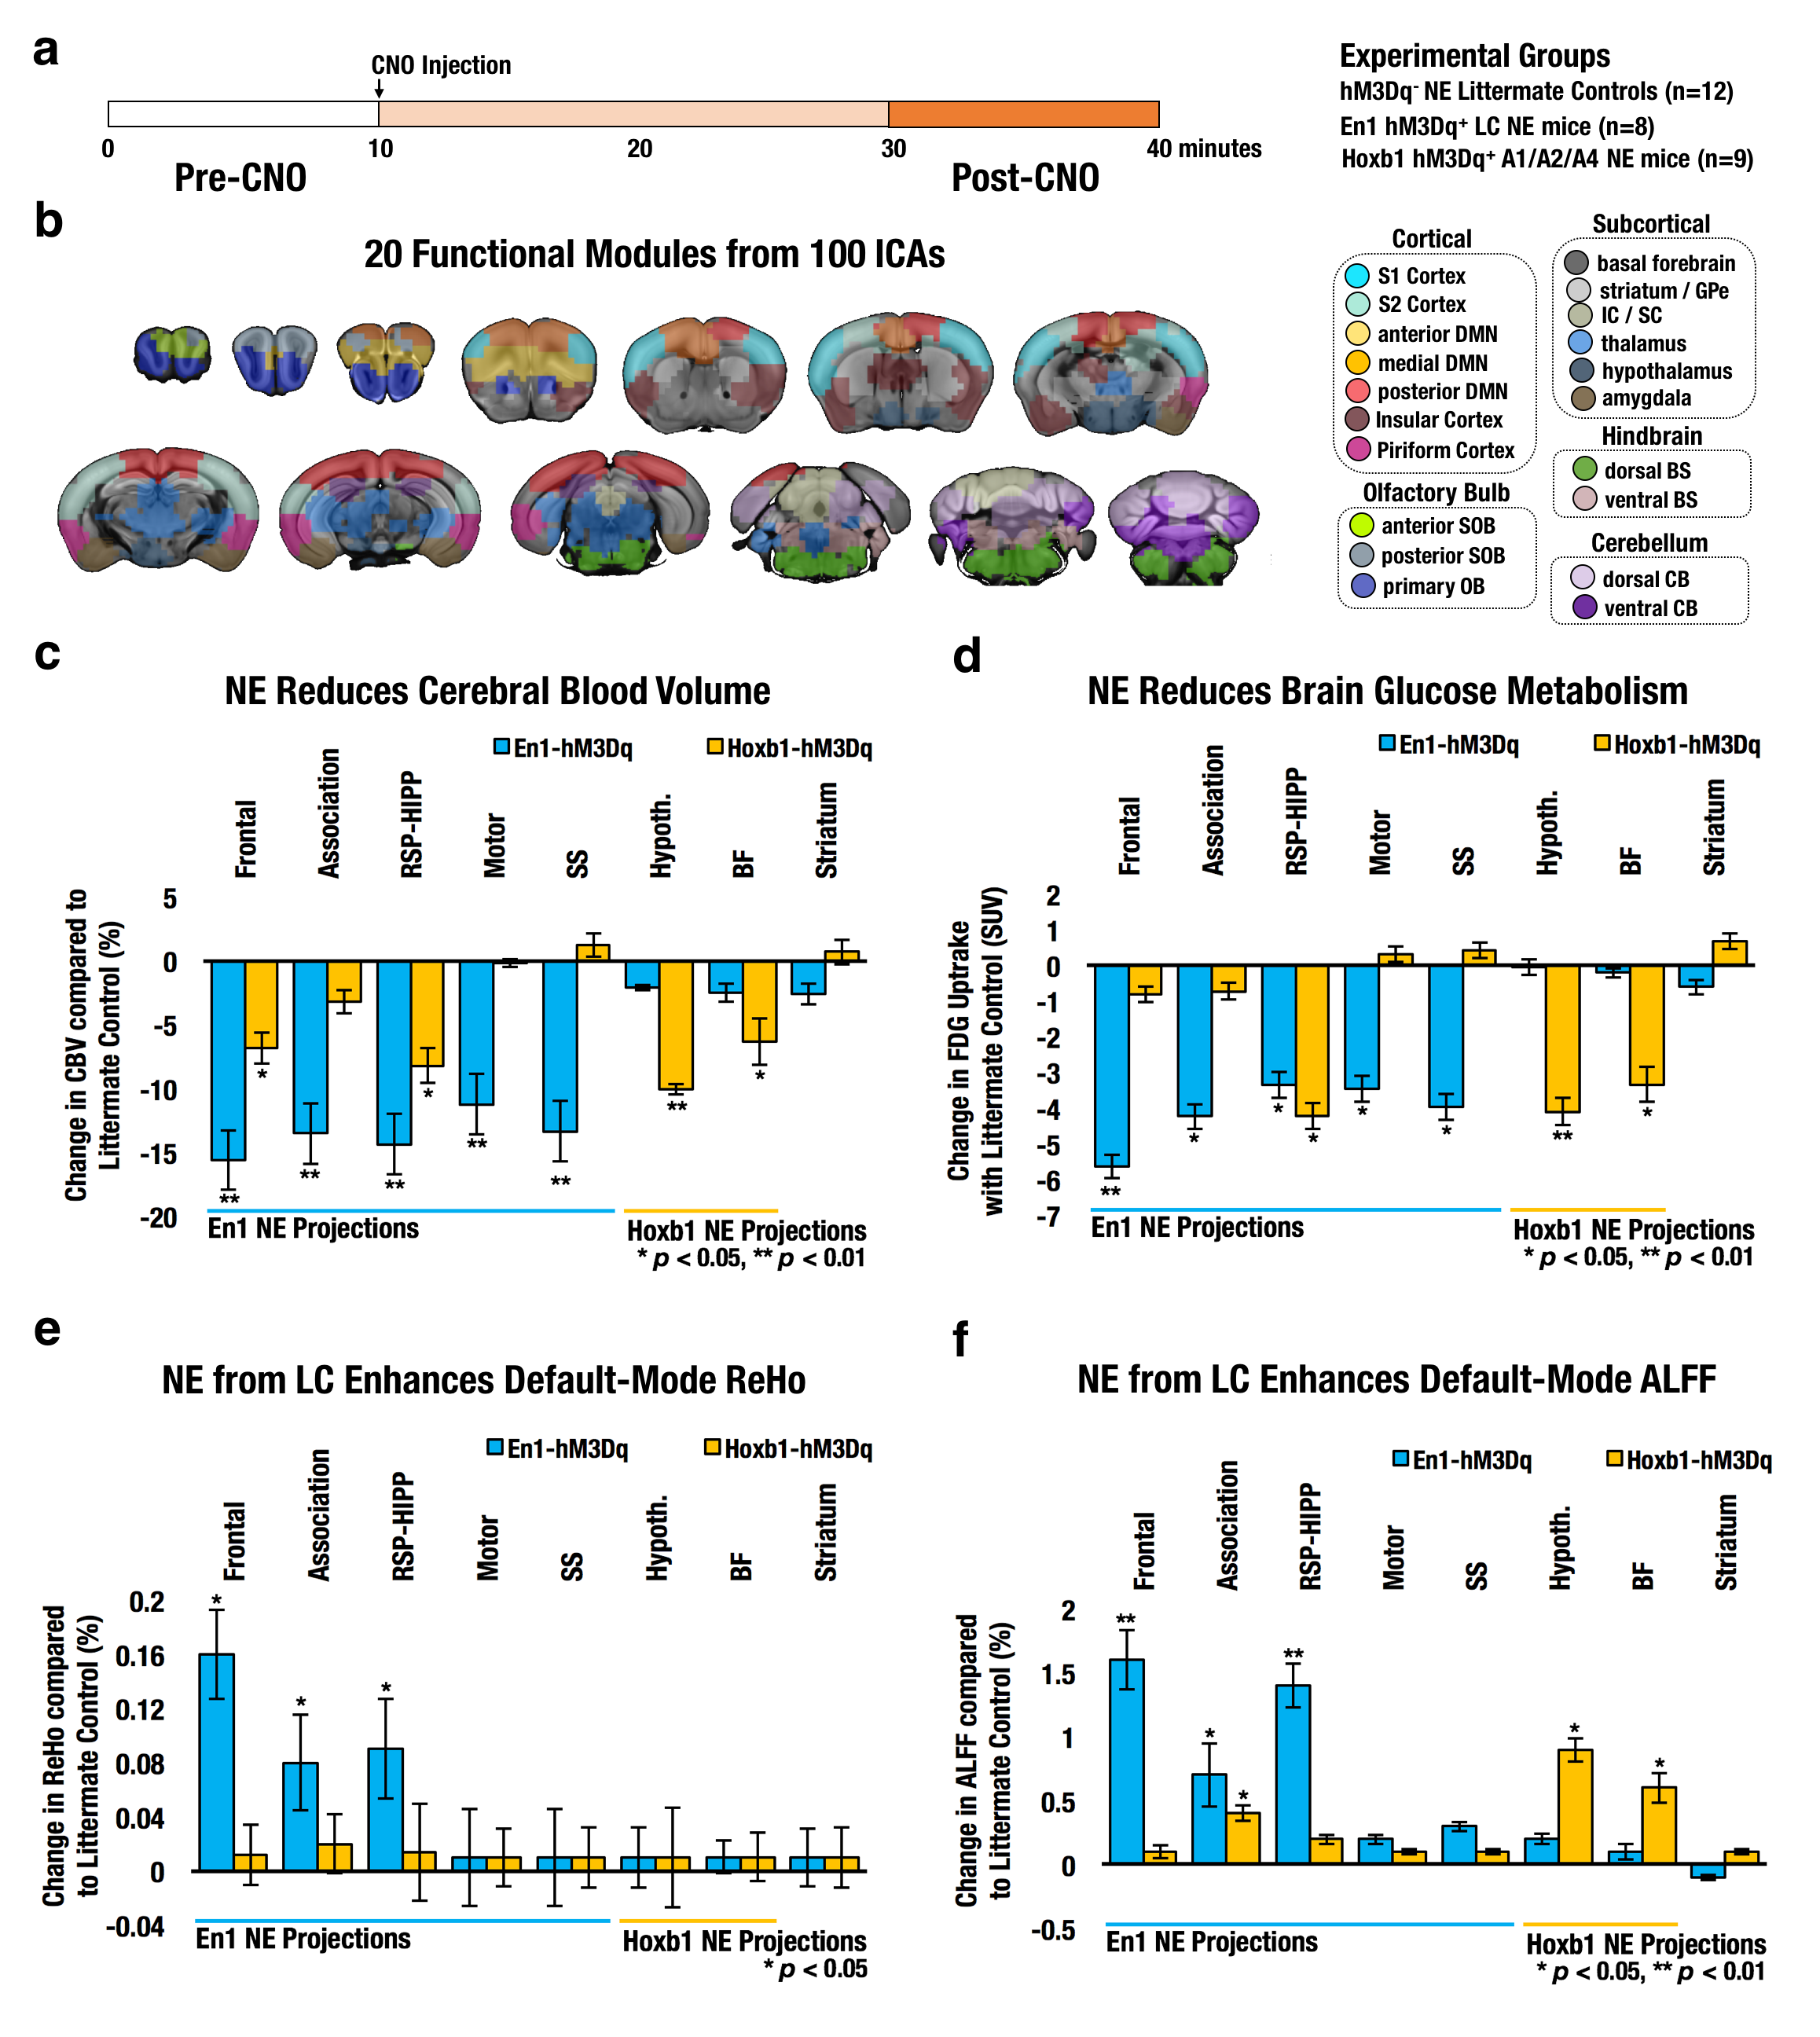
Fig. 2 (a) Schematic of fMRI study design. (b) Brain fMRI scans were parcellated into 20 functional modules from 100 finer functional ICAs. Functional module ROIs for DMN, motor, somatosensory (En1 projections sites) and thalamus, basal forebrain (Hoxb1 projection sites) were used to extracted changes in CBV (c), FDG PET metabolism (d), Regional Homogeneity (e) and Amplitude of Low-Frequency Fluctuations (f).