1361
The Stomach and the Brain are Synchronized Intrinsically in Rats
Jiayue Cao1, Xiaokai Wang1, Kun-Han Lu2, Zhenjun Tan3, Robert Phillips3, Deborah Jaffey3, Terry Powley3, and Zhongming Liu1,2
1Biomedical Engineering, Purdue University, West Lafayette, IN, United States, 2Electrical and Computer Engineering, Purdue University, West Lafayette, IN, United States, 3Psychological Science, Purdue University, West Lafayette, IN, United States
1Biomedical Engineering, Purdue University, West Lafayette, IN, United States, 2Electrical and Computer Engineering, Purdue University, West Lafayette, IN, United States, 3Psychological Science, Purdue University, West Lafayette, IN, United States
Synopsis
The origins of fMRI in the resting state has been widely explored but yielded incomplete knowledge. Here, we hypothesize that gastric activity contributes to intrinsic brain activity observed with fMRI.We explored the gut-brain synchrony in rats by recording the electrogastrogram together with fMRI. We found that brainactivity is intrinsically synchronized with gastric activity at a specific resting state network in which the BOLD activity is time-locked to gastric activity with varying time delays.
Purpose
Although functional magnetic resonance imaging (fMRI) in the resting state has been widely used, its origins remain incompletely understood. We hypothesize that electrical activity of the stomach contributes to brain activity which can be observed with resting-state fMRI. The gut communicates with the brain, allowing the gastrointestinal state to influence cognition and emotion and vice versa. In the resting state,gastric electrical activity has been shown to be synchronized with the blood-oxygen-level-dependent (BOLD) fMRI signal in the so-called gastric network in humans [1]. However, the finding has been rarely replicated in either humans or animal models. Here, we explored the gut-brain synchrony in anesthetized rats following meal consumption. Whole-brain fMRI was acquired simultaneously with electrogastrogram (EGG) recording. Cross-correlation between EGG and BOLD signals was used to map resting state networks influenced by gastric activity.Method
MRI was performed on threeSprague Dawley rats together with the EGG recording. Each rat was trained to consume diet gel enriched with Gadolinium contrast media. Before the experiment, the rat was fed with 5g Gadolinium enriched gel. After the feeding, the animal was anesthetized with continuous dexmedetomidine (SC-infusion, 0.015 mg/Kg/h) and isoflurane (0.1-0.5% mixed in O2). The rat was shaved and attached with a multi-channel electrode array (Fig. 1A). The multi-channel EGG signal was recorded using an electrophysiological recording system (Tucker Davis Technologies Inc.). During EGG recording, the rat’s brain was scanned with 2-D single-shot gradient-echo echo-planar imaging (EPI, TR=1s, TE=16.5ms, FA=60°, in-plane resolution=0.5×0.5×1 mm3) in a 7-tesla small-animal MRI system (BioSpec 70/30, Bruker). The abdominal region was scanned with a Fast Low Angle Shot gradient echo (FLASH) sequence (TR/TE = 11.78/1.09ms, FA = 25°, 4 oblique slices, slice thickness = 1.5mm, FOV = 60 × 60 m2, in-plane resolution = 0.4688 × 0.4688 mm2). The acquisition was gated by the animal’s respiration such that minimal motion artifacts could be observed.In the off-line analysis, the EGG signal was detrended and filtered (1Hz low-pass filter) in the individual channel. Then, the principal component analysis (PCA) was applied to the multi-channel EGG signals. The time series of principal components were then downsampled to match the sampling rate of brain fMRI or abdominal MRI. FMRI were preprocessed with a standard routine. The correlation between the voxel-wise fMRI signal and the component-wise EGG signal was calculated, yielding multiple gut-associated brain networks. In addition, the voxel-wise fMRI signal was also modeled as a linear combination of EGG component time series with varying time shifts. Abdominal MRI were analyzed to report stomach contraction. The frequency of stomach contraction was compared with that of EGG to verify the gastric origin of EGG.
Results
FMRI was scanned simultaneously with the EGG recording (Fig.1A). EGG was denoised and cross-correlated with the BOLD activity in every voxel to map an EGG-correlated network (or the gastric network) (Fig. 1C). The BOLD signal was averaged across voxels in the gastric network. The resulting network-wide signal was found to be phase-locked to EGG with a time delay (Fig.1B). Accounting for the delay variable across voxels, we mapped an even broader network phase-locked with EGG (Fig. 2A). Different EGG-coupled regions were found to lag behind EGG by different times, ranging from 4 to 12 seconds (Fig. 2B & C). From the EGG-coupled BOLD response, the visual and auditory cortex had a relatively longer delay, whereas the somatosensory and anterior cingulate cortex had a shorter delay. The cingulate cortex showed a complex response pattern, likely implying multiple functional roles with respect to the gut. To further confirm that the recorded EGG indeed reflected the activity of the stomach, we acquired abdominal MRI simultaneously with EGG (Fig.3A). The antrum of the stomach was found to contract periodically (Fig.3C) with the same characteristic frequency as that of EGG (Fig.3B & D).Conclusion
In rats, brainactivity is intrinsically synchronized with gastric activity at a specific resting state network. In this network, different brain regions are time-locked to gastric activity with varying time delays. Speculatively, the pattern of time delay may reflect how gastric information propagates through a cascade of brain regions for sequential processing.Acknowledgements
This study was funded by National Institutes of Health’s SPARC - Stimulating Peripheral Activity to Relieve Conditions - program (OT2OD023847).References
[1] Rebollo, I., Devauchelle, A. D., Béranger, B., & Tallon-Baudry, C. (2018). Stomach-brain synchrony reveals a novel, delayed-connectivity resting-state network in humans. Elife, 7, e33321.Figures
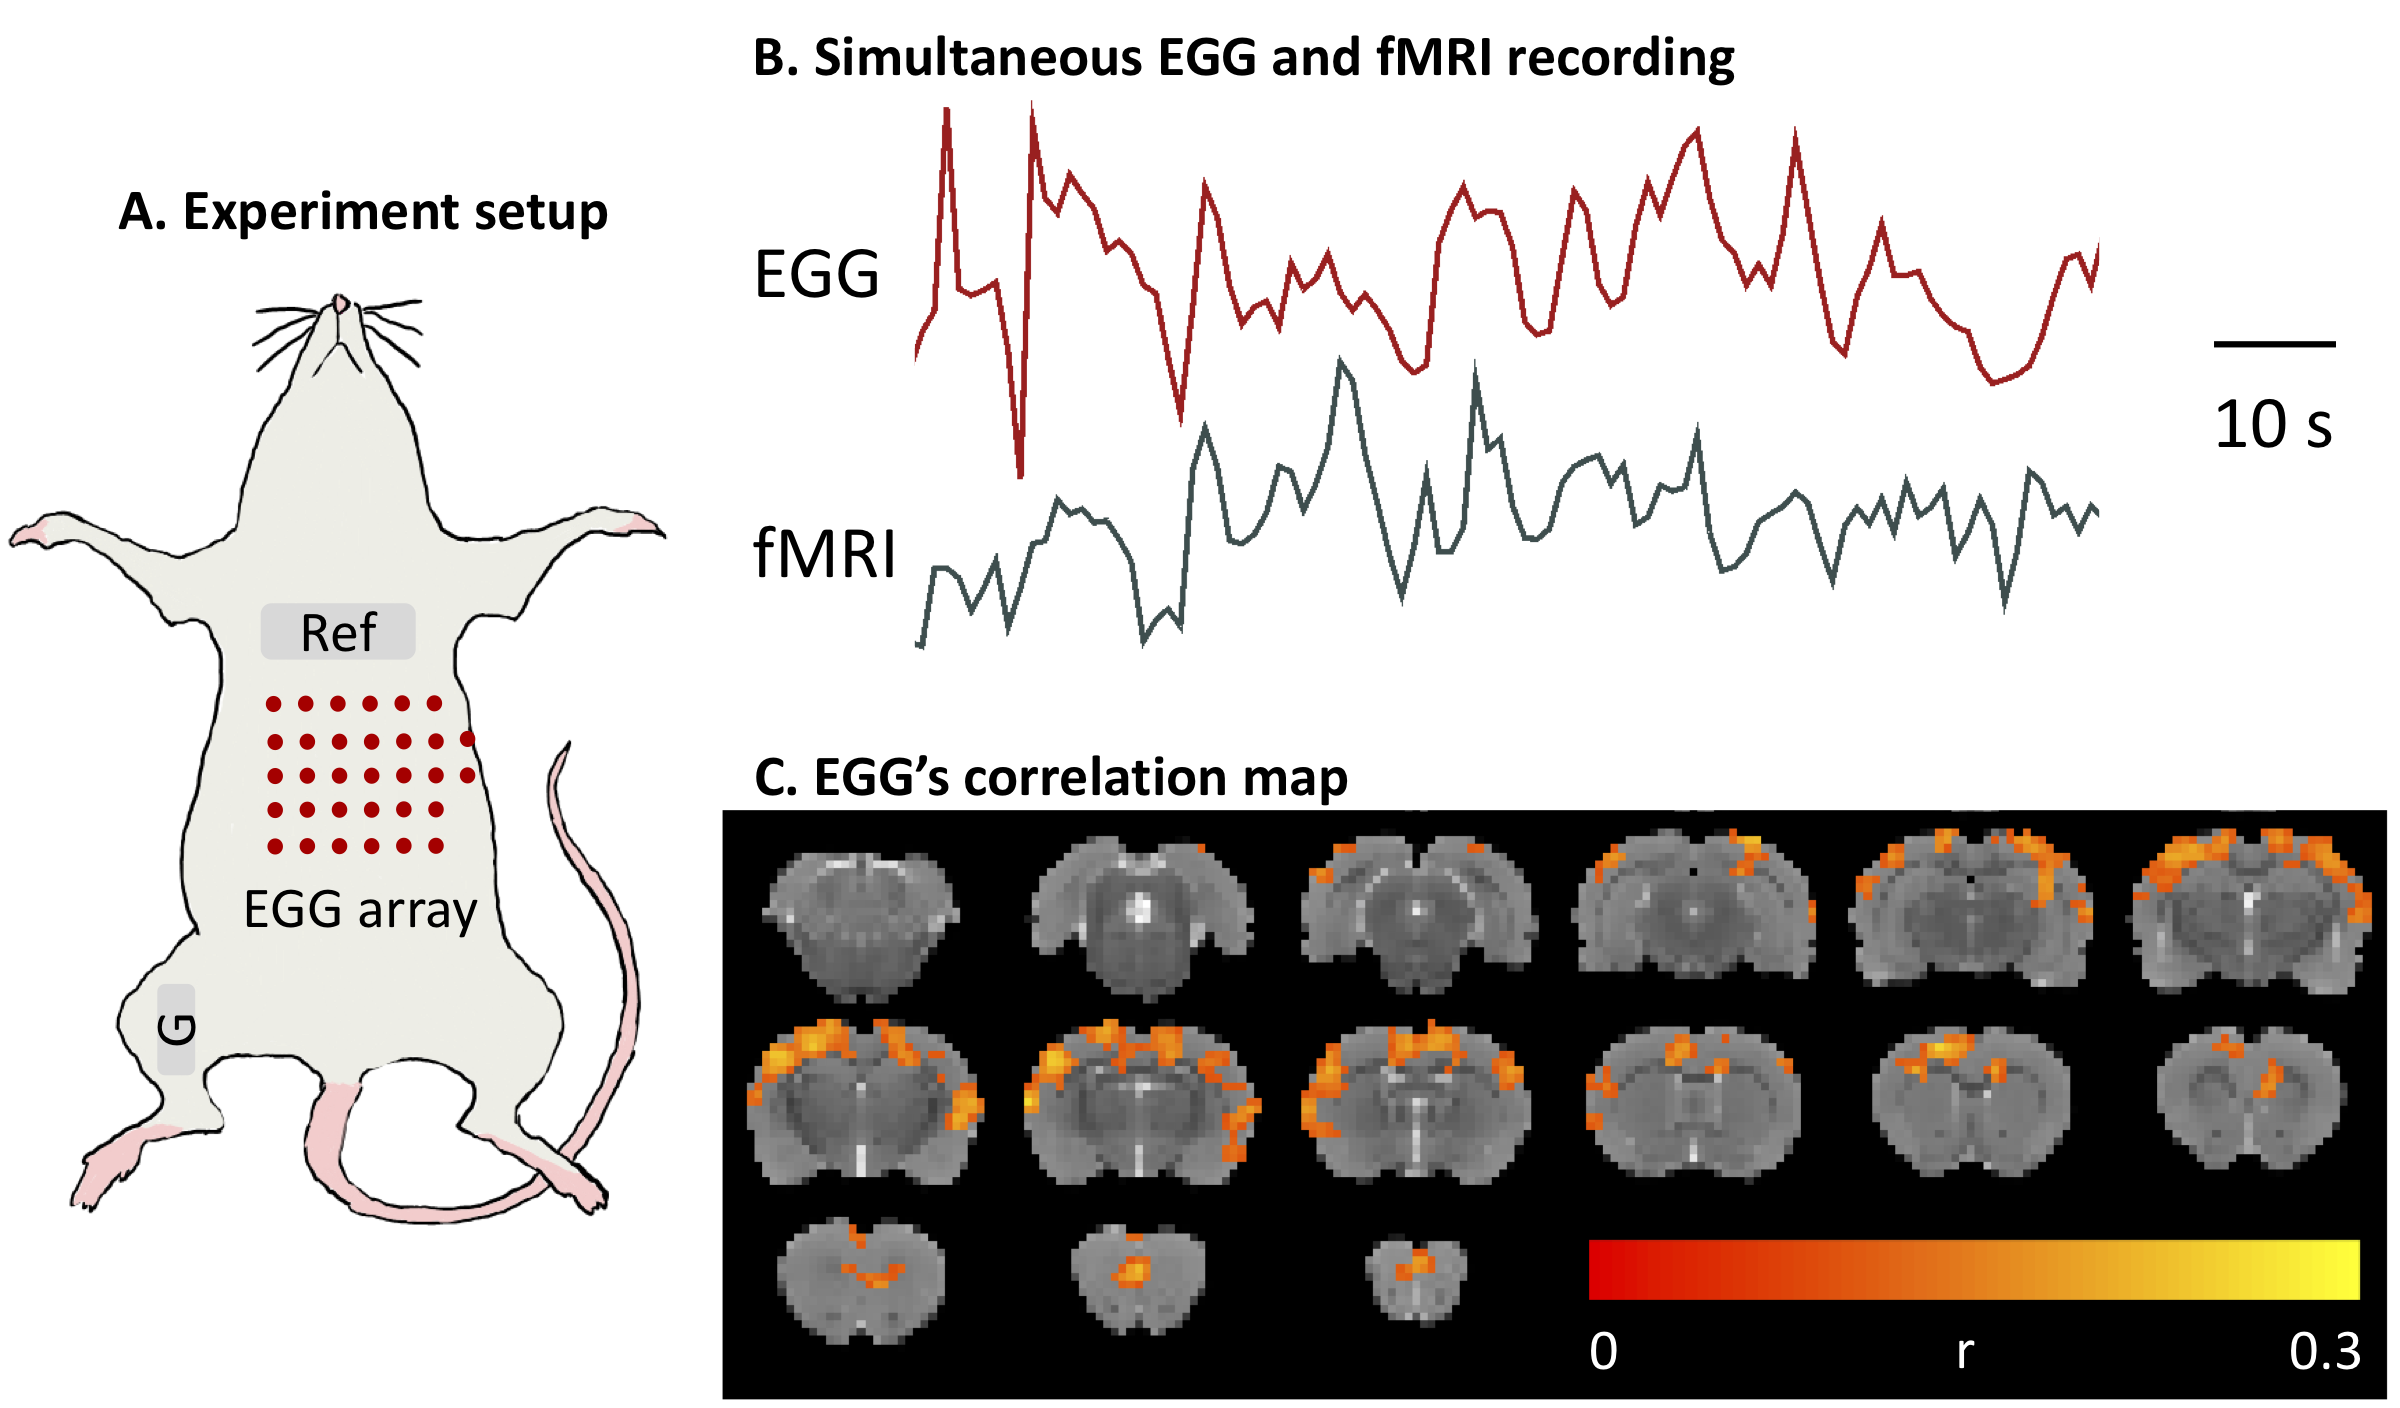
Figure 1. Simultaneous EGG and brain fMRI recording. (A) shows the layout of the 32-channel electrode array for EGG recording. (B) are the examples of EGG and fMRI time series. (C) shows an example of the EGG correlation map. The correlation between EGG and fMRI time series is color-coded.
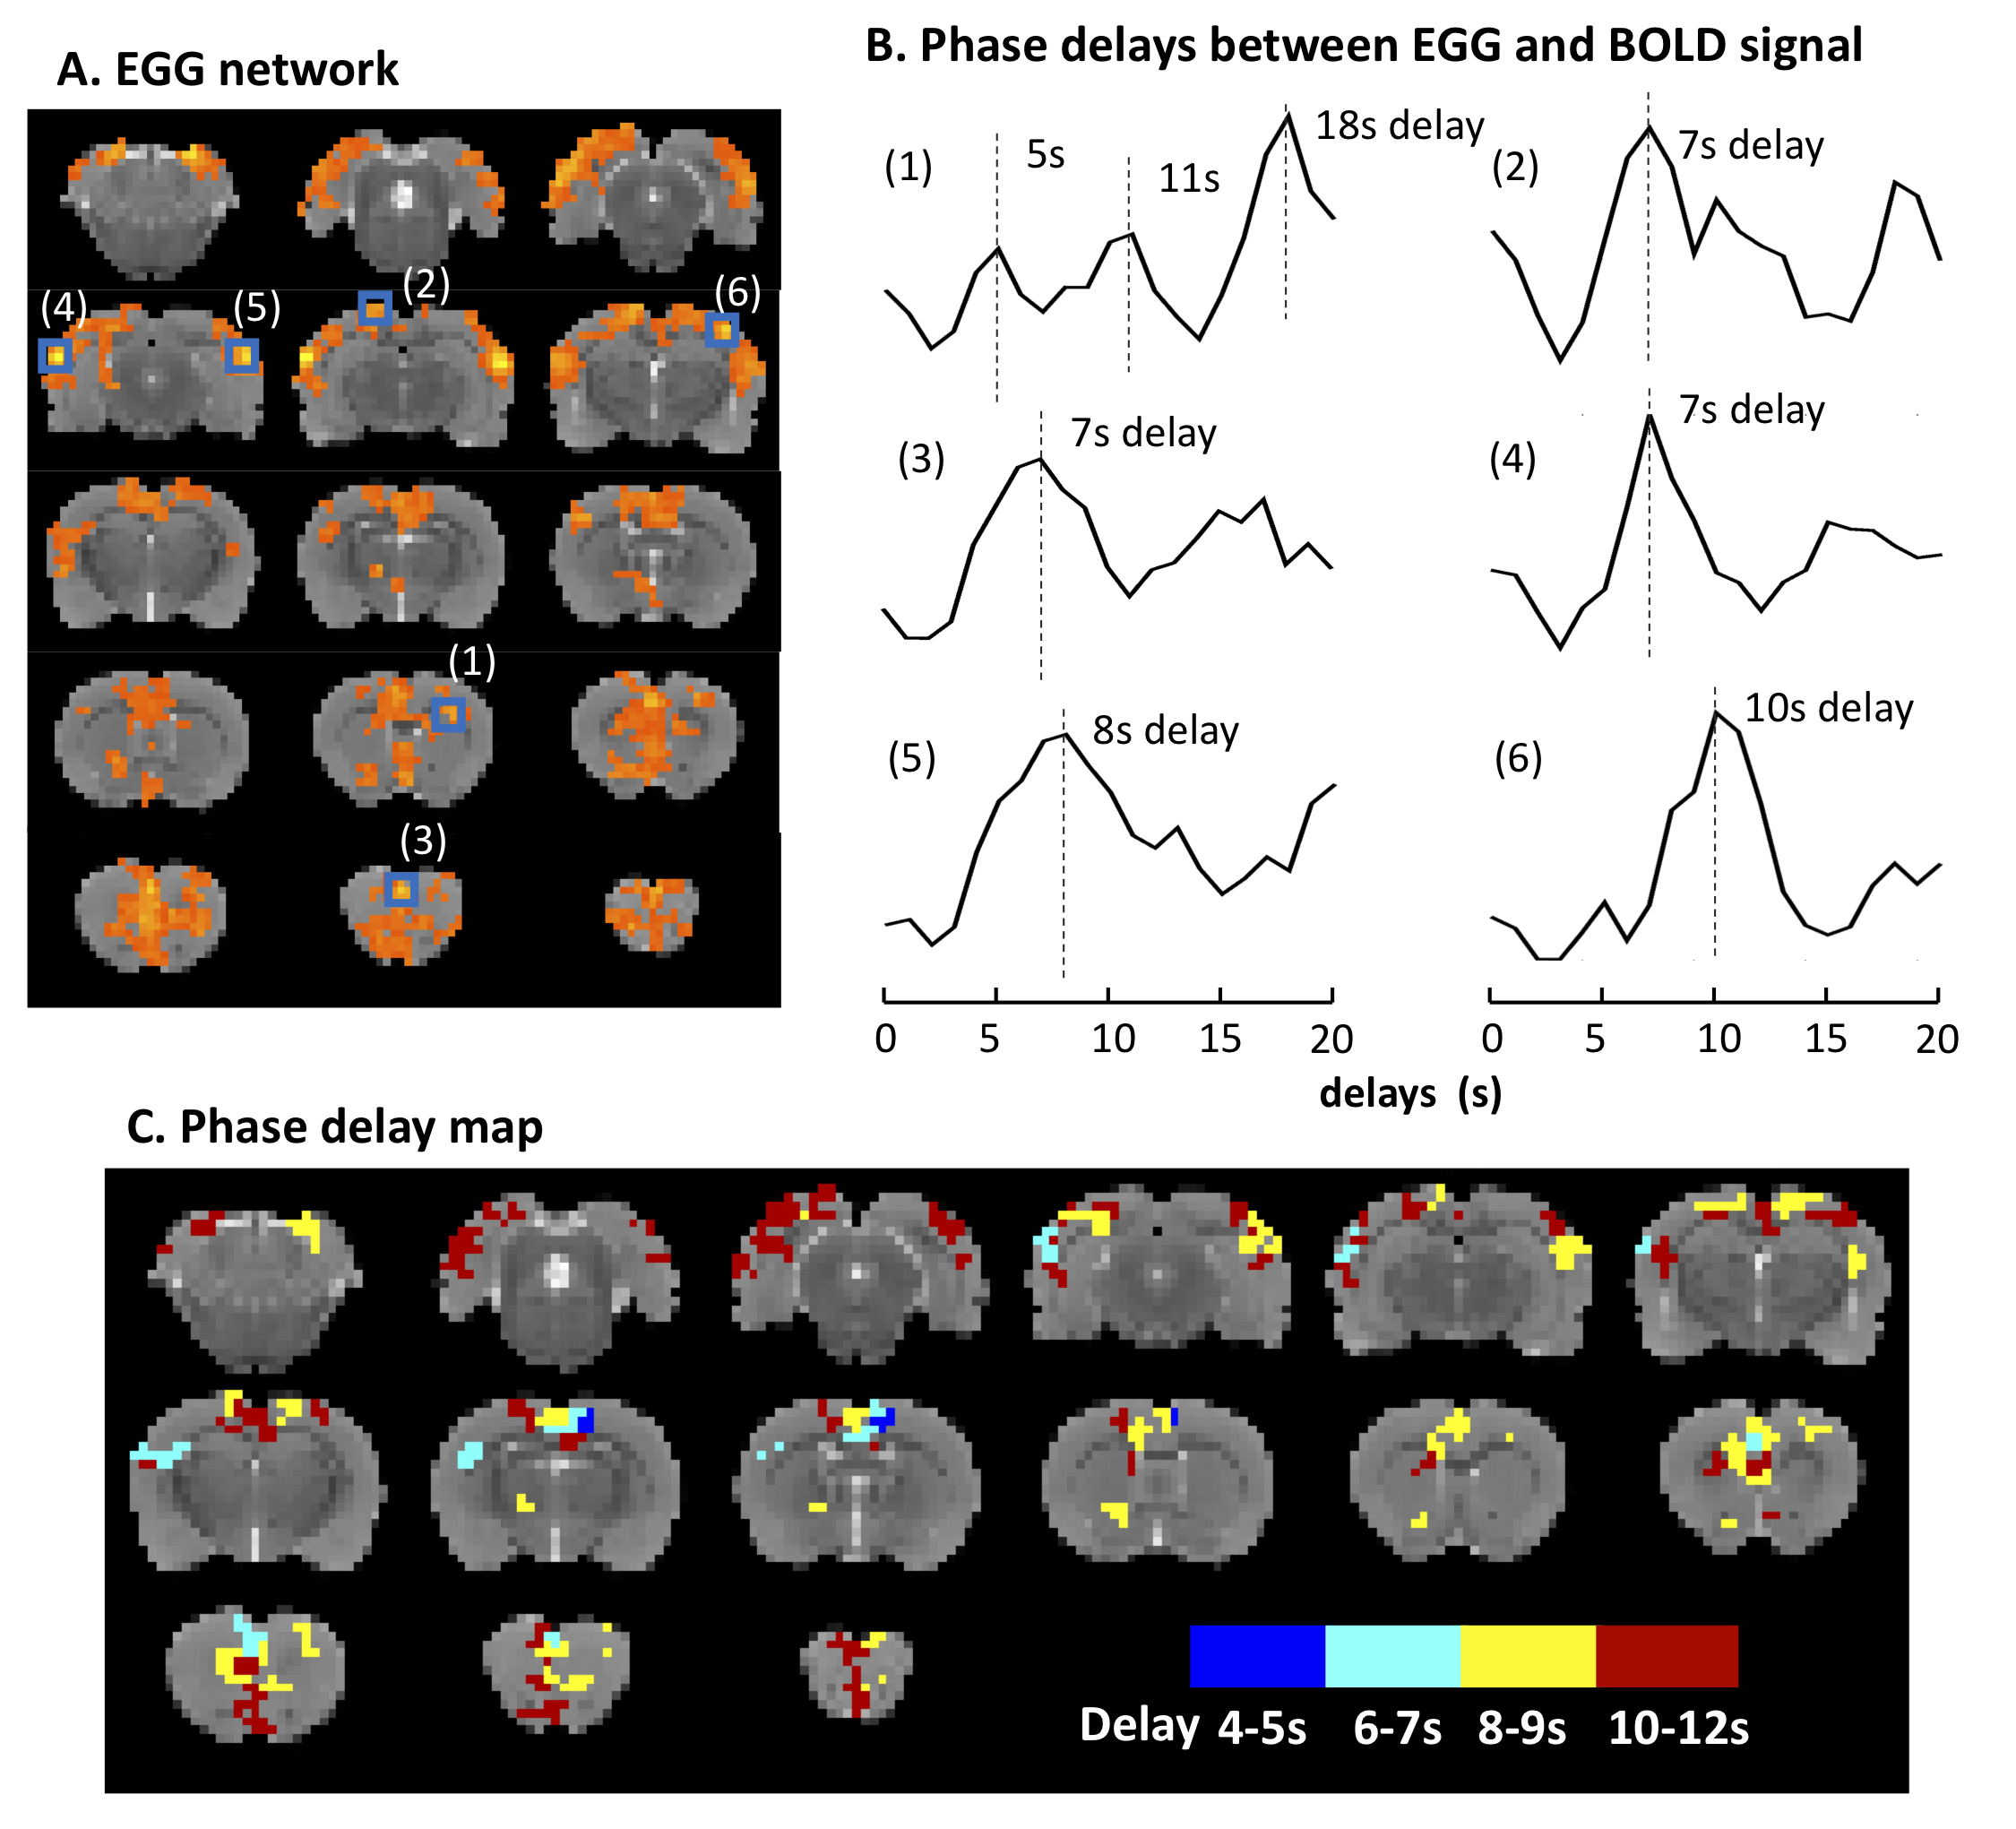
Figure 2. The EGG network considering the phase delays between EGG and fMRI signal. (A) is a summary of the EGG network. The color represents the F statistic of the multiple linear regression. (B) selects six voxels in the EGG network. The curve shows the relation between the F statistic and EGG-fMRI delays for the selected voxels, which are marked with blue box in (A). (C) is the phase delay map that delineate the phase differences between EGG and fMRI time series. The color represents the phase delays.

Figure 3. Simultaneous EGG recording and gastric MRI acquisition. (A) Gastric MR images are acquired and at the same time cutaneous EGG is recorded. (C) The cross-section area changes in the antrum reveals the frequency of stomach contractions. (B) and (D) are the power spectrum density (PSD) for EGG and stomach contractions.