1360
Variations in the sympathetic tone and fMRI signal during alert conditions1NINDS, NIH, Bethesda, MD, United States, 2Vanderbilt University, Nashville, TN, United States
Synopsis
During light-sleep, strong correlations were observed between fMRI and peripheral signals. This can be inferred from the fingertip pulse-oximeter signal as a proxy for sympathetic activity. Sympathetic activity may also affect fMRI during wake. In this work, we analyzed data collected during cognitive tasks and deep breathing, showed strong spatio-temporal relations between pupil behavior, skin vascular tone, and fMRI signal. We demonstrate that sympathetic activity can be elicited by a variety of stimuli, that those additional measures might be useful for physiological regression and to better distinguish neuronal and autonomic contributions, which are mostly observed as anti-correlation patterns in fMRI.
Introduction
Finger skin vascular tone has been shown to covary with the fMRI signal1-3, suggesting a contribution from sympathetic vasoconstriction to cerebral blood flow regulation by the sympathetic nervous system rather than, or in addition to, a local CO2-dependent mechanism. Particularly strong effects have been observed during light sleep, a condition characterized by strong variations in sympathetic activity and autonomic physiology1,4,5. Here we studied the role of sympathetic vasoconstriction during wakefulness, using cognitive stress and respiratory challenges, both previously associated with sympathetic activation. As a measure of sympathetic activity, we recorded skin vascular tone from the fingertip with a photoplethysmography (PPG)1 and monitored pupil dilation6.Methods
Cognitive stress was induced by a task requiring numerical summation (Cog, Fig.1). Our respiratory challenge consisted of periodic deep inhalations, accompanied by a visual task to maintain the subjects’ attention (VisDB, Fig.1). For VisDB, subjects viewed a flickering checkerboard, were instructed to focus on the central dot, and take (cued) deep breaths (DBs). The stimulus consisted of patterns displayed diagonally in two opposing quadrants, presented in alternating pairs in 40 sec blocks. The center dot changed color intermittently to cue taking a single DB, 10 seconds into a 40 sec block. In every third block the cue was not presented, to allow separation of task and DB effects. For Cog, numerical summation problems were periodically displayed against a grey background with fixation dot. Summation and DB instructions were presented with similar timing (Fig.1).FMRI acquisition: FMRI data were obtained from n=12 healthy subjects at 7T with gradient-echo-EPI (flip angle=70°, repetition time (TR)=2s, echo time=30ms, isotropic resolution=2mm, repetitions=375). Preprocessing of fMRI data included motion coregistration and regression, polynomial regression of low-frequency signal drifts, and slice-timing correction.
Physiological data: Physiological signals were collected with respiratory bellows and PPG attached to fingertip, and aligned with the fMRI data. PPG amplitudes (PPG-AMP), reflecting the signal envelope, were extracted1. Zero-mean heart rate (HR) time-series and respiratory volumes (RV) were calculated7.
Eye-camera: An MRI-compatible camera was used to monitor subject’s eye during experiments. The camera was fastened to the head coil with a custom mount, and was aimed at the subject’s left eye. Pupil diameter was recorded automatically as a measure of pupil behavior, and aligned with MRI triggers.
Analyses: To facilitate region-of-interest (ROI) based analysis, we subjected each preprocessed fMRI dataset to Independent Component Analysis (ICA) with 20 components (data smoothed with a Gaussian kernel of 3mm full-width at half-maximum, MELODIC (FSL)12). ROIs were created from thresholded visual (for VisDB and Cog) and cognitive (for Cog) components, as identified from the structural patterns8,9 and supported by their temporal relation with the task design (Fig.2). Event-locked analysis: Normalized PPG-AMP, HR, RV, pupil size variations and ROI-based %fMRI signal changes were calculated by averaging over multiple blocks during tasks. Lagged cross-correlations: Voxel-wise correlations of PPG-AMP, and pupil size with fMRI were performed at several time shifts (lags).
Results
Voxel wise correlations of fMRI with pupil size showed co-varying signal changes in task related regions which have opposing wide-spread grey matter correlations (Fig.3). The patterns also showed (non-task related) anticorrelations between grey and white matter, which were similar to the PPG-AMP and fMRI correlations pointing to a common sympathetic origin, as previously observed during light sleep1.During VisDB, an RV increase was followed by a large PPG-AMP drop (Fig.4A). Pupil size was consistently enlarged immediately following DBs (Fig.4A,B). In visual areas, an initial task related %fMRI signal increase was followed by a large decrease during DBs. Events without DBs showed no large variations in physiological signals, and %fMRI signal change stabilized at around 10 sec post stimulus onset (Fig.4A). An earlier fMRI signal drop was observed across whole brain (non-task related) grey matter, which occurred later in the visual task related region (Fig.4A, left column & Fig.4C). The latter was presumably the result of the combination of positive and negative signal excursions.
During Cog, subjects consistently showed PPG-AMP drops and pupil dilations, and sometimes large respiratory changes (Fig.5A,B). As with VisDB, decrease in fMRI signal occurred earlier in regions of grey matter not heavily influenced by the task. Voxel wise correlations of fMRI with pupil size showed strong initial positive correlations in task-related regions, and negative correlations (increased pupil size, decreased %fMRI signal) at later lags (Fig.5C).
Discussion
The negative fMRI signal changes observed here under wakefulness conditions and their correlation with finger skin vascular tone and pupil diameter are interpreted as sympathetic vasoconstriction in the central nervous system. The data presented here illustrate an experiment where involuntary stress induced by a cognitive task indirectly affects fMRI signal through a sympathetic mechanism. The delayed negative signal change in cortex is similar to previous observations with deep breathing10,11. This suggests that, in addition to the vasodilatory effects of CO2 (and vasoconstrictive effects of CO2 reduction), the effect of deep inspiration on fMRI has a sympathetic contribution, possibly mediated by O2 and CO2 chemo-sensing input to the brainstem. Because of this, physiological signal regression may benefit from using PPG-AMP and pupil-size as additional regressors. For example, this may help distinguish between neuronal and autonomic contributions to the often observed anti-correlation patterns in fMRI12.Acknowledgements
This work was funded by the intramural program of the National Institute of Neurological Disorders and Stroke, NIH.
References
1 Ozbay, P. S. et al. Contribution of systemic vascular effects to fMRI activity in white matter. Neuroimage 176, 541-549 (2018).
2 Tong, Y. et al. Evaluating the effects of systemic low frequency oscillations measured in the periphery on the independent component analysis results of resting state networks. Neuroimage 76, 202-215 (2013).
3 van Houdt, P. J. et al. Correction for pulse height variability reduces physiological noise in functional MRI when studying spontaneous brain activity. Hum Brain Mapp 31, 311-325 (2010).
4 Fukunaga, M. et al. Large-amplitude, spatially correlated fluctuations in BOLD fMRI signals during extended rest and early sleep stages. Magn Reson Imaging 24, 979-992 (2006).
5 Liu, X. et al. Arousal transitions in sleep, wakefulness, and anesthesia are characterized by an orderly sequence of cortical events. Neuroimage 116, 222-23 (2015).
6 Schneider, M. et al. Spontaneous pupil dilations during the resting state are associated with activation of the salience network. Neuroimage 139, 189-201(2016).
7 Chang, C. et al. Influence of heart rate on the BOLD signal: the cardiac response function. Neuroimage 44, 857-869 (2009).
8 Drobyshevsky, A. et al. A rapid fMRI task battery for mapping of visual, motor, cognitive, and emotional function. Neuroimage 31, 732-744 (2006).
9 Amalric, M. et al. Origins of the brain networks for advanced mathematics in expert mathematicians. Proc Natl Acad Sci U S A 113, 4909-4917 (2016).
10 Birn, R. M. et al. Separating respiratory-variation-related fluctuations from neuronal-activity-related fluctuations in fMRI. Neuroimage 31, 1536-1548 (2006).
11 Bright, M. G. et al. Early anti-correlated BOLD signal changes of physiologic origin. Neuroimage87, 287-296 (2014).
12 Chen, J. E. et al. Resting-state “Physiological Networks”. bioRxiv (2019).
Figures
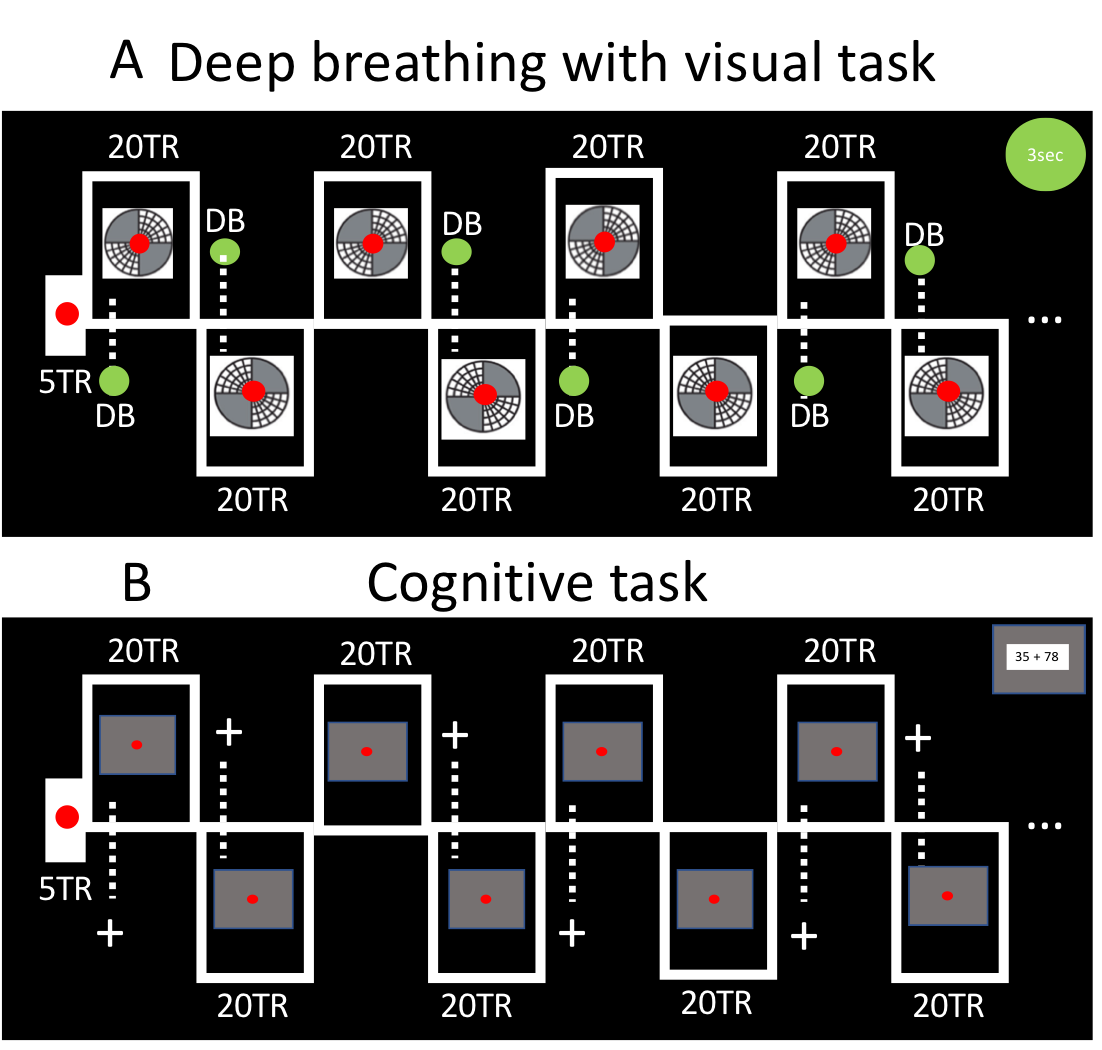
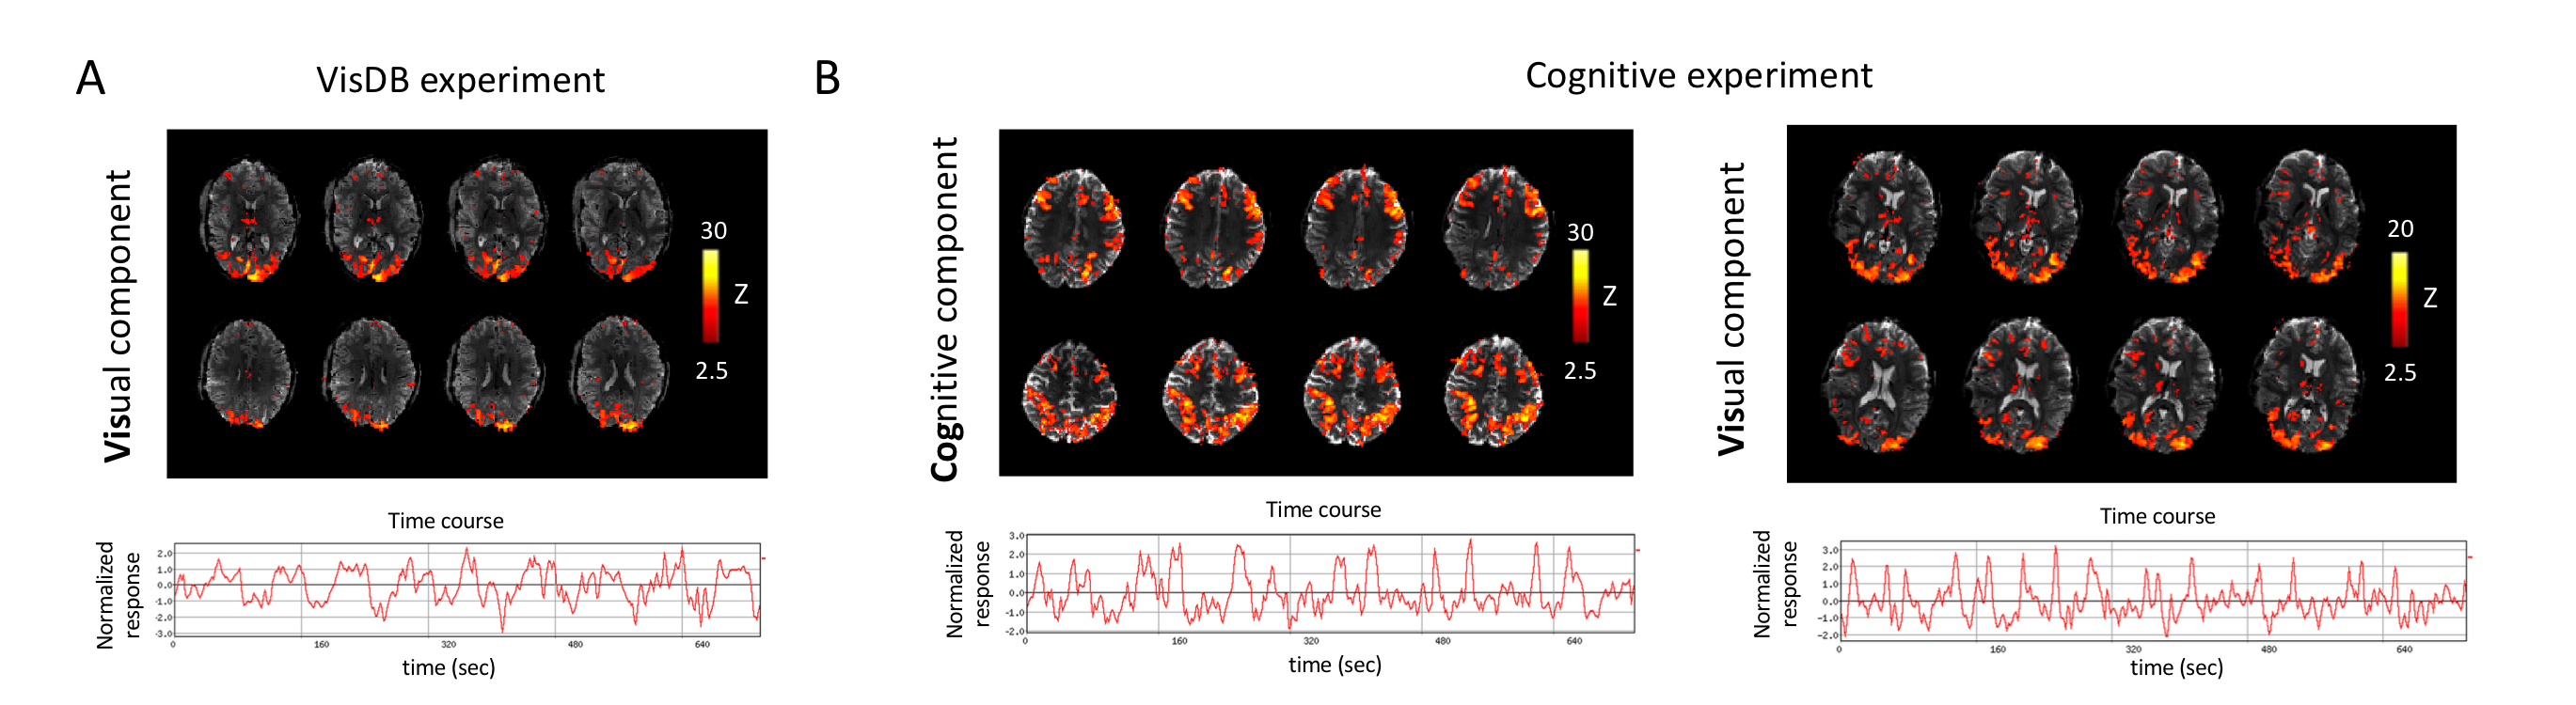
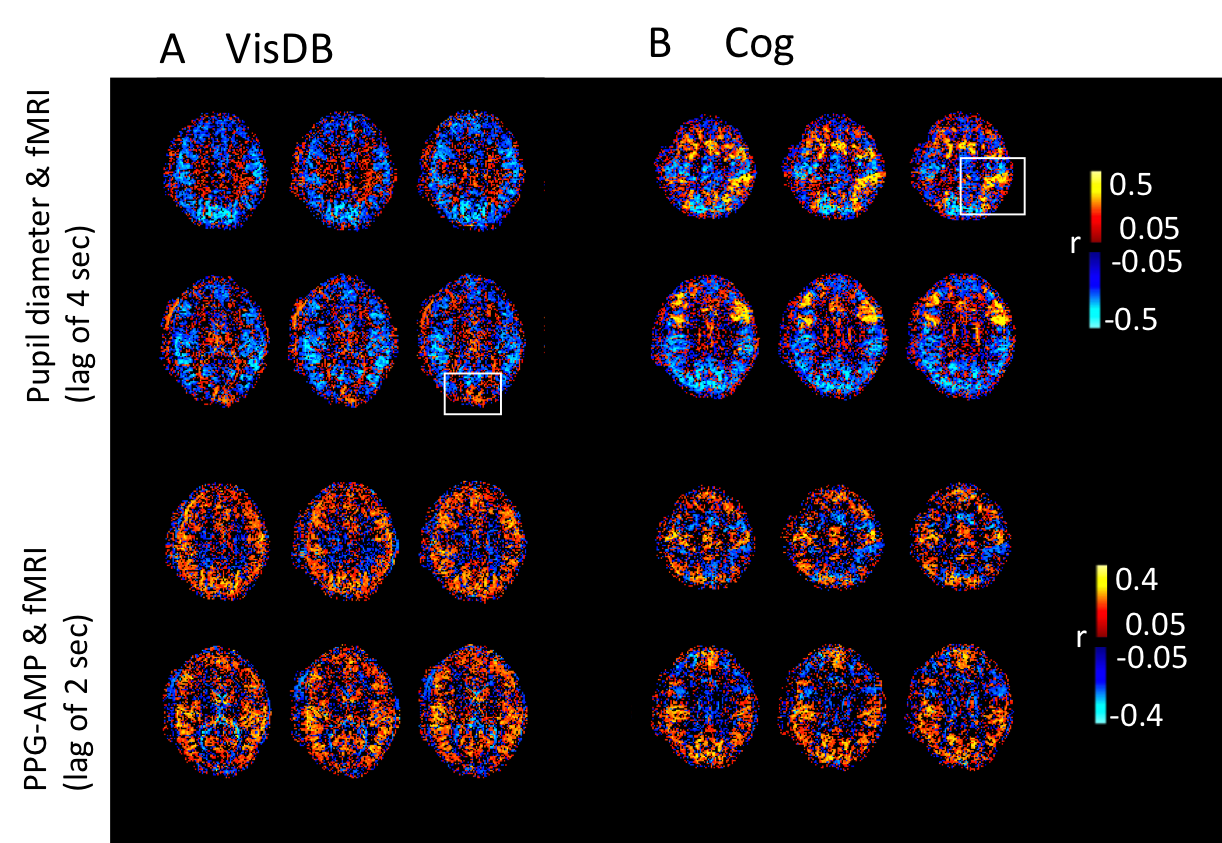
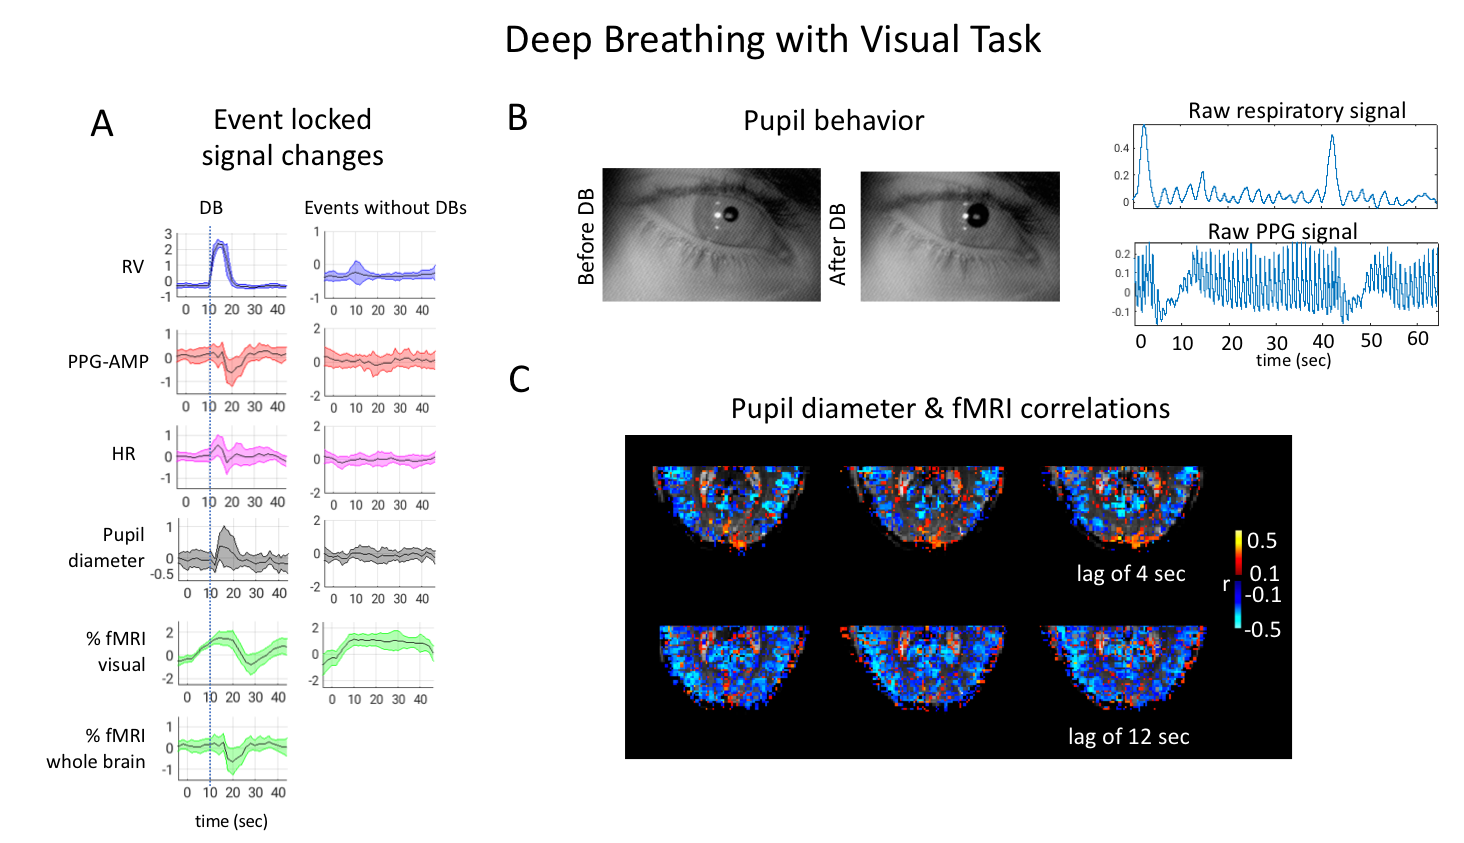
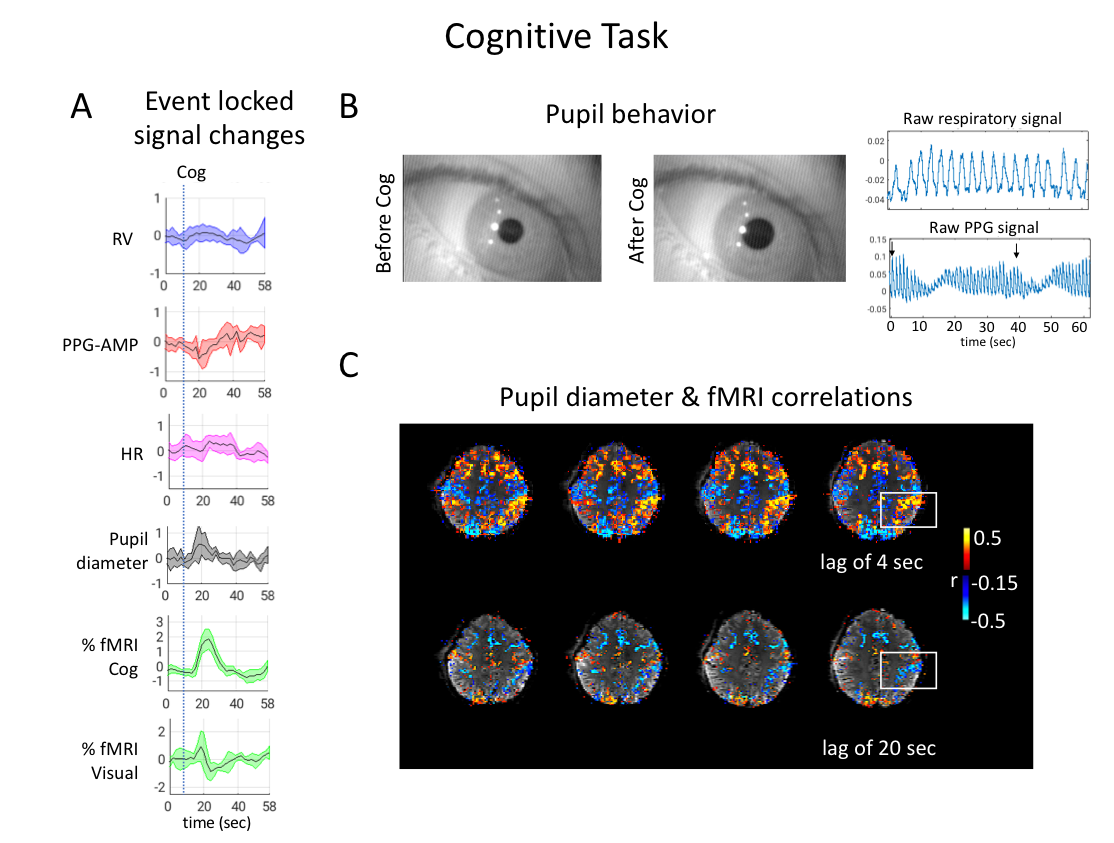
Fig. 5. Results from a Cog experiment. (A) Averaged (n=6) event-locked normalized signals. %fMRI signal changes were calculated within task related cognitive, and visual components. PPG-AMPs were clipped at three standard deviations to exclude brief movements. (B) Examples of pupil behavior, raw respiratory and PPG signals during Cog. (C) Subject level voxel-wise correlations of pupil diameter and fMRI at a lag of 4 and 20 sec. Negative correlation at a positive lag means pupil dilation is followed by an fMRI signal drop.