1359
Employing simultaneous functional PET/MRI to map neuronal and vascular dynamics accompanying brain arousal fluctuations1Athinoula A. Martinos Center for Biomedical Imaging, Massachusetts General Hospital, Boston, MA, United States, 2Radiology, Harvard Medical School, Boston, MA, United States, 3Biomedical Engineering, Boston University, Boston, MA, United States
Synopsis
In this study, we investigated the feasibility of integrating simultaneous fMRI and functional PET to uncover metabolic and hemodynamic changes linked with arousal. Our findings suggested that this multi-modal toolset can reliably detect brain-wide hemodynamic and metabolic changes spanning “alert”, “drowsy” and “sleep” conditions, therefore holding great promise in disentangling arousal-induced neuronal and vascular dynamics in future investigations.
Introduction & Motivation
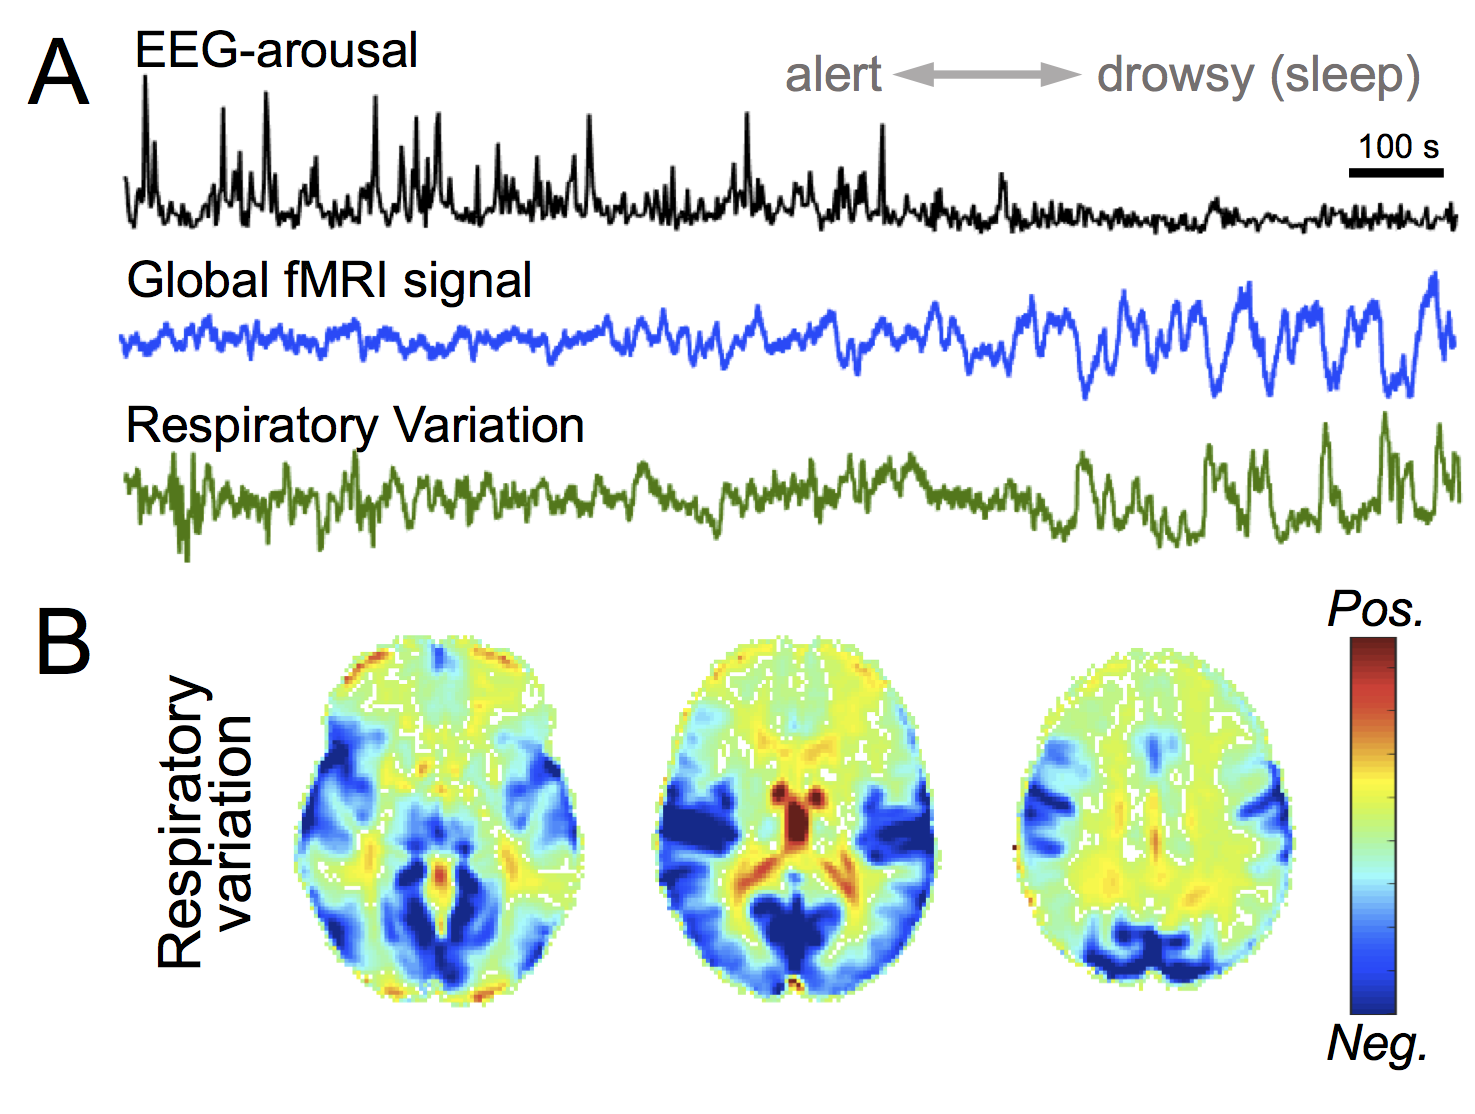
Brain arousal levels can undergo substantial variations over the course of a single imaging session and exert prominent modulation of neural dynamics1. To date, fMRI has been the primary technology for noninvasively mapping whole brain circuitry linked with arousal, by virtue of its high spatial localization and sensitivity2-4. Yet, brain arousal changes are accompanied by variations of systemic physiology, which are regulated by the autonomic nervous system and can also evoke brain-wide hemodynamic changes. In particular, emerging studies have demonstrated an accentuated coupling between systemic physiology and the global fMRI signal during sleep5,6 (illustrated in Fig. 1), thus raising questions regarding the neuronal or vascular origin of arousal-induced dynamics measured by fMRI.Methods
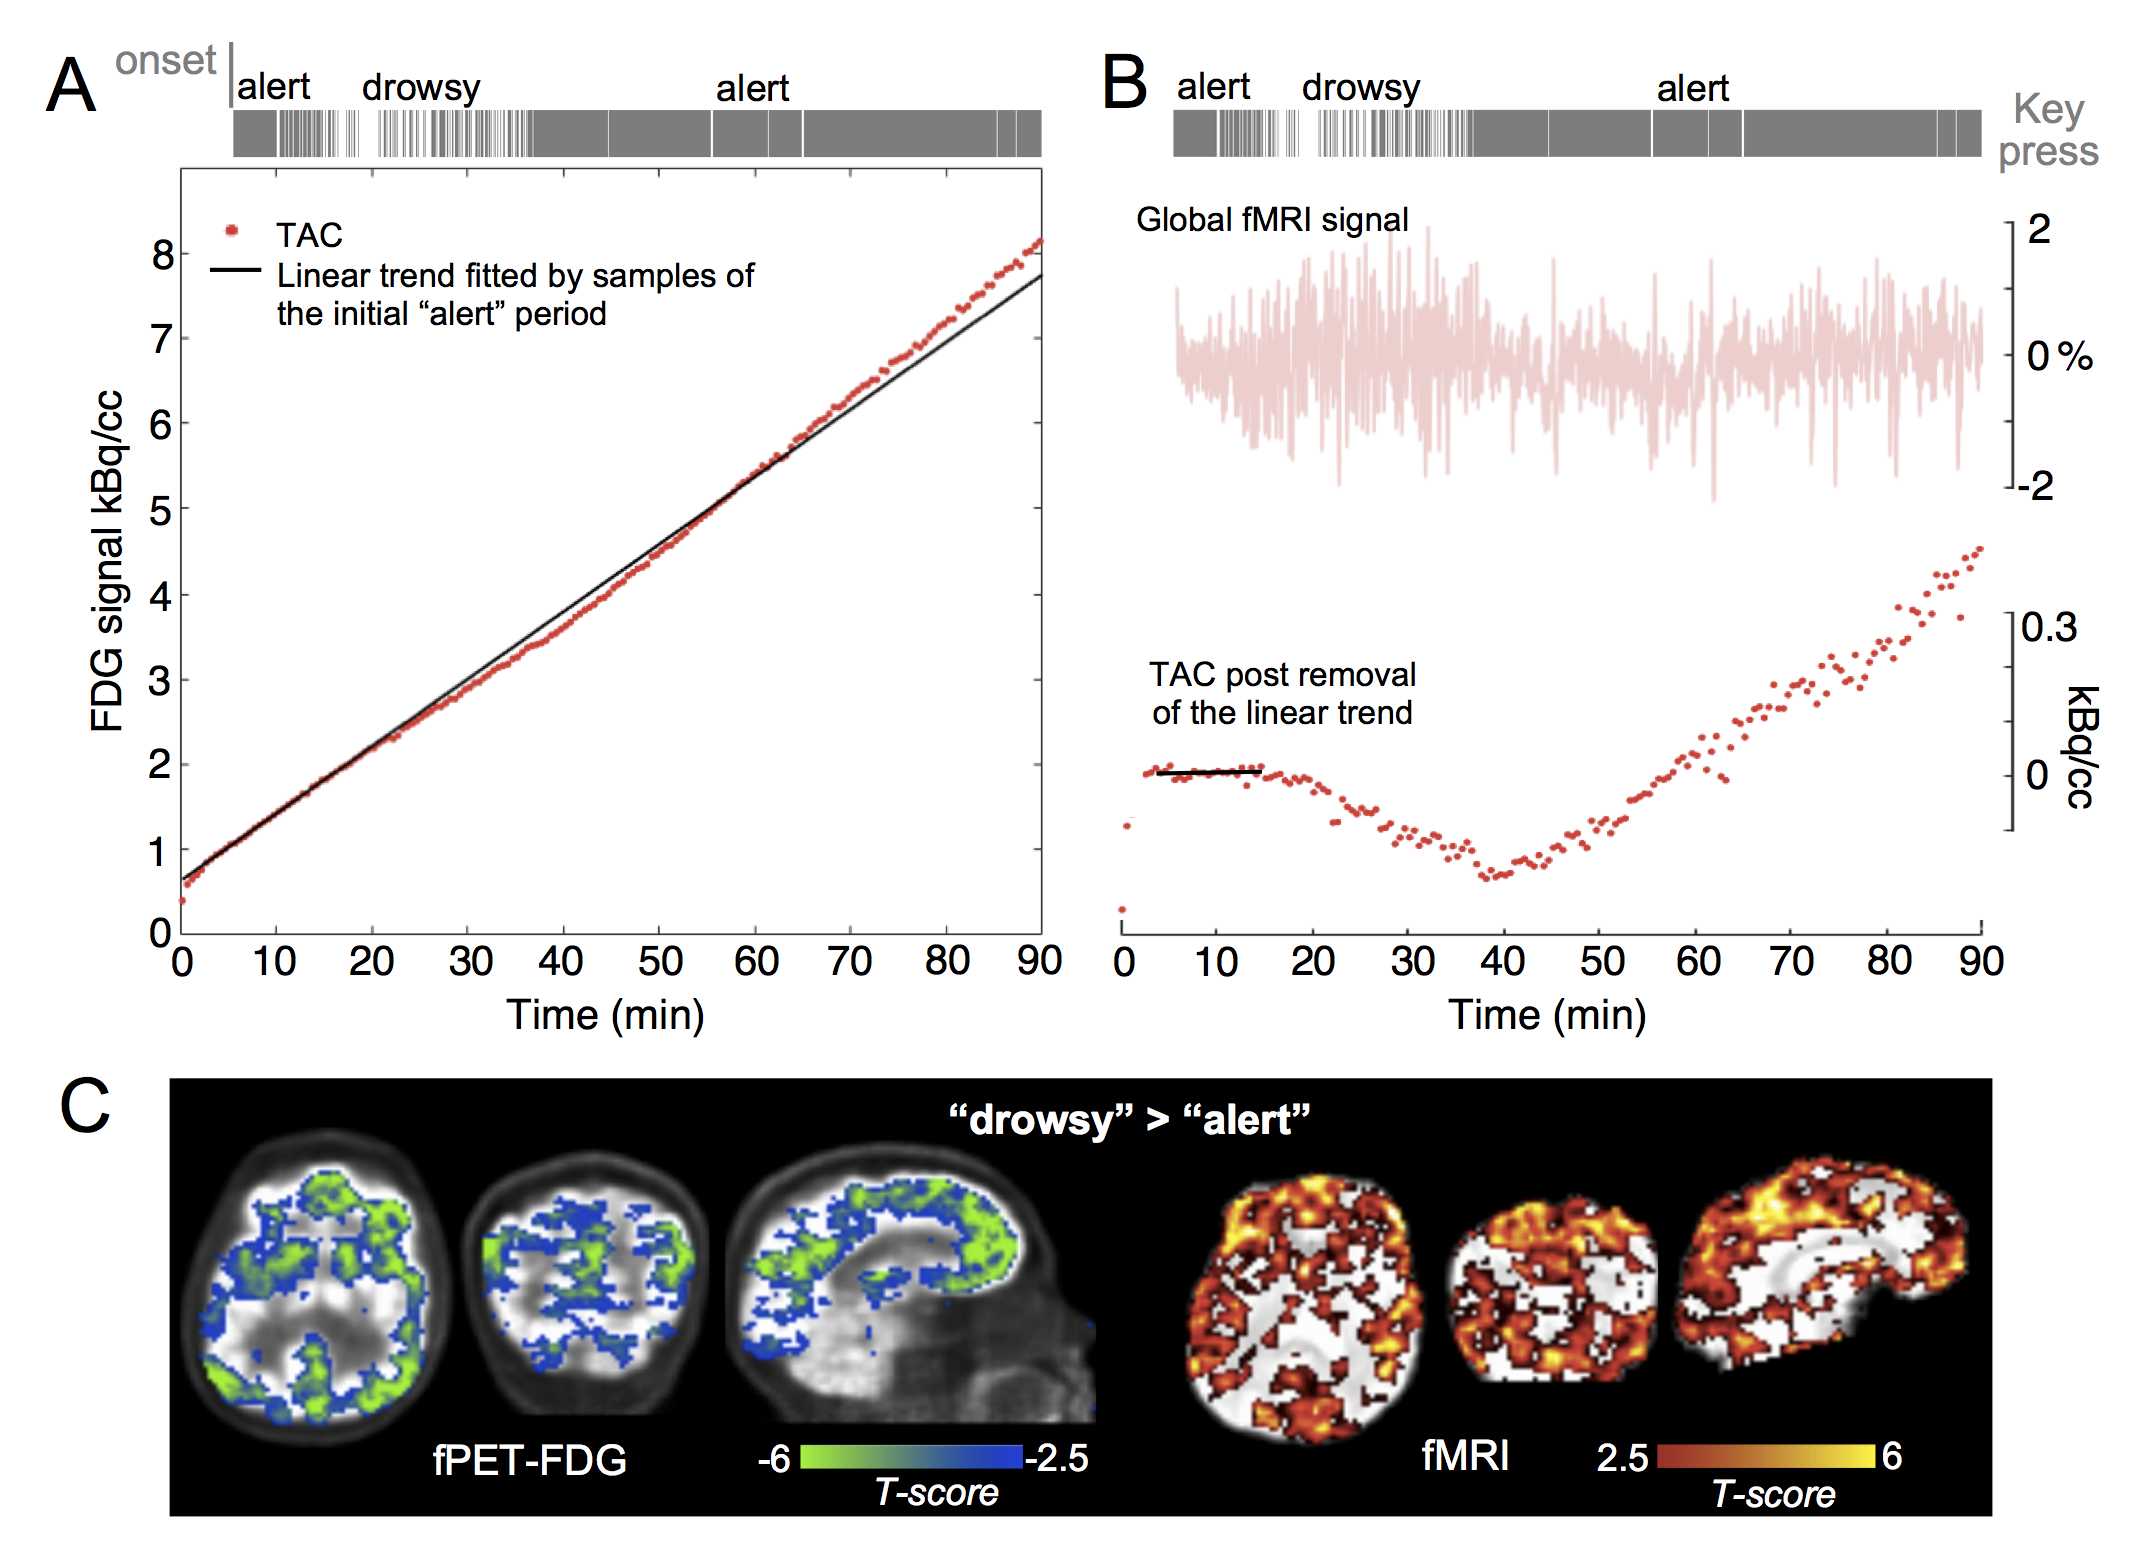
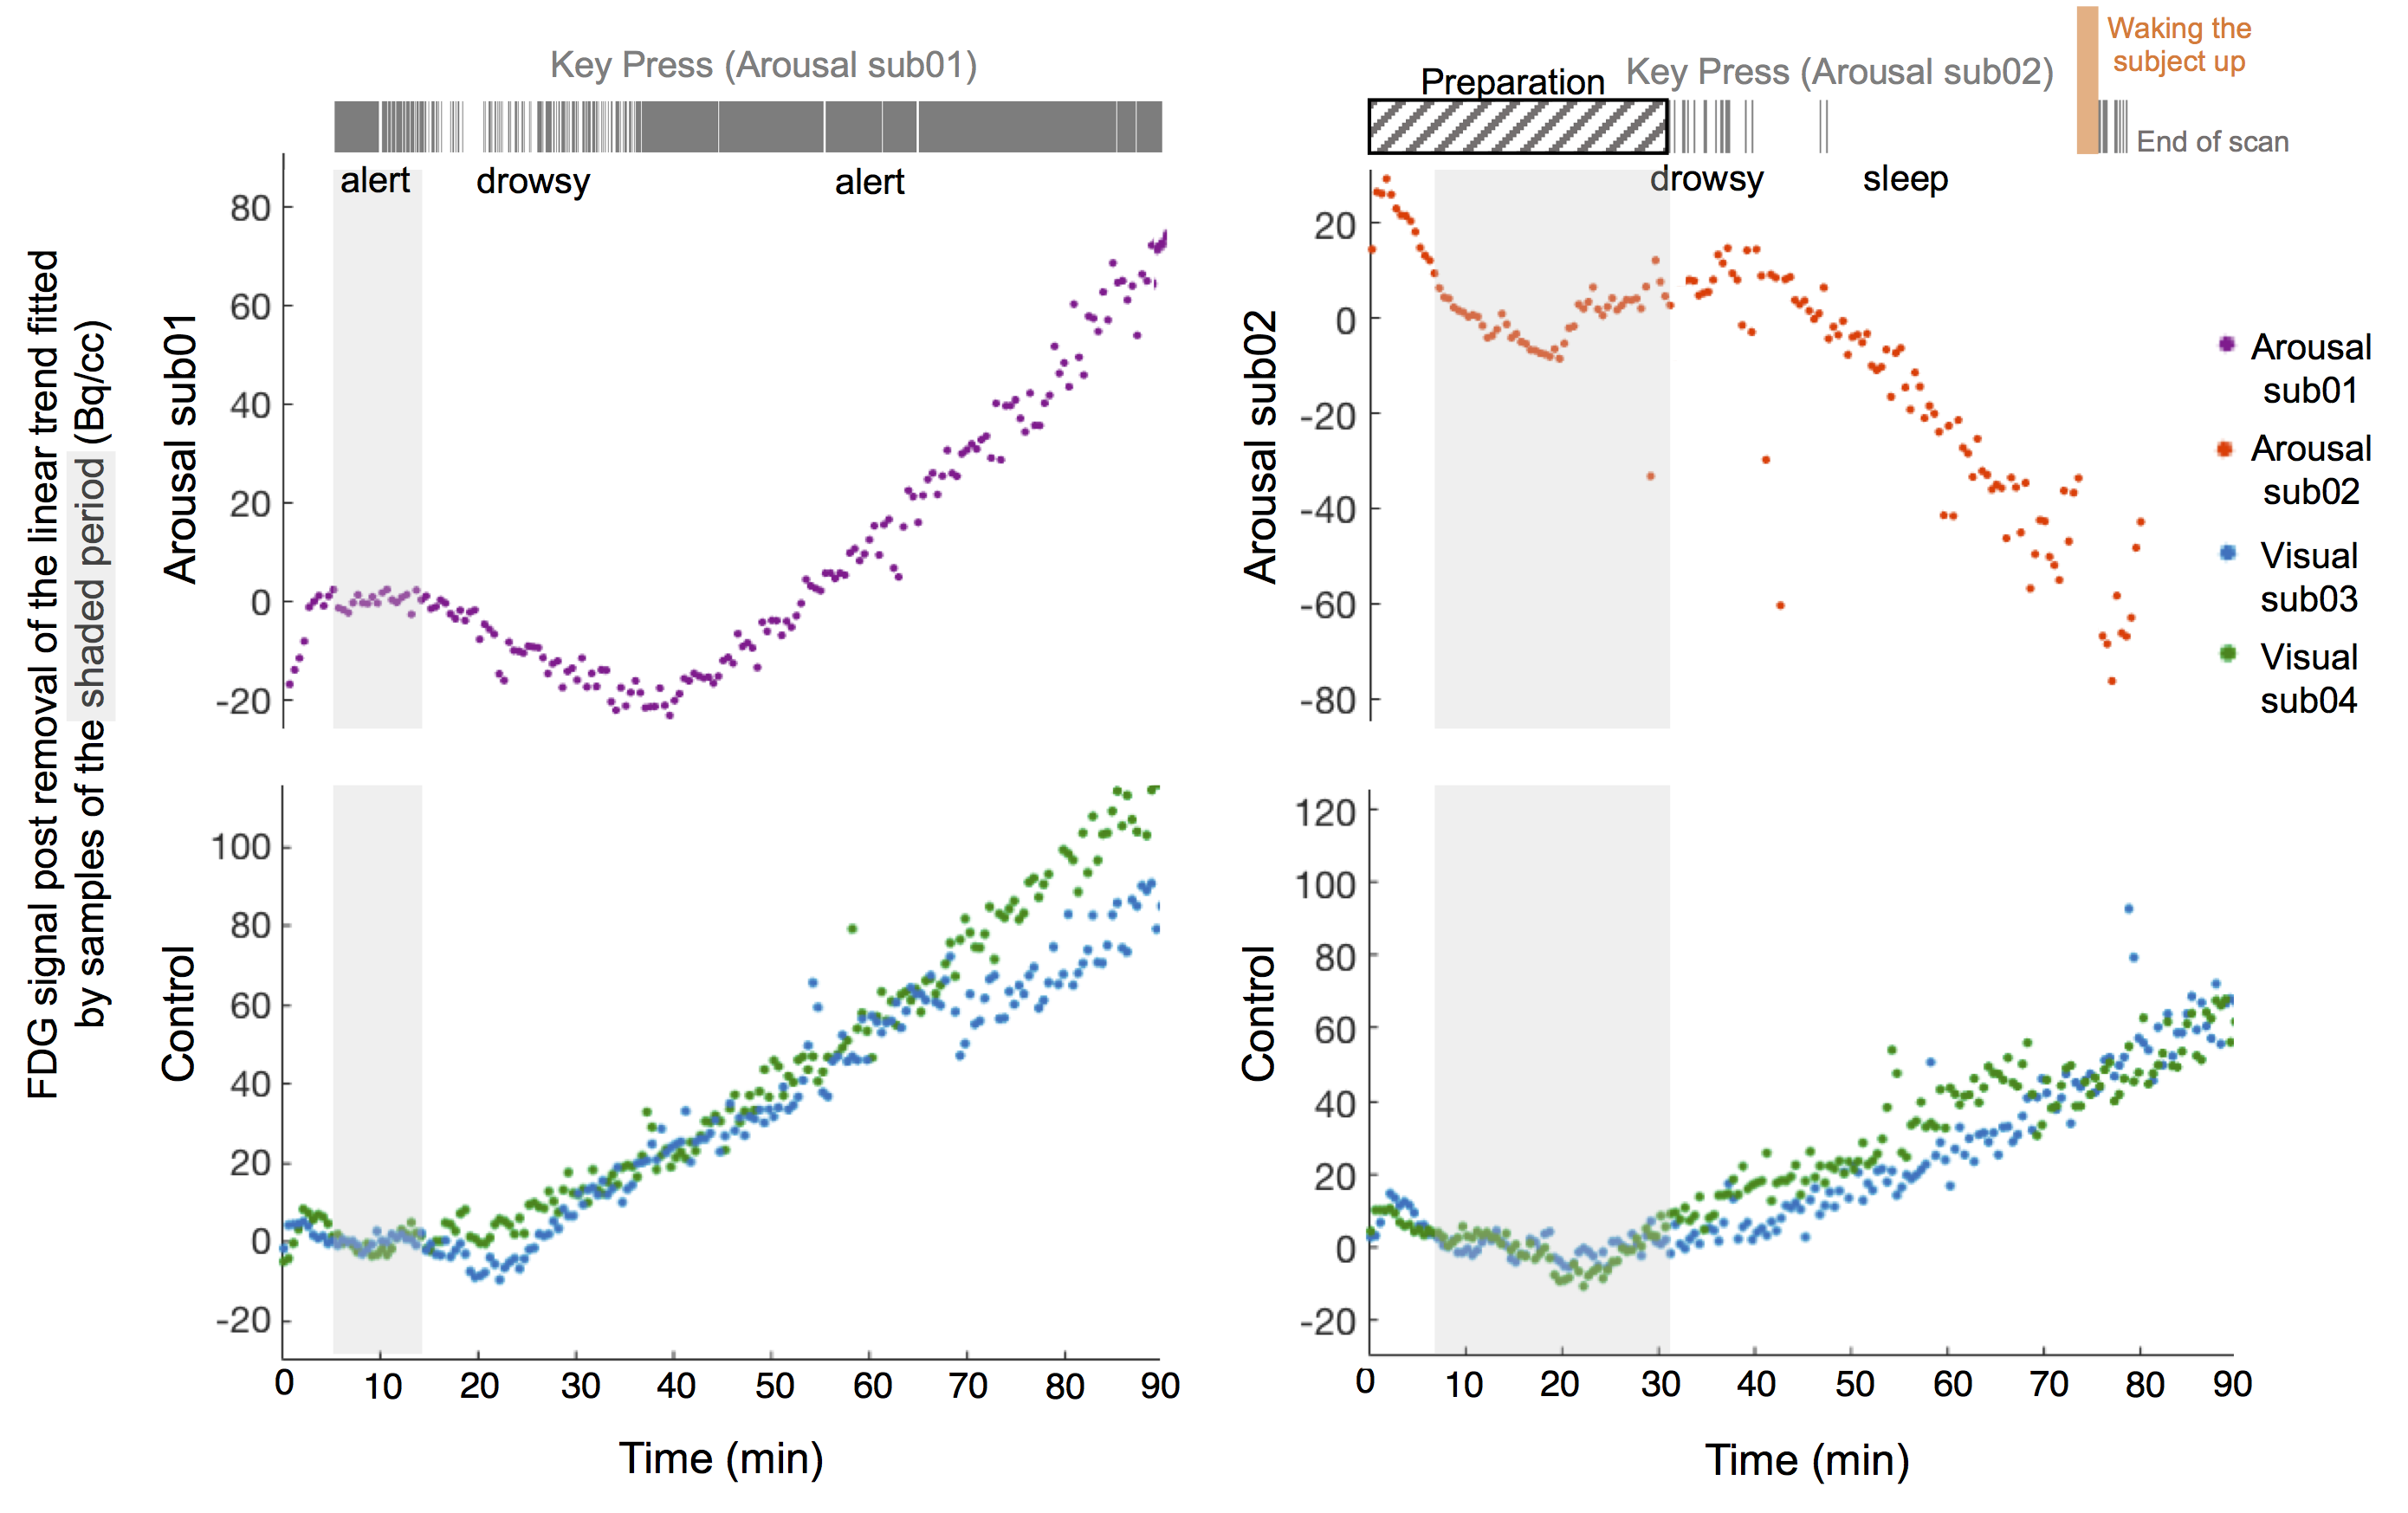
Experiments: Two subjects (‘Arousal sub01’ and ‘Arousal sub02’) participated in the concurrent PET/MRI experiments (in a 3T MR scanner with a high-resolution BrainPET insert). They were instructed to close their eyes and relax throughout the scan, while performing a simple breath-counting task (pressing keys every time he/she breathed in or out) to provide an instantaneous behavioral measure of arousal levels. FDG injection: FDG in saline solution was administrated using a 20% bolus (1 mCi) plus constant infusion paradigm11 (initial activity $$$\approx$$$ 5 mCi, constant infusion rate = 0.01 ml/s). PET acquisition & analysis: PET images were collected and stored in a list-mode format, and reconstructed with a standard 3D ordinary Poisson ordered-subset expectation maximization algorithm. A high-resolution T1 anatomical image (1 mm iso., MPRAGE) was acquired for photon attenuation correction. The fPET data were reconstructed with an isotropic voxel size of 2.5 mm and binned into time frames with 30 s temporal resolution. A general linear model (GLM) was employed to map differential metabolic levels among “alert” (regular key presses), “drowsy” (intermittent key presses) and “sleep” (no key presses) conditions. Constructions of arousal regressors follow Hahn et al.10 (treating one condition as “task”, and the other condition as “control”), and each transition of arousal condition was modeled by a separate regressor. As a control analysis, fPET time activity curves (TACs) of each subject were additionally contrasted against fPET TACs of two different subjects participating in separate visual experiments (‘Visual sub03’ and ‘Visual sub04’; an identical FDG administration paradigm as the arousal experiments was used; both subjects were awake throughout the experiments, evidenced by robust visual activation). fMRI acquisition & analysis: BOLD-weighted EPI data (3 mm iso., TR/TE = 2000/30 ms) were collected to track ongoing hemodynamic changes. The number of key presses was summed across a sequence of 30-s long temporal windows to achieve a graded measure of arousal fluctuations, which was subsequently regressed against the windowed measures of each voxel’s percent signal changes (standard deviations of fluctuations within each window) to yield the spatial pattern of arousal-coupled fMRI changes.Results
Arousal-induced alterations of brain metabolic dynamics could be identified from the PET TACs (Figs. 2, 3), and manifested in extensive brain regions (Fig. 2C). The preliminary results showed that both transitions from “alert” to “drowsy” (Arousal sub01), and “drowsy” to “sleep” (Arousal sub02) states led to marked reduction in [18F]FDG uptake and thus the level of global glucose utilization, complementing globally increasing hemodynamic fluctuations measured by fMRI.Discussion & Conclusions:
Our results have demonstrated the feasibility of employing concurrent fPET/fMRI to map brain-wide hemodynamic and metabolic changes linked with arousal. These initial datasets also demonstrate for the first time that signal reductions in fPET can be detected, as opposed to previously demonstrated signal increases. Complementary information gathered from both modalities may hence provide a promising avenue to dissect arousal-induced neuronal and vascular dynamics in future investigations.Acknowledgements
This work was supported in part by the NIH NIBIB (grants P41-EB015896, and R01-EB019437), by the NIH NIMH (grants R01-MH111438, R01-MH111419 and R00-MH111748), by the NIH NIDA (grant R00-DA043629), and by the MGH/HST Athinoula A. Martinos Center for Biomedical Imaging; and was made possible by the resources provided by NIH Shared Instrumentation Grants S10-RR023043, S10-RR019371, S10-RR026666, S10-RR022976, S10-RR019933 and S10-RR017208.References
[1] Tagliazucchi, E., & Laufs, H. (2014). Decoding wakefulness levels from typical fMRI resting-state data reveals reliable drifts between wakefulness and sleep. Neuron, 82(3), 695-708.
[2] Chang, C. et al. (2016). Tracking brain arousal fluctuations with fMRI. Proceedings of the National Academy of Sciences, 113(16), 4518-4523.
[3] Wong, C. W., Olafsson, V., Tal, O., & Liu, T. T. (2013). The amplitude of the resting-state fMRI global signal is related to EEG vigilance measures. Neuroimage, 83, 983-990.
[4] Falahpour, M., Chang, C., Wong, C. W., & Liu, T. T. (2018). Template-based prediction of vigilance fluctuations in resting-state fMRI. Neuroimage, 174, 317-327.
[5] Özbay, P. S., et al. (2018). Contribution of systemic vascular effects to fMRI activity in white matter. Neuroimage, 176, 541-549.
[6] Özbay, P. S., et al. (2019). Contribution of sympathetic vasoconstriction to the fMRI global signal during autonomic arousal. ISMRM, 0531.
[7] Chang, C., Cunningham, J. P., & Glover, G. H. (2009). Influence of heart rate on the BOLD signal: the cardiac response function. Neuroimage, 44(3), 857-869.
[8] Van Essen, D. C. et al. (2013). The WU-Minn human connectome project: an overview. Neuroimage, 80, 62-79.
[9] Villien, M. et al. (2014). Dynamic functional imaging of brain glucose utilization using fPET-FDG. Neuroimage, 100, 192-199.
[10] Hahn, A. et al. (2016). Quantification of task-specific glucose metabolism with constant infusion of 18F-FDG. Journal of Nuclear Medicine, 57(12), 1933-1940.
[11] Rischka, L. et al. (2018). Reduced task durations in functional PET imaging with [18F] FDG approaching that of functional MRI. NeuroImage, 181, 323-330.
Figures