1358
Metabolic basis of activated and deactivated brain network nodes in fMRI paradigms1Yale University, New Haven, CT, United States, 2University of Copenhagen, Copenhagen, Denmark, 3University of Louvain, Louvain, Belgium, 4School of Optometry, Montreal, QC, Canada
Synopsis
Functional MRI using blood oxygenation level dependent (BOLD) contrast identifies brain regions for task-induced (de)activation paradigms. We investigated the metabolic basis of these paradigms in activated (visual cortex, VC) and deactivated (posterior cingulate cortex, PCC) network nodes using concurrent acquisitions of J-edited lactate/GABA(γ-aminobutyric acid)/Glx(pooled glutamate and glutamine) and diffusion-weighted BOLD signal. In VC, we detected increased BOLD/lactate/glutamate, and decreased GABA, whereas in PCC BOLD decreased, GABA increased but lactate/glutamate did not change. These results suggest that BOLD responses in (de)activated areas is regulated by relatively rapid GABAergic inhibition, whereas aerobic glycolysis and glutamatergic activity dominate in activated nodes.
Abstract
Introduction: In task-based functional MRI (fMRI) studies, a task-positive region is where BOLD signal is greater during experimental versus rest epochs, and a task-negative region is where the BOLD signal is greater during rest versus experimental epochs1. The task-negative region is also referred to as the default mode network (DMN). In neurological and neurodegenerative conditions, the normal function of activated (e.g., motor or sensory network) and deactivated (e.g., default mode network, DMN) nodes is altered. However, in normal brain, it remains unknown how aerobic glycolysis and excitatory-inhibitory balance vary across activated and deactivated networks. Here we investigated the metabolic basis of (de)activation paradigms in non-DMN and DMN areas using concurrent fMRI-fMRS acquisitions of J-edited2 lactate and GABA(γ-aminobutyric acid)/Glx(pooled glutamate and glutamine co-edited with GABA) and diffusion-weighted BOLD signal.Methods: Twenty healthy volunteers (10 male, age 29±2) participated in two fMRI and two fMRI-fMRS runs spanning over three days. First, we used fMRI at 3T to localize the visual cortex (VC, non-DMN area) and the posterior cingulate cortex (PCC, DMN area), using activation (visual flashing checkerboard) and deactivation (auditory emotion perception) paradigms, respectively. The fMRI and fMRI-fMRS runs consisted of three 2.7min VC (or PCC) stimulation epochs interleaved with three 2.7min fixation (or rest) epochs, respectively. For VC activation paradigm, the whole-screen flashing (8Hz) checkerboard was used as visual stimuli (visual angle 15×18°). Subjects were asked to fixate a grey dot in the center of the screen and press a response button when the dot’s color changed to green3. For PCC deactivation paradigm, participants listened to short sentences audio-emotion portrayals4 with eyes closed, and they were asked to press the response button each time a specific emotion, contempt, disgust or surprise, was identified, which occurred 3-5 times per activation epoch. Bilateral VC and PCC (de)activations were identified using statistical parametric mapping (SPM12). A single fMRI-fMRS voxel was placed around the identified VC and PCC areas. All experiments were performed at the MRRC (Yale University) on a 3T Siemens Prisma scanner using 64-channels head coil (whole-brain fMRI) and 4T Bruker spectrometer single-channel quadrature surface head coil (concurrent single-voxel fMRI-fMRS). For fMRI, we used gradient-echo T2*-weighted EPI (648 scans, TR = 1.5s, TE = 30ms, 2mm3 voxels). Prior to fMRI-fMRS acquisitions, we acquired B0 field map and water spectrum, adjusted basic frequency and shimming globally and locally, and optimized RF power. For fMRI-fMRS we used J-difference editing (180 paired spectra, TR = 2.7s, TE = 144ms/70ms, ~14mL VC and ~25mL PCC voxels. Each pair of the water-suppressed J-edited spectra was followed by the diffusion-weighted STEAM5 water spectra acquisition (TE = 20ms, b = 1400s/mm2) with 200ms delay between the two MRS acquisitions. J-edited spectra were corrected for a basic frequency drift, aligned, phase-corrected, apodized (gaussian 2Hz, exponential 2Hz) and averaged. Individual spectra were centered and aligned to the group average reference NAA peak. The residual BOLD linewidth narrowing was estimated using line-shape differences in NAA peak between the (de)activation and rest and nulled using exponential linewidth adjustment. The same corrections were applied to J-edited sum and difference spectra. Lactate/GABA/glutamate levels were estimated using LCM quantification and normalized to the corresponding NAA levels (CRLB<20)6. STEAM water spectra underwent the same spectra preprocessing procedure. To estimate the T2*, we applied water peak linewidth linear approximation using logarithm of the water FID7.
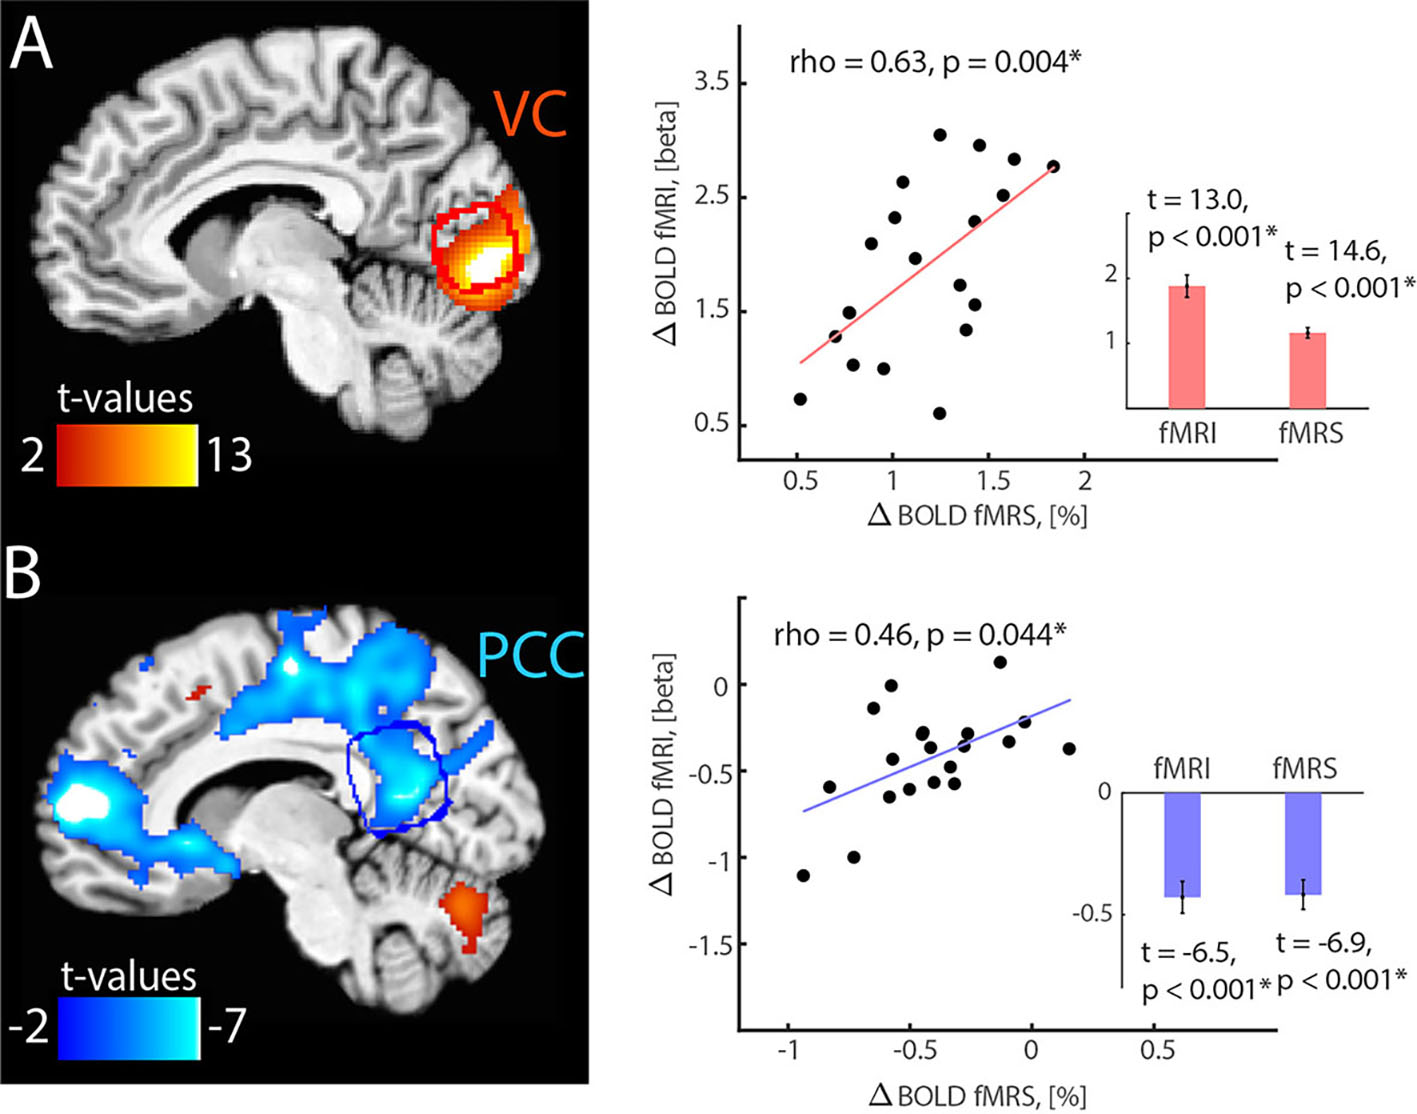
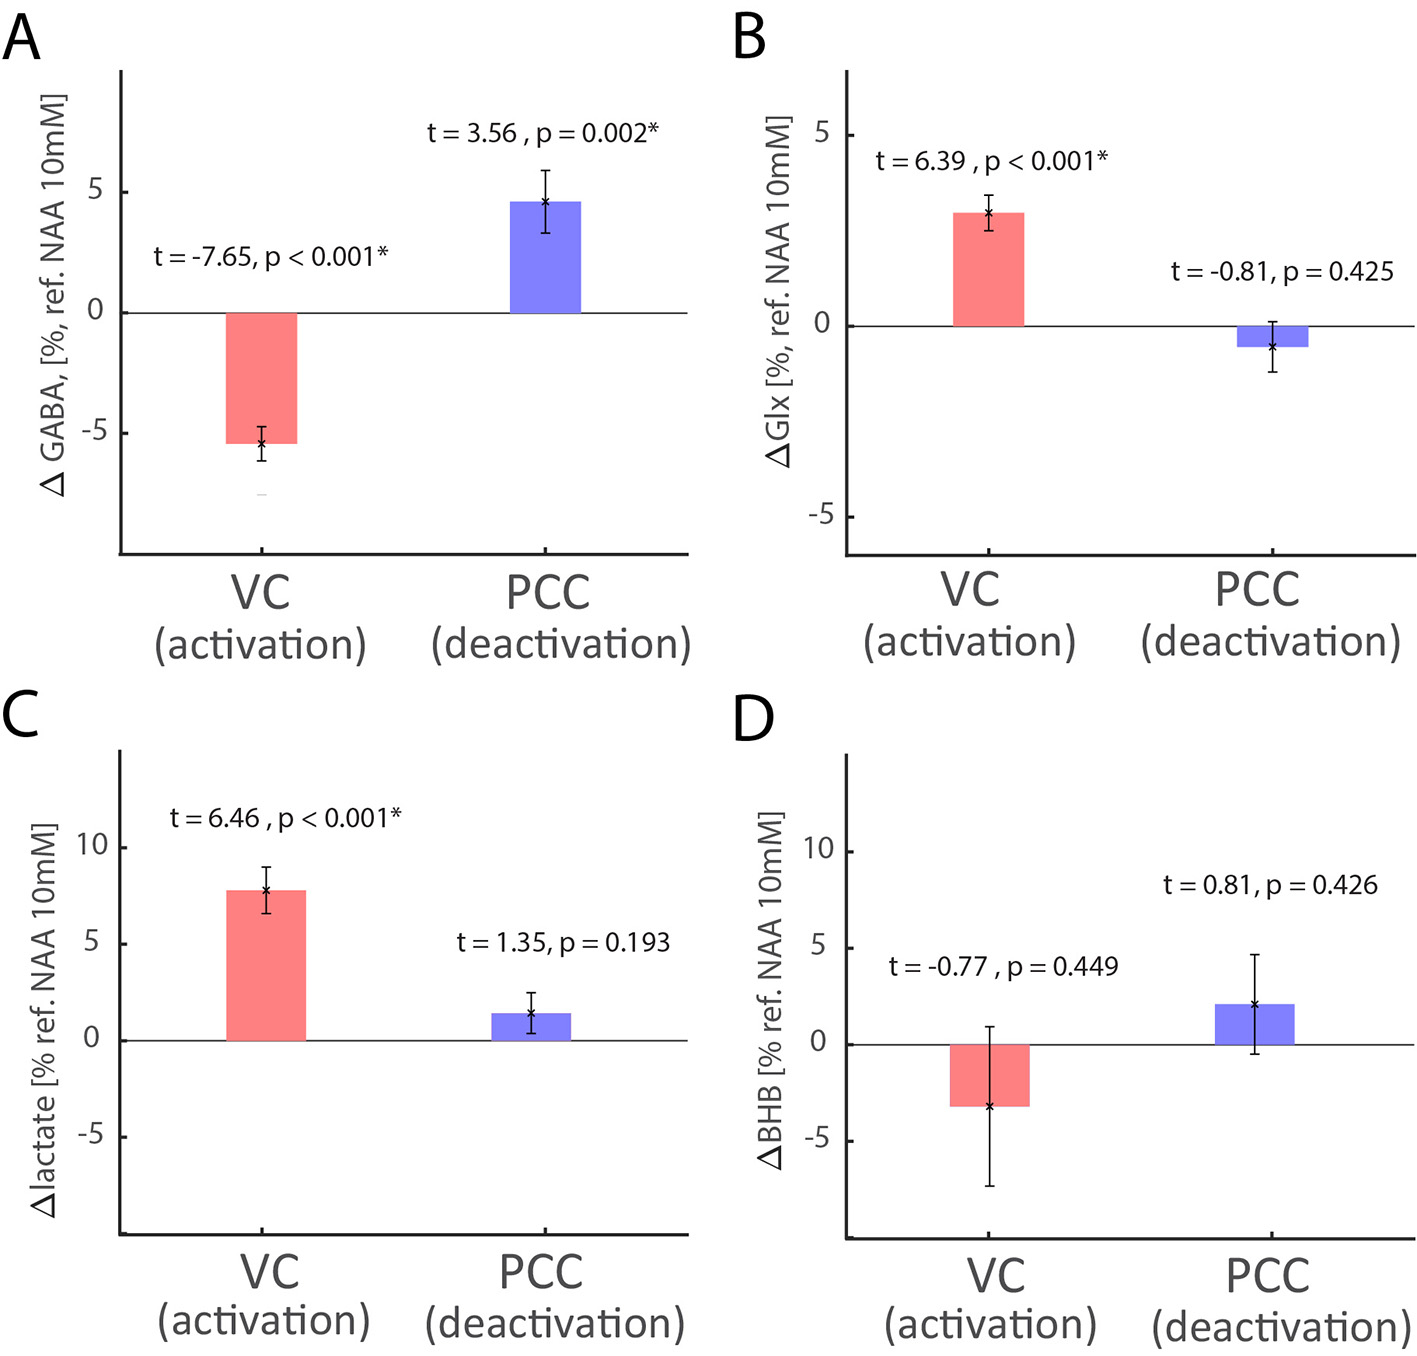
Results: Whole-brain fMRI revealed expected VC activation and PCC deactivations, which was in good agreement with BOLD changes estimated from single-voxel fMRI-fMRS data (Fig.1A). In fMRI-fMRS VC runs, we found a significant increase of BOLD (1.16±0.08%), Glx (3.0±0.5% from baseline level 1.50±0.05 a.u.) and lactate (7.8±1.2% from baseline level 0.99±.03 mM) during visual stimulation as compared to fixation, and a decrease of GABA (-5.7±0.7% from baseline level 2.22±0.07 mM) (Fig. 1B-D). In fMRI-fMRS PCC runs, we found a significant decrease of BOLD (0.42±0.06%), and an increase of GABA (4.9±1.4% from baseline level 2.26±0.07 mM) during auditory emotional stimulation as compared to rest, but no lactate and Glx changes (Fig. 1B-D). Glx levels are in a.u. due to the J-editing optimal set for GABA. Of note, VC activation-induced glutamate and lactate changes were in good agreement with prior (non-)edited spectra8-13. Lactate and β-hydroxybutyrate (BHB) are co-edited14, however we did not observe significant changes in BHB.
Discussion and Conclusion: Our findings strengthen the link between hemodynamic response, aerobic glycolysis, and inhibitory-excitatory activities. We found that functional rise of aerobic glycolysis and glutamatergic activity is specific to activated nodes, however, relatively rapid similar inhibitory mechanisms affect BOLD responses in activated and deactivated areas. The observed GABA level could be a consequence of phasic and tonic release occurring at the synaptic level. Our study highlights the importance of the concurrent fMRI-fMRS acquisitions for unveiling neurometabolic basis of the (de)activated network nodes and interpretation of neural activity by neurochemistry and hemodynamics in health and disease.
Acknowledgements
This study was supported by the Swiss National Science Foundation (P300PB_161083) and the National Institute of Health, USA (R01 NS-100106, R01 MH-067528, R21 MH-110862, P30 NS-052519).References
1 Buckner, R. L., Andrews-Hanna, J. R. & Schacter, D. L. The brain's default network: anatomy, function, and relevance to disease. Annals of the New York Academy of Sciences 1124, 1-38, doi:10.1196/annals.1440.011 (2008).
2 Rothman, D. L., Behar, K. L., Hetherington, H. P. & Shulman, R. G. Homonuclear 1H double-resonance difference spectroscopy of the rat brain in vivo. Proceedings of the National Academy of Sciences of the United States of America 81, 6330-6334 (1984).
3 Bianciardi, M. et al. Modulation of spontaneous fMRI activity in human visual cortex by behavioral state. Neuroimage 45, 160-168, doi:10.1016/j.neuroimage.2008.10.034 (2009).
4 Banziger, T., Mortillaro, M. & Scherer, K. R. Introducing the Geneva Multimodal expression corpus for experimental research on emotion perception. Emotion 12, 1161-1179, doi:10.1037/a0025827 (2012).
5 Frahm, J., Merboldt, K. D. & Hanicke, W. Localized Proton Spectroscopy Using Stimulated Echoes. J Magn Reson 72, 502-508, doi:Doi 10.1016/0022-2364(87)90154-5 (1987).
6 Provencher, S. W. Automatic quantitation of localized in vivo 1H spectra with LCModel. NMR in biomedicine 14, 260-264 (2001).
7 Koush, Y., Elliott, M. A., Scharnowski, F. & Mathiak, K. Real-time automated spectral assessment of the BOLD response for neurofeedback at 3 and 7T. Journal of neuroscience methods 218, 148-160, doi:10.1016/j.jneumeth.2013.05.002 (2013).
8 Koush, Y., de Graaf, R. A., Jiang, L., Rothman, D. L. & Hyder, F. Functional MRS with J-edited lactate in human motor cortex at 4T. Neuroimage, doi:10.1016/j.neuroimage.2018.09.008 (2018).
9 Kurcyus, K. et al. Opposite Dynamics of GABA and Glutamate Levels in the Occipital Cortex during Visual Processing. The Journal of neuroscience : the official journal of the Society for Neuroscience 38, 9967-9976, doi:10.1523/JNEUROSCI.1214-18.2018 (2018).
10 Chen, C. et al. Activation induced changes in GABA: Functional MRS at 7T with MEGA-sLASER. Neuroimage 156, 207-213, doi:10.1016/j.neuroimage.2017.05.044 (2017).
11 Mekle, R. et al. Detection of metabolite changes in response to a varying visual stimulation paradigm using short-TE (1) H MRS at 7 T. NMR in biomedicine 30, doi:10.1002/nbm.3672 (2017).
12 Schaller, B., Xin, L., O'Brien, K., Magill, A. W. & Gruetter, R. Are glutamate and lactate increases ubiquitous to physiological activation? A (1)H functional MR spectroscopy study during motor activation in human brain at 7Tesla. Neuroimage 93 Pt 1, 138-145 (2014).
13 Bednarik, P. et al. Neurochemical and BOLD responses during neuronal activation measured in the human visual cortex at 7 Tesla. Journal of cerebral blood flow and metabolism : official journal of the International Society of Cerebral Blood Flow and Metabolism 35, 601-610, doi:10.1038/jcbfm.2014.233 (2015).
14 Koush, Y., de Graaf, R. A., Jiang, L., Rothman, D. L. & Hyder, F. Functional MRS with J-edited lactate in human motor cortex at 4T. Neuroimage 184, 101-108, doi:10.1016/j.neuroimage.2018.09.008 (2019).
Figures