1357
Intrinsic functional connectivity of spinal cord can be used to differentiate injured monkeys from normal using machine learning1Institute of Imaging Science, Vanderbilt University Medical Center, Nashville, TN, United States, 2Radiology and Radiological Sciences, Vanderbilt University Medical Center, Nashville, TN, United States, 3Psychology, Vanderbilt University Medical Center, Nashville, TN, United States, 4Physics and Astronomy, Vanderbilt University Medical Center, Nashville, TN, United States, 5Molecular Physiology and Biophysics, Vanderbilt University Medical Center, Nashville, TN, United States, 6Biomedical Engineering, Vanderbilt University Medical Center, Nashville, TN, United States
Synopsis
The objective of this study was to investigate the presence of robust intrinsic networks inside the spinal cord of squirrel monkey and whether connectivity measures of these networks can detect injury in spinal cord. We used Independent Component Analysis of resting state fMRI data to obtain dorsal and ventral networks within the gray-matter of spinal cord. Within Horn Connectivity and Between Horn Connectivity measures were calculated based on the time course of Independent Components. A Support-Vector-Machine classifier could differentiate a spinal cord injured monkey from a control monkey using these connectivity measures with a low classification error of 6.67 %.
INTRODUCTION
Resting-state functional MRI (rsfMRI) can be used to identify and characterize functional connectivity between regions1. Presently, there have been few studies2–4 of the functional circuits within spinal cord (SC), unlike brain where several different circuits have been reliably identified. Even less is known about possible changes in functional circuits after spinal disorders. We have previously reported4 changes in resting state connectivity between the horns of the SC in non-human primates after injury using a seed based algorithm, while others2 have used data-driven approaches to identify circuits in human subjects. The objective of this study was to establish whether robust intrinsic circuits can be detected and quantified in the SC of non-human primates (squirrel monkey) using data-driven analyses of rsfMRI. We used Independent Components Analysis (ICA) as a data-driven method to characterize intrinsic networks in SC without prior knowledge of specific functional connectivity5. We further hypothesized that injury to the SC disrupts the integrity of the functional circuit patterns within and across spinal segments, and that such changes could be detected objectively using a machine learning based classifier. A specific goal was to evaluate whether quantification of the intrinsic functional connectivity using rsfMRI can be used as an imaging biomarker to evaluate the functional integrity of SC.METHODS
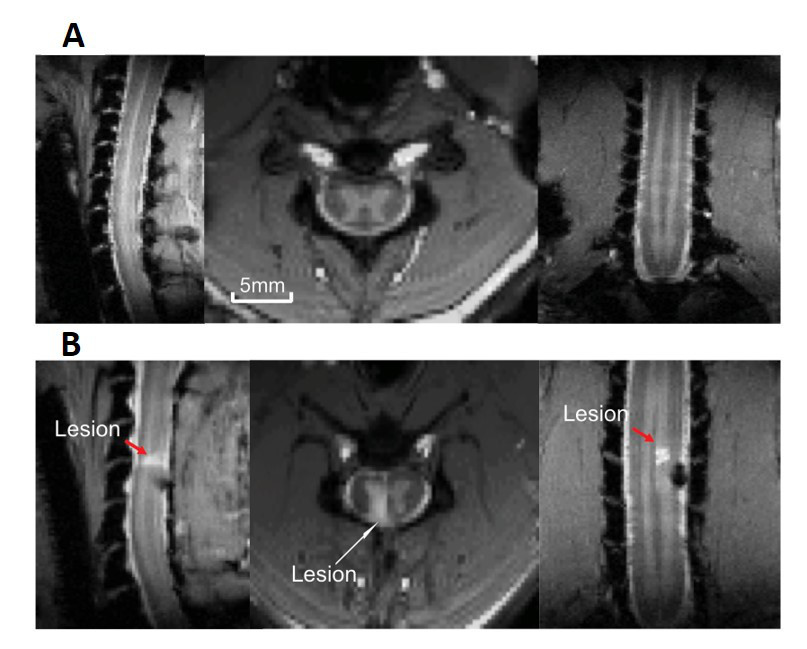
Five axial slices (each 3 mm in thickness), covering C3-C7 cervical segments of anaesthetized squirrel monkeys were acquired using an Agilent 9.4T scanner. Each imaging session consisted of rsfMRI data (300 dynamics) acquired using fast gradient echo sequence (flip angle = ~18°, TR = 46.88ms, TE: 6.5ms, 3s per volume) and corresponding magnetization transfer contrast (MTC) structural images. Data were acquired from five monkeys before (15 runs) and after (15 runs) a targeted surgical transection which resulted in a unilateral dorsal column lesion at C5 level (Fig.1). Motion, physiological signal correction (RETROICOR) followed by band pass filtering (0.01-0.1 Hz) was performed for the rsfMRI data. Both pre and post (2-4 weeks ) SC injury (SCI) data were co-registered to a customized template using FSL6 to perform group level analyses. Group spatial ICA was performed by temporal concatenation of all the data using GIFT software7 and 35 spatially independent networks were extracted within the butterfly-shaped gray-matter mask region of SC. Next, dorsal and ventral networks were identified by visual inspection of the spatial profile of Independent Components (IC). Within Horn Connectivity (WHC), which is measured by the power of the time course of each identified IC, and Between Horn Connectivity (BHC), which is measured as the correlation of time courses of the identified IC pairs8, were calculated as the two resting state connectivity measures. Two sample t-tests of the BHC measures were performed for pre and post-injury monkeys. Combination of both the connectivity measures were used as feature set to differentiate pre and post-injury monkeys using a Support-Vector-Machine (SVM) classifier with an optimized radial basis function kernel. We used all the WHC and BHC measures as initial feature set for classification. Next, an optimal feature set was selected heuristically9 by a random forest (RF) algorithm for better classification results. A 10-fold cross-validation was done for error calculation on unseen data followed by receiver operating characteristic (ROC) analyses.RESULTS
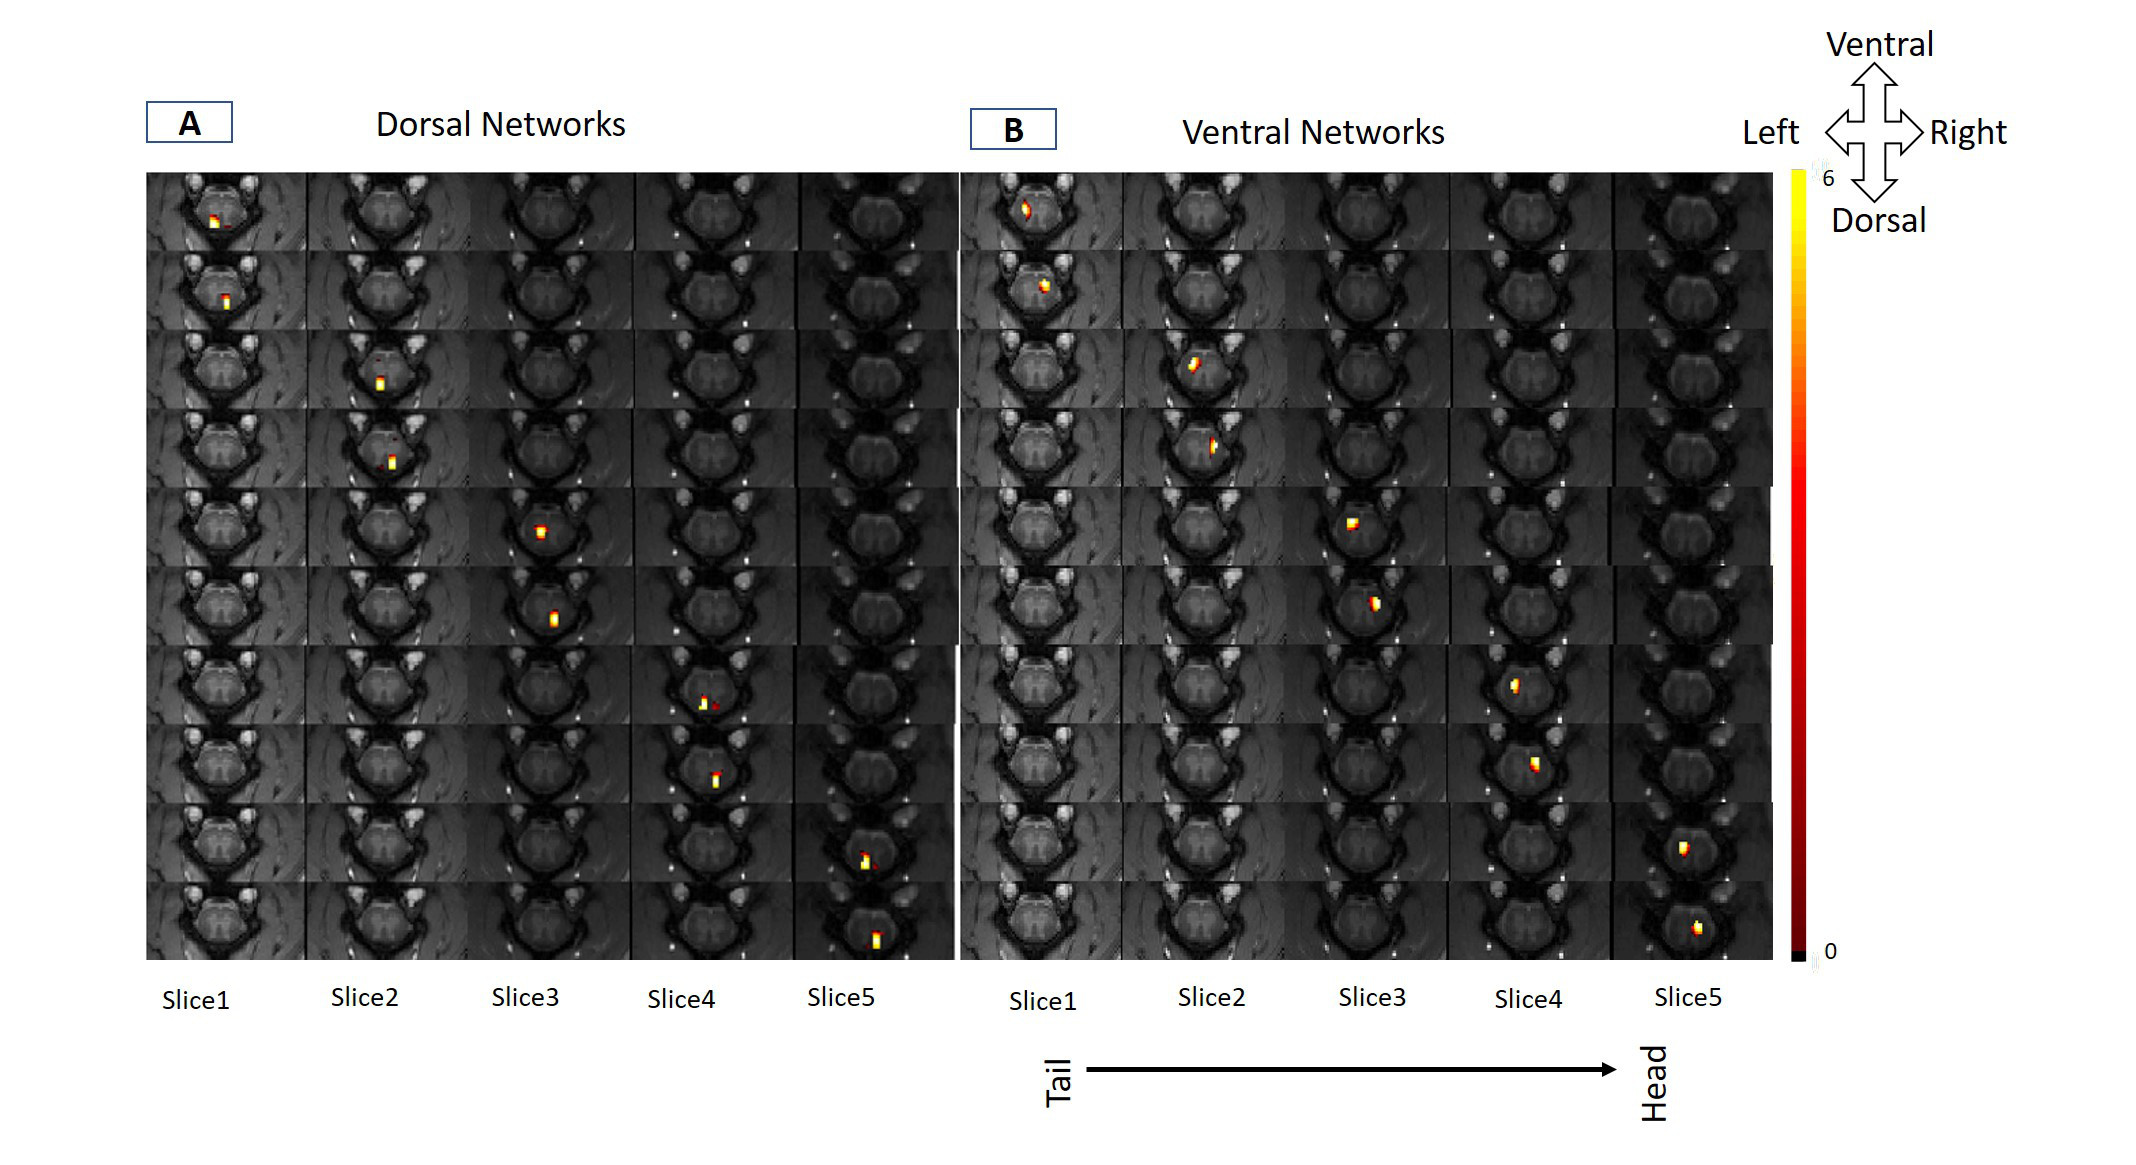
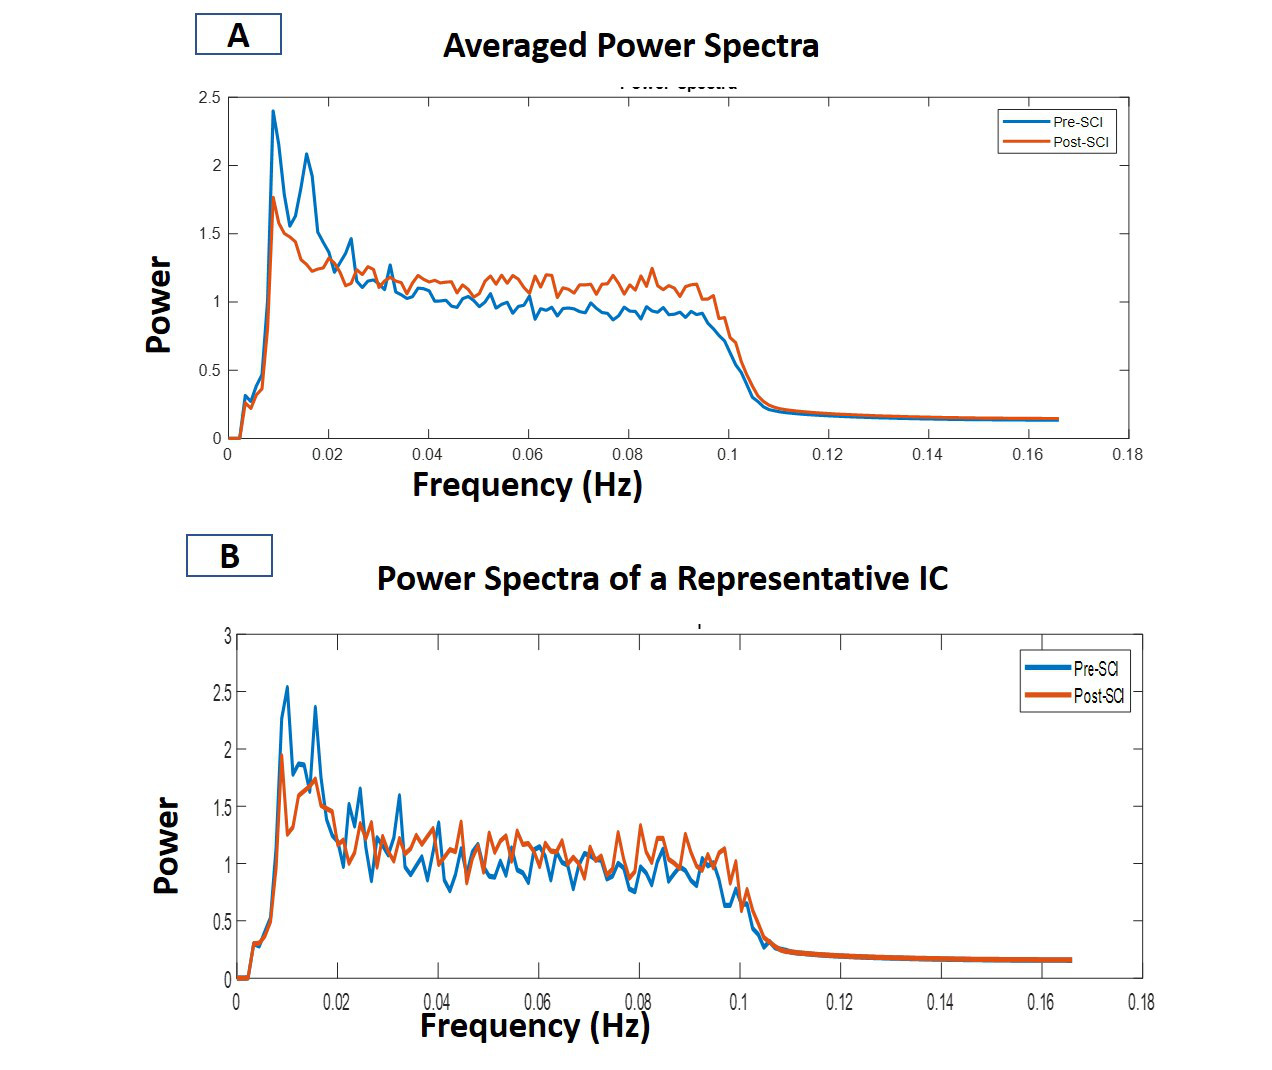
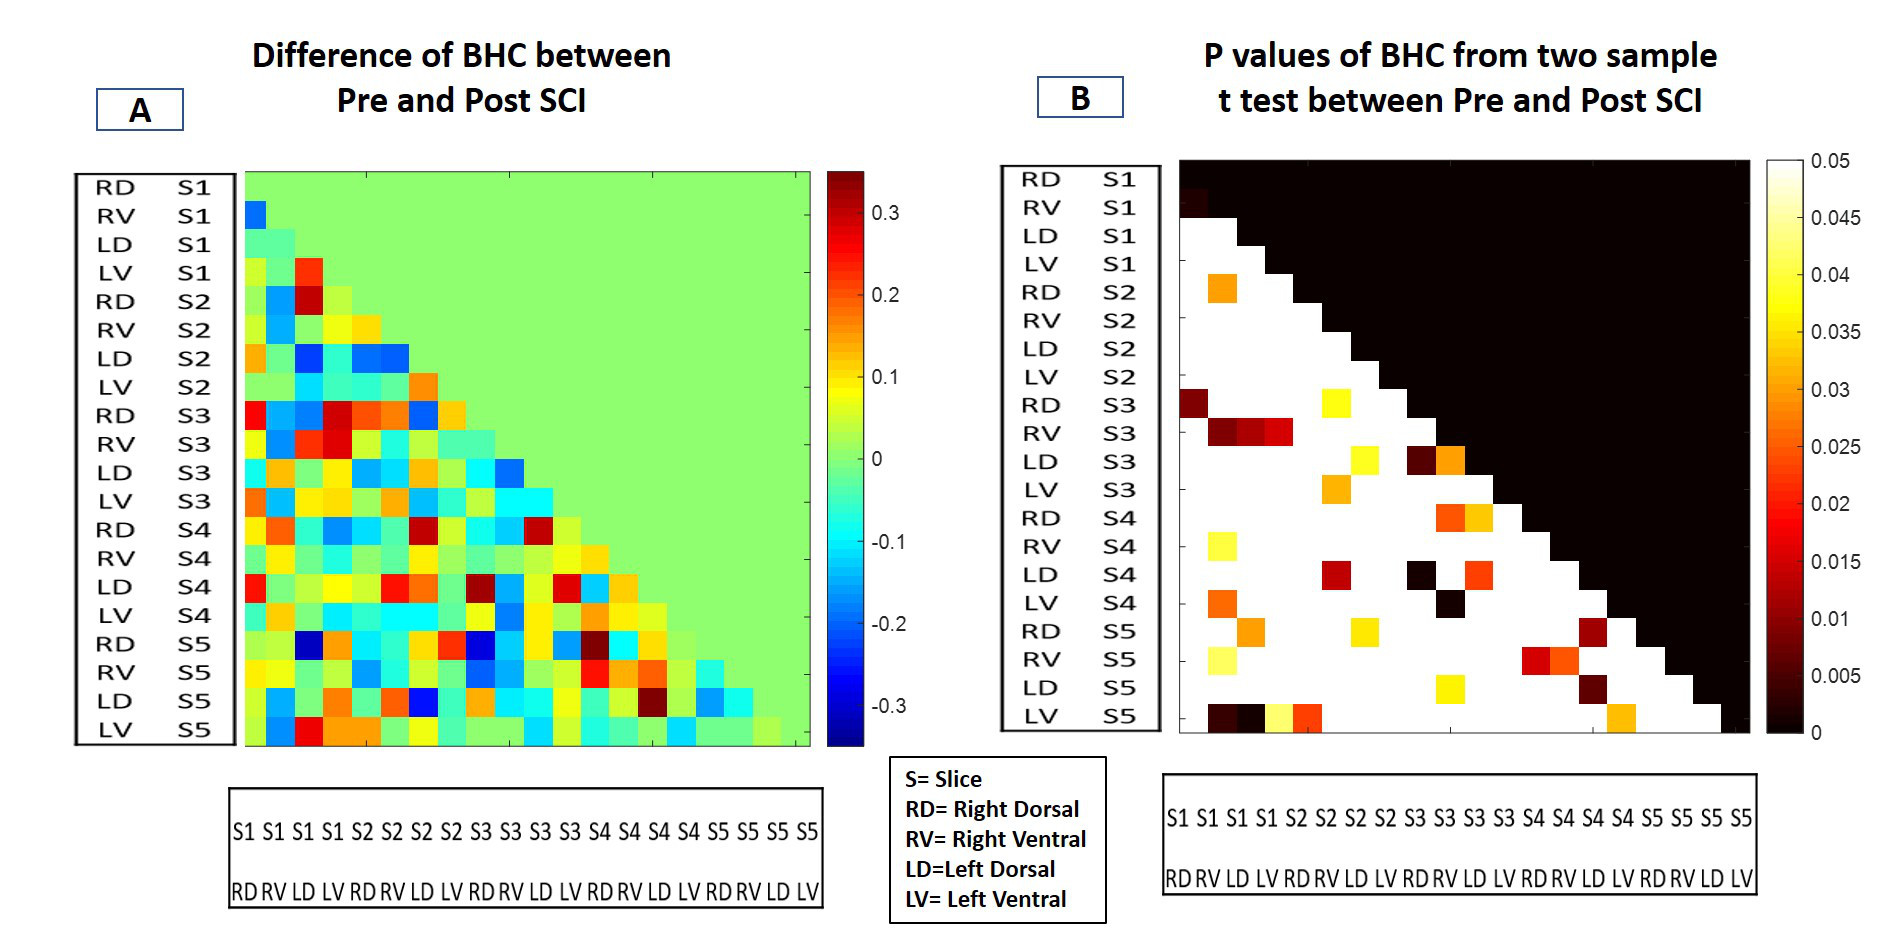
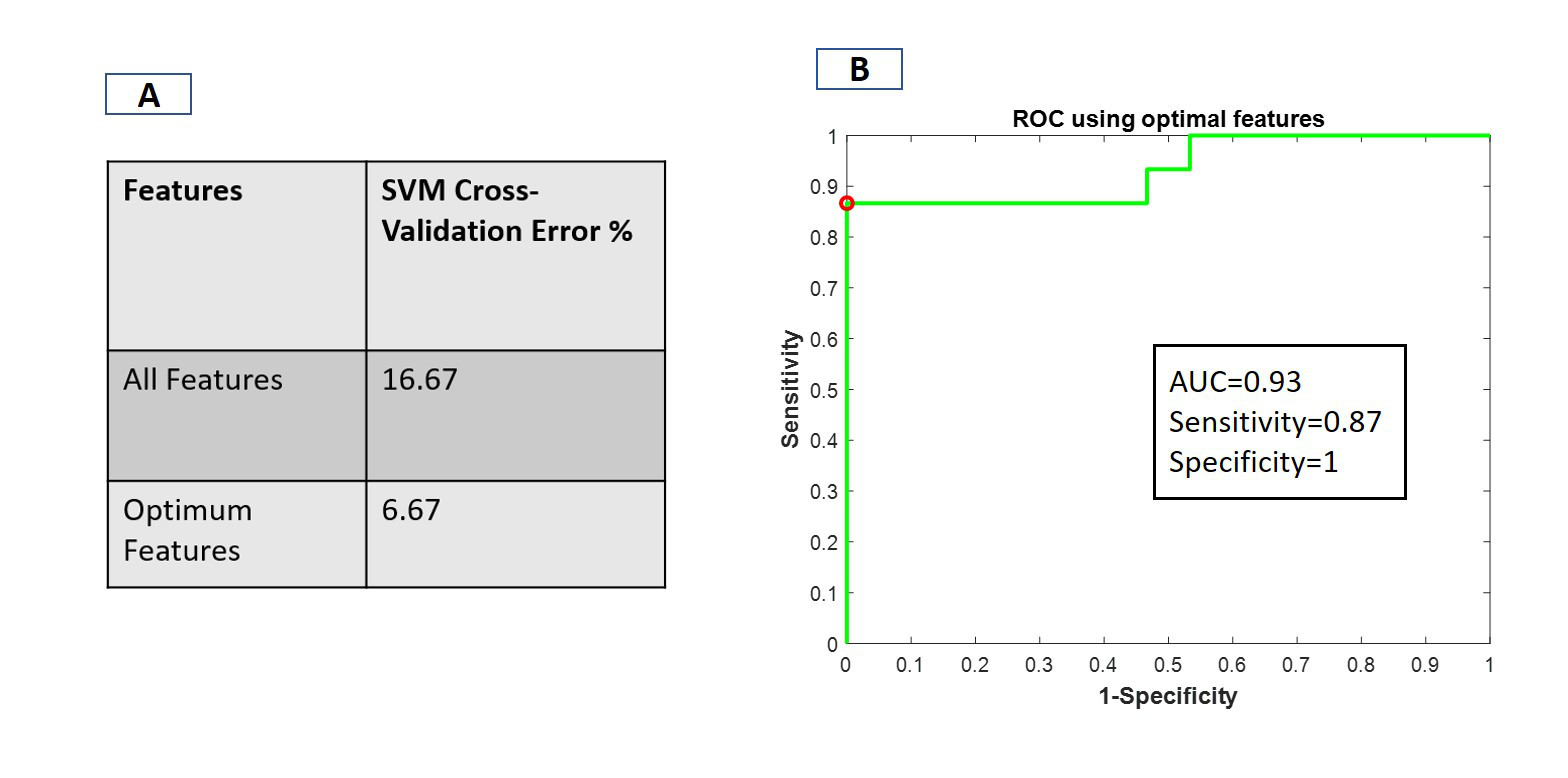
The spatial maps of the identified IC showed distinct local resting state networks within each dorsal and ventral horn with predominantly unilateral features (Fig.2). The rostro-caudal extension of all the networks was limited to the immediate spinal segment (one axial slice). WHC showed that the maximum power was in the 0.01-0.025 Hz range averaged over all the networks. There was a prominent decrease in the maximum power of WHC after injury for all the networks as seen from the averaged spectra and from a representative case (Fig.3). BHC showed that the correlations between IC pairs changed significantly (p <0.05) in many cases (31 pairs) post-injury (Fig.4). The SVM classifier could differentiate between the control and post-injury monkeys with an error of 6.67 % (2 misclassified out of 30 cases) using optimized feature set. ROC analysis for the SVM classifier results showed that an area under curve (AUC) of 0.93 was obtained with a sensitivity and specificity of 0.87 and 1 (Fig.5B). Also, feature selection using RF helped to reduce classification error (Fig.5A).DISCUSSION and CONCLUSION
This study supports previous reports of spatially distinct resting state dorsal and ventral functional networks in the SC of non-human primates3,4. The use of a gray-matter mask during pre-processing ensured that the observed resting state networks were not influenced by white matter signals. The use of a data driven model such as ICA does not use any prior assumptions about the locations of seed voxel which have been used in previous seed based approaches3,4. The results of the current study show that it is feasible to differentiate injured monkey SC from controls with high accuracy using the changes in connectivity measured by an SVM classifier. It remains to be established how reliably monkeys at different stages of injury can be differentiated using connectivity measures. In conclusion, resting state functional connectivity is a common organizational feature of the central nervous system and connectivity measures provide biomarkers of functional changes in SC which have high translational potential.Acknowledgements
This study is supported by the NIH grant NS092961 and the DOD grant SC160154.
References
1. Biswal, B., Zerrin Yetkin, F., Haughton, V. M. & Hyde, J. S. Functional connectivity in the motor cortex of resting human brain using echo-planar mri. Magn. Reson. Med. 34, 537–541 (1995).
2. Kong, Y. et al. Intrinsically organized resting state networks in the human spinal cord. Proc. Natl. Acad. Sci. 111, 18067–18072 (2014).
3. Wu, T. L. et al. Intrinsic functional architecture of the non-human primate spinal cord derived from fMRI and electrophysiology. Nat. Commun. 10, 1–10 (2019).
4. Chen, L. M., Mishra, A., Yang, P. F., Wang, F. & Gore, J. C. Injury alters intrinsic functional connectivity within the primate spinal cord. Proc. Natl. Acad. Sci. U. S. A. 112, 5991–5996 (2015).
5. McKeown, M. J. et al. Analysis of fMRI data by blind separation into independent spatial components. Hum. Brain Mapp. 6, 160–188 (1998).
6. Jenkinson, M., Bannister, P., Brady, M. & Smith, S. 2002, Jenkinson - head motion and FC.pdf. 841, 825–841 (2002).
7. Calhoun, V. D., Adali, T., Pearlson, G. D. & Pekar, J. J. Group ICA of Functional MRI Data: Separability, Stationarity, and Inference. Proc. ICA 2001 155–160 (2001).
8. Joel, S. E., Caffo, B. S., Van Zijl, P. C. M. & Pekar, J. J. On the relationship between seed-based and ICA-based measures of functional connectivity. Magn. Reson. Med. 66, 644–657 (2011).
9. Sengupta, A., Ramaniharan, A. K., Gupta, R. K., Agarwal, S. & Singh, A. Glioma Grading Using a Machine-Learning Framework Based on Optimized Features Obtained From T 1 Perfusion MRI and Volumes of Tumor Components. J. Magn. Reson. Imaging (2019).
Figures