1356
In Vivo Voltammetric Detection of Local Dopamine and Oxygen during Simultaneous BOLD fMRI1Center for Animal MRI, University of North Carolina at Chapel Hill, Chapel Hill, NC, United States, 2Biomedical Research Imaging Center, University of North Carolina at Chapel Hill, Chapel Hill, NC, United States, 3Department of Neurology, University of North Carolina at Chapel Hill, Chapel Hill, NC, United States, 4Department of Chemistry, University of North Carolina at Chapel Hill, Chapel Hill, NC, United States
Synopsis
fMRI interpretations based on traditional neurovascular coupling ignore the possible impact of vasoactive neurotransmitters released during brain activity. The striatum has atypical neurovascular coupling, and the highest concentrations of vasoactive dopamine. We evoked dopamine release in ventral striatum, and used simultaneous BOLD-fMRI and fast-scan cyclic voltammetry (FSCV) to observe global hemodynamics and quantify local dopamine and oxygen changes, respectively. Voltammetric oxygen correlated highly with BOLD, and increased linearly with local dopamine release, such that dopamine hemodynamic response functions could be derived. This multimodality explores hemodynamics at multiple spatiotemporal scales with the additional context of neurotransmission, which will improve fMRI interpretation.
Introduction
BOLD fMRI interpretation assumes vascular responses couple predictably with neuronal activity across the brain, despite the diversity of cell types and chemical messengers between brain regions. Studies show that neurovascular coupling is not always conserved1-3, suggesting that concurrent neurotransmitter release may also play a role. The striatum is a dopamine-rich brain area with atypical neurovascular coupling4-6, and though dopamine is known to be vasomodulatory7-8, its role in local hemodynamic changes is unclear. To study dopamine neurotransmission effects on striatal hemodynamics, we optimized multimodal BOLD fMRI and fast-scan cyclic voltammetry (FSCV) to simultaneously detect evoked dopamine release and oxygen changes at multiple spatiotemporal scales.Methods
FSCV was selected over other neurotransmitter-detecting techniques for its high spatiotemporal resolution, affordability, and chemical selectivity (Fig.1A). A modifiable voltage waveform applied to a carbon-fiber microelectrode oxidizes and/or reduces analytes, detected as changes in current (Fig.1B,C). Simultaneous FSCV/fMRI required optimizing both modalities to become cross-compatible. fMRI studies were performed using a Bruker 9.4T/30cm scanner and homemade RF-coil. FSCV data were obtained and analyzed with High-Definition Cyclic Voltammetry software and instrumentation9. FSCV microelectrodes were hand-fabricated using fused-silica/polyimide capillaries (Fig.2A)10, and scanned in 1.5% agarose gel phantoms to confirm MR compatibility (Fig.2B). In vivo dental acrylic headcaps were modified to accommodate fragile, MR-compatible, silver wire electrode connections (Fig.2C,D). Low-pass filters removed high-frequency gradient amplifier noise, and in vitro flow-through analysis of dopamine HCl in phosphate-buffered saline (pH=7.40) verified that filters did not deform signals (Fig.3A). The effect of each gradient on baseline noise was characterized at a 10MΩ resistor inside the bore (Fig.3B). To avoid EPI encoding artifacts (Fig.3D), TTL pulses were used to trigger per-slice MR data acquisitions after each FSCV waveform, interleaving FSCV and fMRI data (Fig.3E). For in vivo experiments, a twisted tungsten stimulating electrode was implanted in the ventral tegmental area (VTA) to evoke oxygen changes in the nucleus accumbens (NAc). An FSCV microelectrode and Ag/AgCl reference were implanted in the ipsilateral NAc and contralateral cerebellum, respectively (Fig.4A). Subjects were scanned within 1 week of electrode implantation, requiring endotracheal intubation under 0.5% isoflurane and intraperitoneal dexmedetomidine (0.05mg/kg/hr) and pancuronium (0.5mg/kg/hr) sedation. Stimulations (300-900µA, 2s at 60Hz, pulse width=1ms) were repeated using both oxygen- and dopamine-sensitive waveforms at the microelectrode (0 to +0.8V, to –1.4V, then back to 0V at 400V/s, then ‑0.4 to +1.3V, and back to -0.4V, Fig.1C)11. BOLD fMRI was acquired simultaneously (TR/TE=1000/15ms, matrix=80x80, FOV=2.56cm2, slices=5x1mm). Oxygen challenges were performed in triplicate by ventilating the subject with 100% medical air for 60s, then changing to 100% oxygen for 60s. Principal component analysis extracted FSCV analyte currents. Correlation plots were derived from FSCV oxygen time-courses, using significantly correlated fMRI time-courses from voxels nearest the microelectrode location (15-27 voxel averages). Significance was determined using a p<0.001 threshold.Results and Discussion
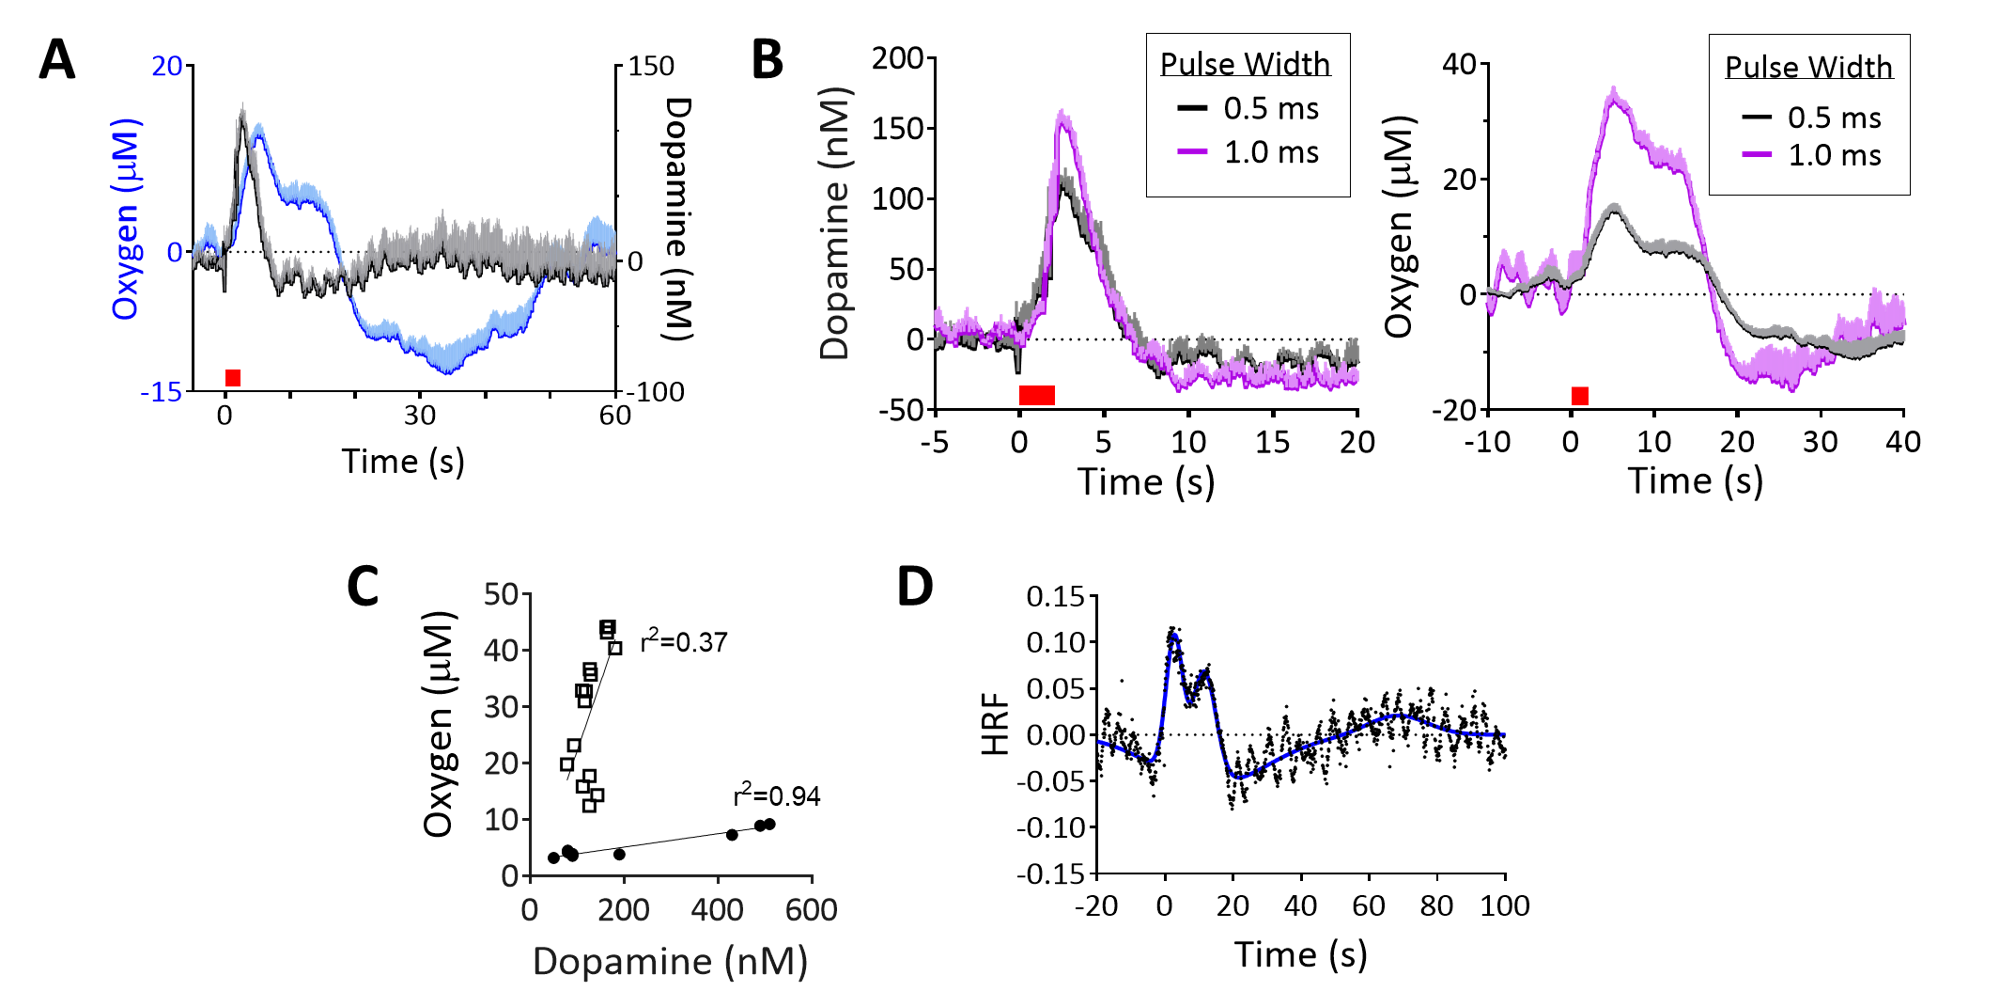
Electrical VTA stimulations evoked oxygen increases in NAc, detected with simultaneous FSCV/fMRI at different spatiotemporal scales (Fig.4A,B). FSCV had higher signal-to-noise than a single voxel BOLD (p<0.001, unpaired t-test, Fig.4B,C). FSCV data collected at 10Hz was decimated for 1Hz fMRI time-course comparisons (Fig.4D). The simultaneously-acquired time-courses per stimulation were averaged and found to highly correlate between modalities (Fig.4D). Significant correlations to FSCV time-courses were found in the ipsilateral NAc, contralateral cortex, and forebrain (Fig.4E). These data show that BOLD fMRI and FSCV are complementary methods of detecting local and whole-brain hemodynamic responses. We also examined whether evoked FSCV oxygen correlates with BOLD fMRI using the same stimulation parameters, but under separate sessions (Fig.4D; Stim#2). Time-shift analyses revealed that fMRI responses correlated most highly with FSCV when the latter shifted +1s (Fig.4D), reflecting slight differences in evoked oxygen dynamics that are likely due to a spatial sampling mismatch (Fig. 4B). The reliable correlations between FSCV oxygen and BOLD fMRI means that stimulations can be repeated with other FSCV waveforms in the same experiment; fMRI still collects highly-correlative hemodynamic information during cases where FSCV waveforms may be insensitive to it (e.g., dopamine-sensitive waveform, Fig.1C). To investigate the relationship between BOLD and FSCV oxygen without using electrical stimulations, an oxygen-breathing challenge was performed. 100% oxygen evoked large oxygen increases throughout the brain, correlating highly with simultaneously-acquired FSCV oxygen (Fig. 4F,G). Interestingly, these data correlated highest when the FSCV time-course shifted 4s forwards, indicating a lag in the BOLD response (Fig.4H). Electrical VTA stimulation evoked dopamine release in the NAc, allowing us to detect dopamine and simultaneous BOLD. Dopamine release preceded the hemodynamic response and returned to baseline (Fig.5A). Increasing stimulation parameters increased amplitudes of both evoked dopamine release and oxygen responses (Fig.5B). We used graded stimulation to examine the relationship between maximal evoked dopamine and oxygen increases, which were linear within subjects in agreement with existing literature (Fig.5C)12. Using the highly linear data as training sets, we derived dopamine hemodynamic response functions (DA-HRF), which serve as transfer functions between dopamine and oxygen responses under physiological conditions and provide information about neurotransmitter-related neurovascular coupling (Fig.5D).Conclusion
Hemodynamic changes measured by FSCV/fMRI highly correlate across disparate spatiotemporal resolutions. FSCV measures high-resolution oxygen changes and dopamine release, which linearly relate and can be used to derive DA-HRFs. This multimodal platform can be used uniquely to identify the contribution of neurotransmitter release to BOLD signals.Acknowledgements
We thank UNC CAMRI members for their helpful discussions and critiques. This project is funded by F32 MH115439-01 as part of the BRAIN Initiative, and supported in part by NIH grants RF1MH117053, R01MH111429, R01NS091236, P60AA011605, and U54HD079124.References
1) Hillman EM. Coupling mechanism and significance of the BOLD signal: a status report. Annu. Rev. Neurosci. 2014; 37: 161-181.
2) Thompson JK, Peterson MR, Freeman RD. Single-neuron activity and tissue oxygenation in the cerebral cortex. Science 2003; 299: 1070-1072.
3) O’Herron P, Chhatbar PY, Levy M, Shen Z, Schramm AE, Lu Z et al. Neural correlates of single-vessel haemodynamic responses in vivo. Nature 2016; 534: 378-382.
4) Van Den Berge N, Albaugh DL, Salzwedel A, Vanhove C, Van Holen R, Gao W et al. Functional circuit mapping of striatal output nuclei using simultaneous deep brain stimulation and fMRI. NeuroImage 2016; 146: 1050-1061.
5) Shih Y-YI, Huang S, Chen Y-Y, Lai H-Y, Kao Y-CJ, Du F et al. Imaging neurovascular function and functional recovery after stroke in the rat striatum using forepaw stimulation. J Cereb Blood Flow & Metab 2014; 34: 1483-1492.
6) Shih YY, Wey HY, De La Garza BH, Duong TQ. Striatal and cortical BOLD, blood flow, blood volume, oxygen consumption, and glucose consumption changes in noxious forepaw electrical stimulation. J. Cereb. Blood Flow Metab. 2011; 31: 832-41.
7) Krimer LS, Muly EC, Williams GV, Goldman-Rakic PS. Dopaminergic regulation of cerebral cortical microcirculation. Nat. Neurosci. 1998; 1: 286-289.
8) Choi J-K, Chen YI, Hamel E, Jenkins BG. Brain hemodynamic changes mediated by dopamine receptors: role of the cerebral microvasculature in dopamine-mediated neurovascular coupling. NeuroImage 2006; 30: 700-712.
9) Bucher ES, Brooks K, Verber MD, Keithley RB, Owesson-White C, Carroll S, Takmakov P, McKinney CJ, Wightman RM. Flexible software platform for fast-scan cyclic voltammetry data acquisition and analysis. Anal Chem 2013; 85: 10344-53.
10) Phillips PEM, Robinson DL, Stuber GD, Carelli RM, Wightman RM. Real-time measurements of phasic changes in extracellular dopamine concentration in freely moving rats by fast-scan cyclic voltammetry. Methods Mol Med 2003; 79: 443-464.
11) Zimmerman J, Wightman RM. Simultaneous electrochemical measurements of oxygen and dopamine in vivo. Anal Chem 1991; 63: 24-28.
12) Venton J, Michael D, Wightman RM. Correlation of local changes in extracellular oxygen and pH that accompany dopaminergic terminal activity in the rat caudate putamen. J Neurochem 2003; 84: 373-381.
Figures
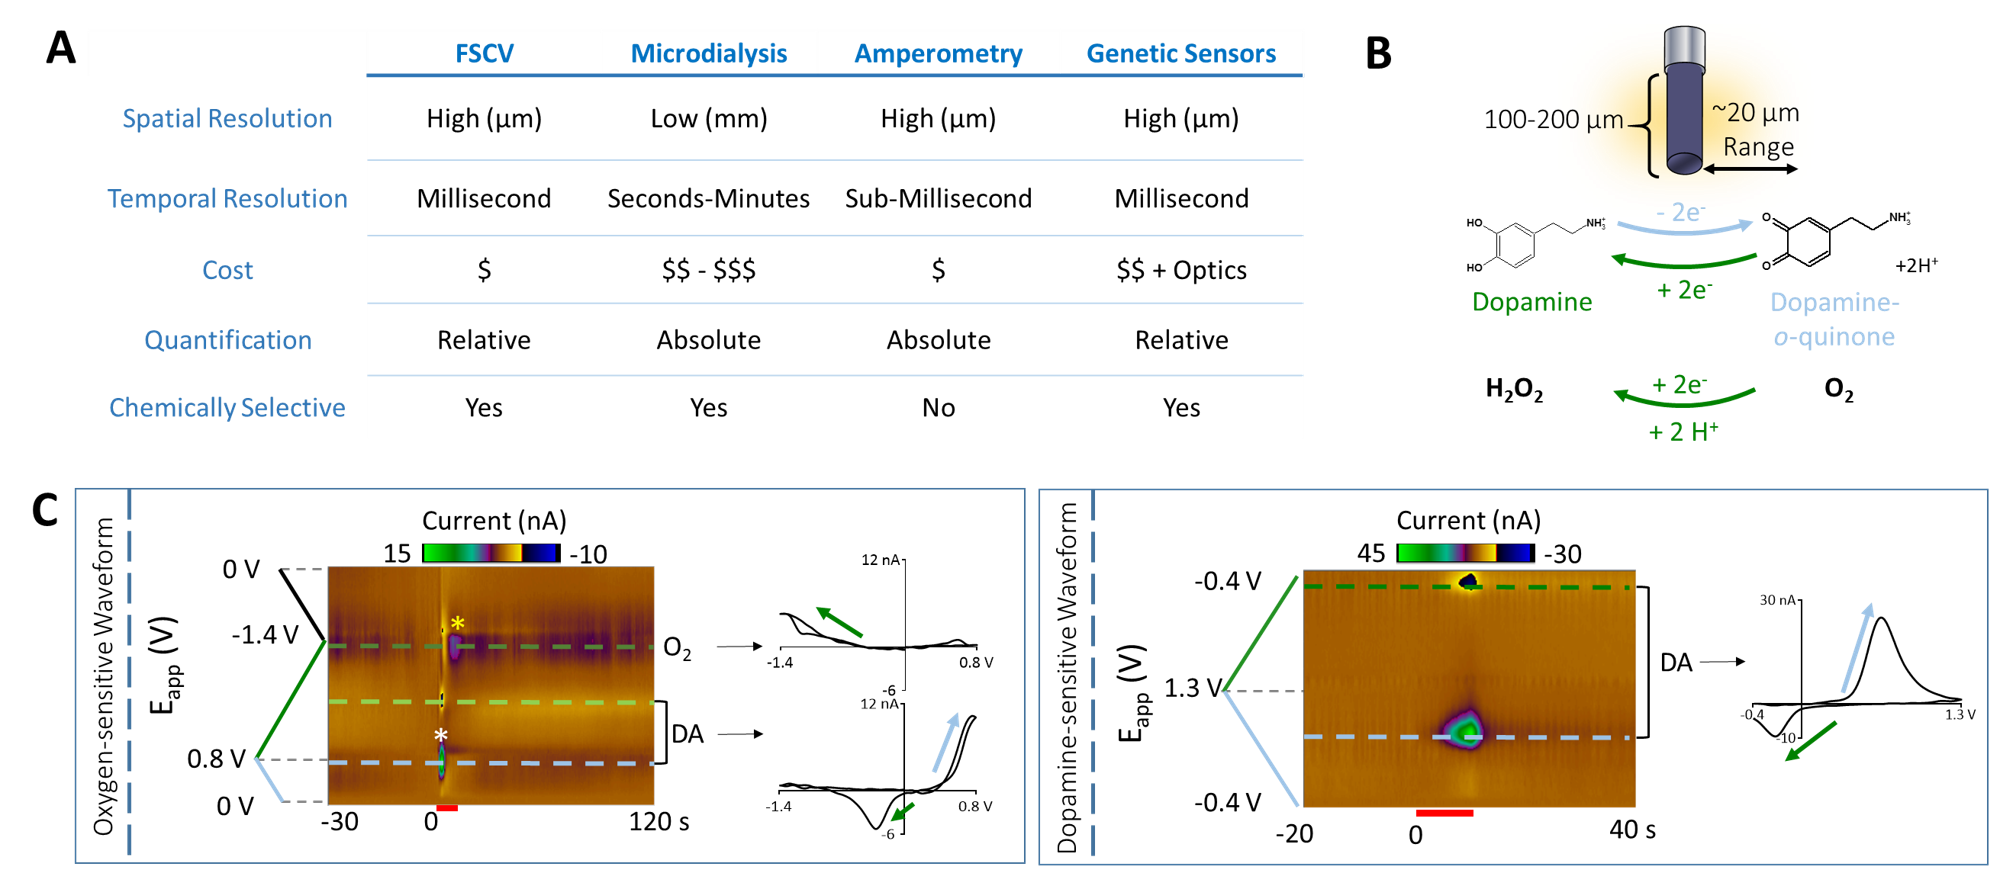
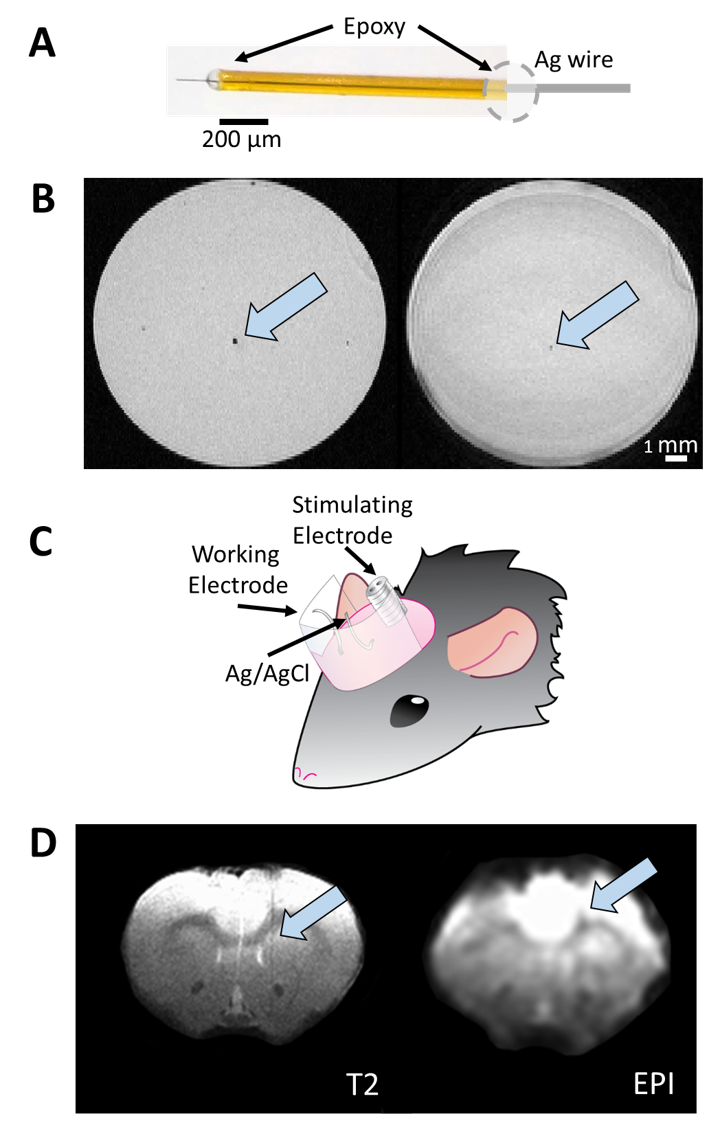
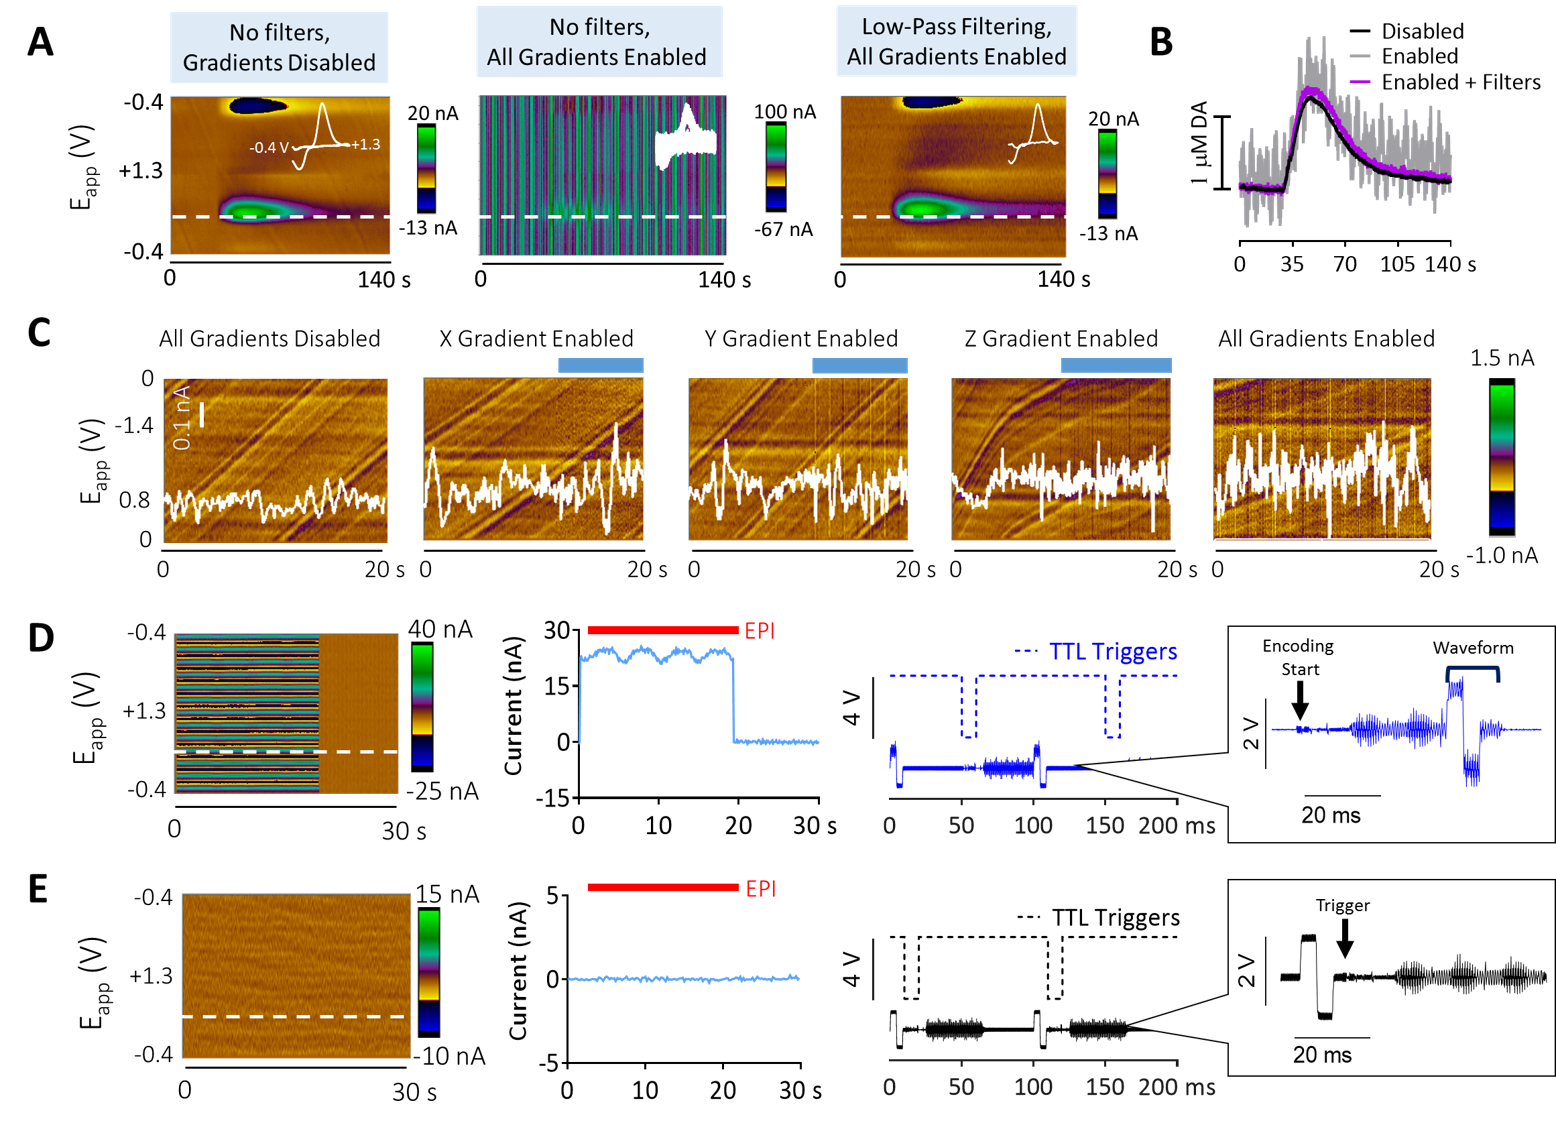
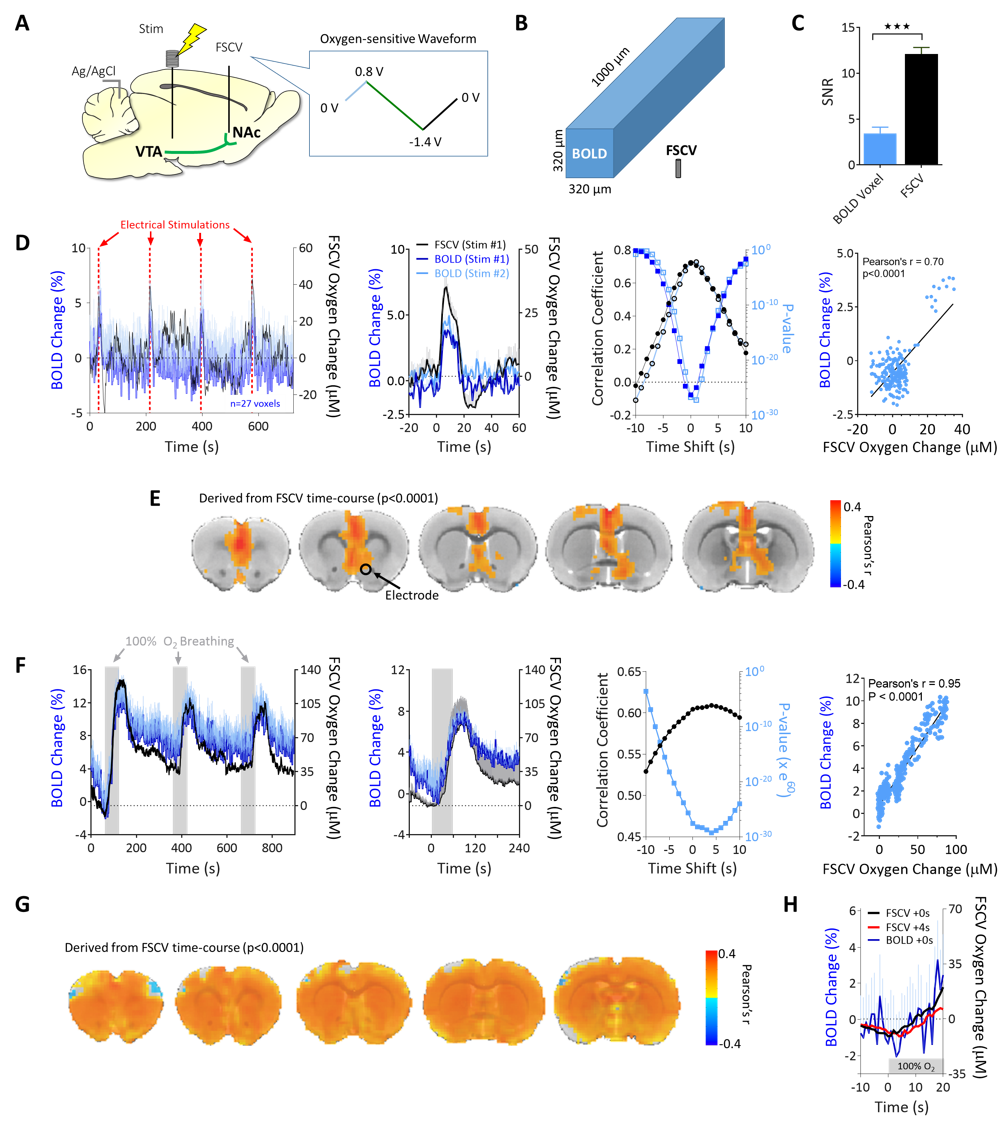
Fig.4 In
vivo FSCV/fMRI. A) Experimental schematic.
B) To-scale detection volumes. C) SNR comparisons (unpaired t-test,
p<0.0001, n=4). D) Left to right: Full
electrical stimulation FSCV/fMRI time-courses, averages, and temporal and
amplitude correlations. E)
Correlation maps derived from FSCV time-course D. F) Left to right: Full FSCV/fMRI oxygen inhalation time-courses,
averages, and temporal and amplitude correlations. G) Correlation maps derived from FSCV time-course F. H) Close-up of the first oxygen
inhalation epoch with FSCV shifted +4s (i.e., maximal correlate).