1355
Layer-specific optogenetic stimulation of motor cortex activates distinct brain-wide networks1Neurology and Neurological Sciences, Stanford University, Stanford, CA, United States, 2Molecular and Cellular Physiology, Stanford University, Stanford, CA, United States, 3Helen Wills Neuroscience Institute, University of California, Berkeley, CA, United States, 4Bioengineering, Stanford University, Stanford, CA, United States, 5Neurosurgery, Stanford University, Stanford, CA, United States, 6Electrical Engineering, Stanford University, Stanford, CA, United States
Synopsis
The primary motor cortex (M1) consists of a stack of interconnected but distinct layers. However, knowledge of brain-wide circuit function of M1 layer-specific pathways is lacking. Here, we combined layer-specific Cre-driver mice, optogenetics, and fMRI with subsequent electrophysiological recordings to reveal distinct M1 layer-specific networks. All L2/3, L4, L5 and L6 stimulations evoked M1 fMRI responses, while only L5 and L6 evoked robust caudate putamen and ventrolateral thalamic nucleus responses. Subsequent LFP and spike recordings were in line with these fMRI results. Overall, our techniques and results could help investigate brain-wide layer-specific cortical circuit functions in development, aging and diseases.
INTRODUCTION
Despite the seemingly well-defined structural input and output projections of different cortical layers1-3, the brain-wide functional influences of primary motor cortex (M1) layer-specific pathways have yet to be elucidated at the whole-brain scale. Historically, it has been difficult to disentangle the functional properties of each layer since they are highly anatomically intermingled. Recent advancements in molecular genetics have made it possible to selectively stimulate L2/3, L4, L5 and L6 of the neocortex4-7 using Cre-recombinase driver lines and optogenetic tools. However, there is no direct evidence for differential effects of M1 layer-specific pathways on brain-wide circuit function, especially in the macroscopic and mesoscopic scale. Here, we applied optogenetic fMRI (ofMRI) to reveal the causal influences of each layer of M1 on activity across the whole brain, including M1, ventrolateral thalamus (VL), and caudate putamen (CPu). Subsequently, we characterized these downstream activities using in vivo electrophysiology to delineate the neuronal underpinnings of these fMRI responses.METHODS AND MATERIALS
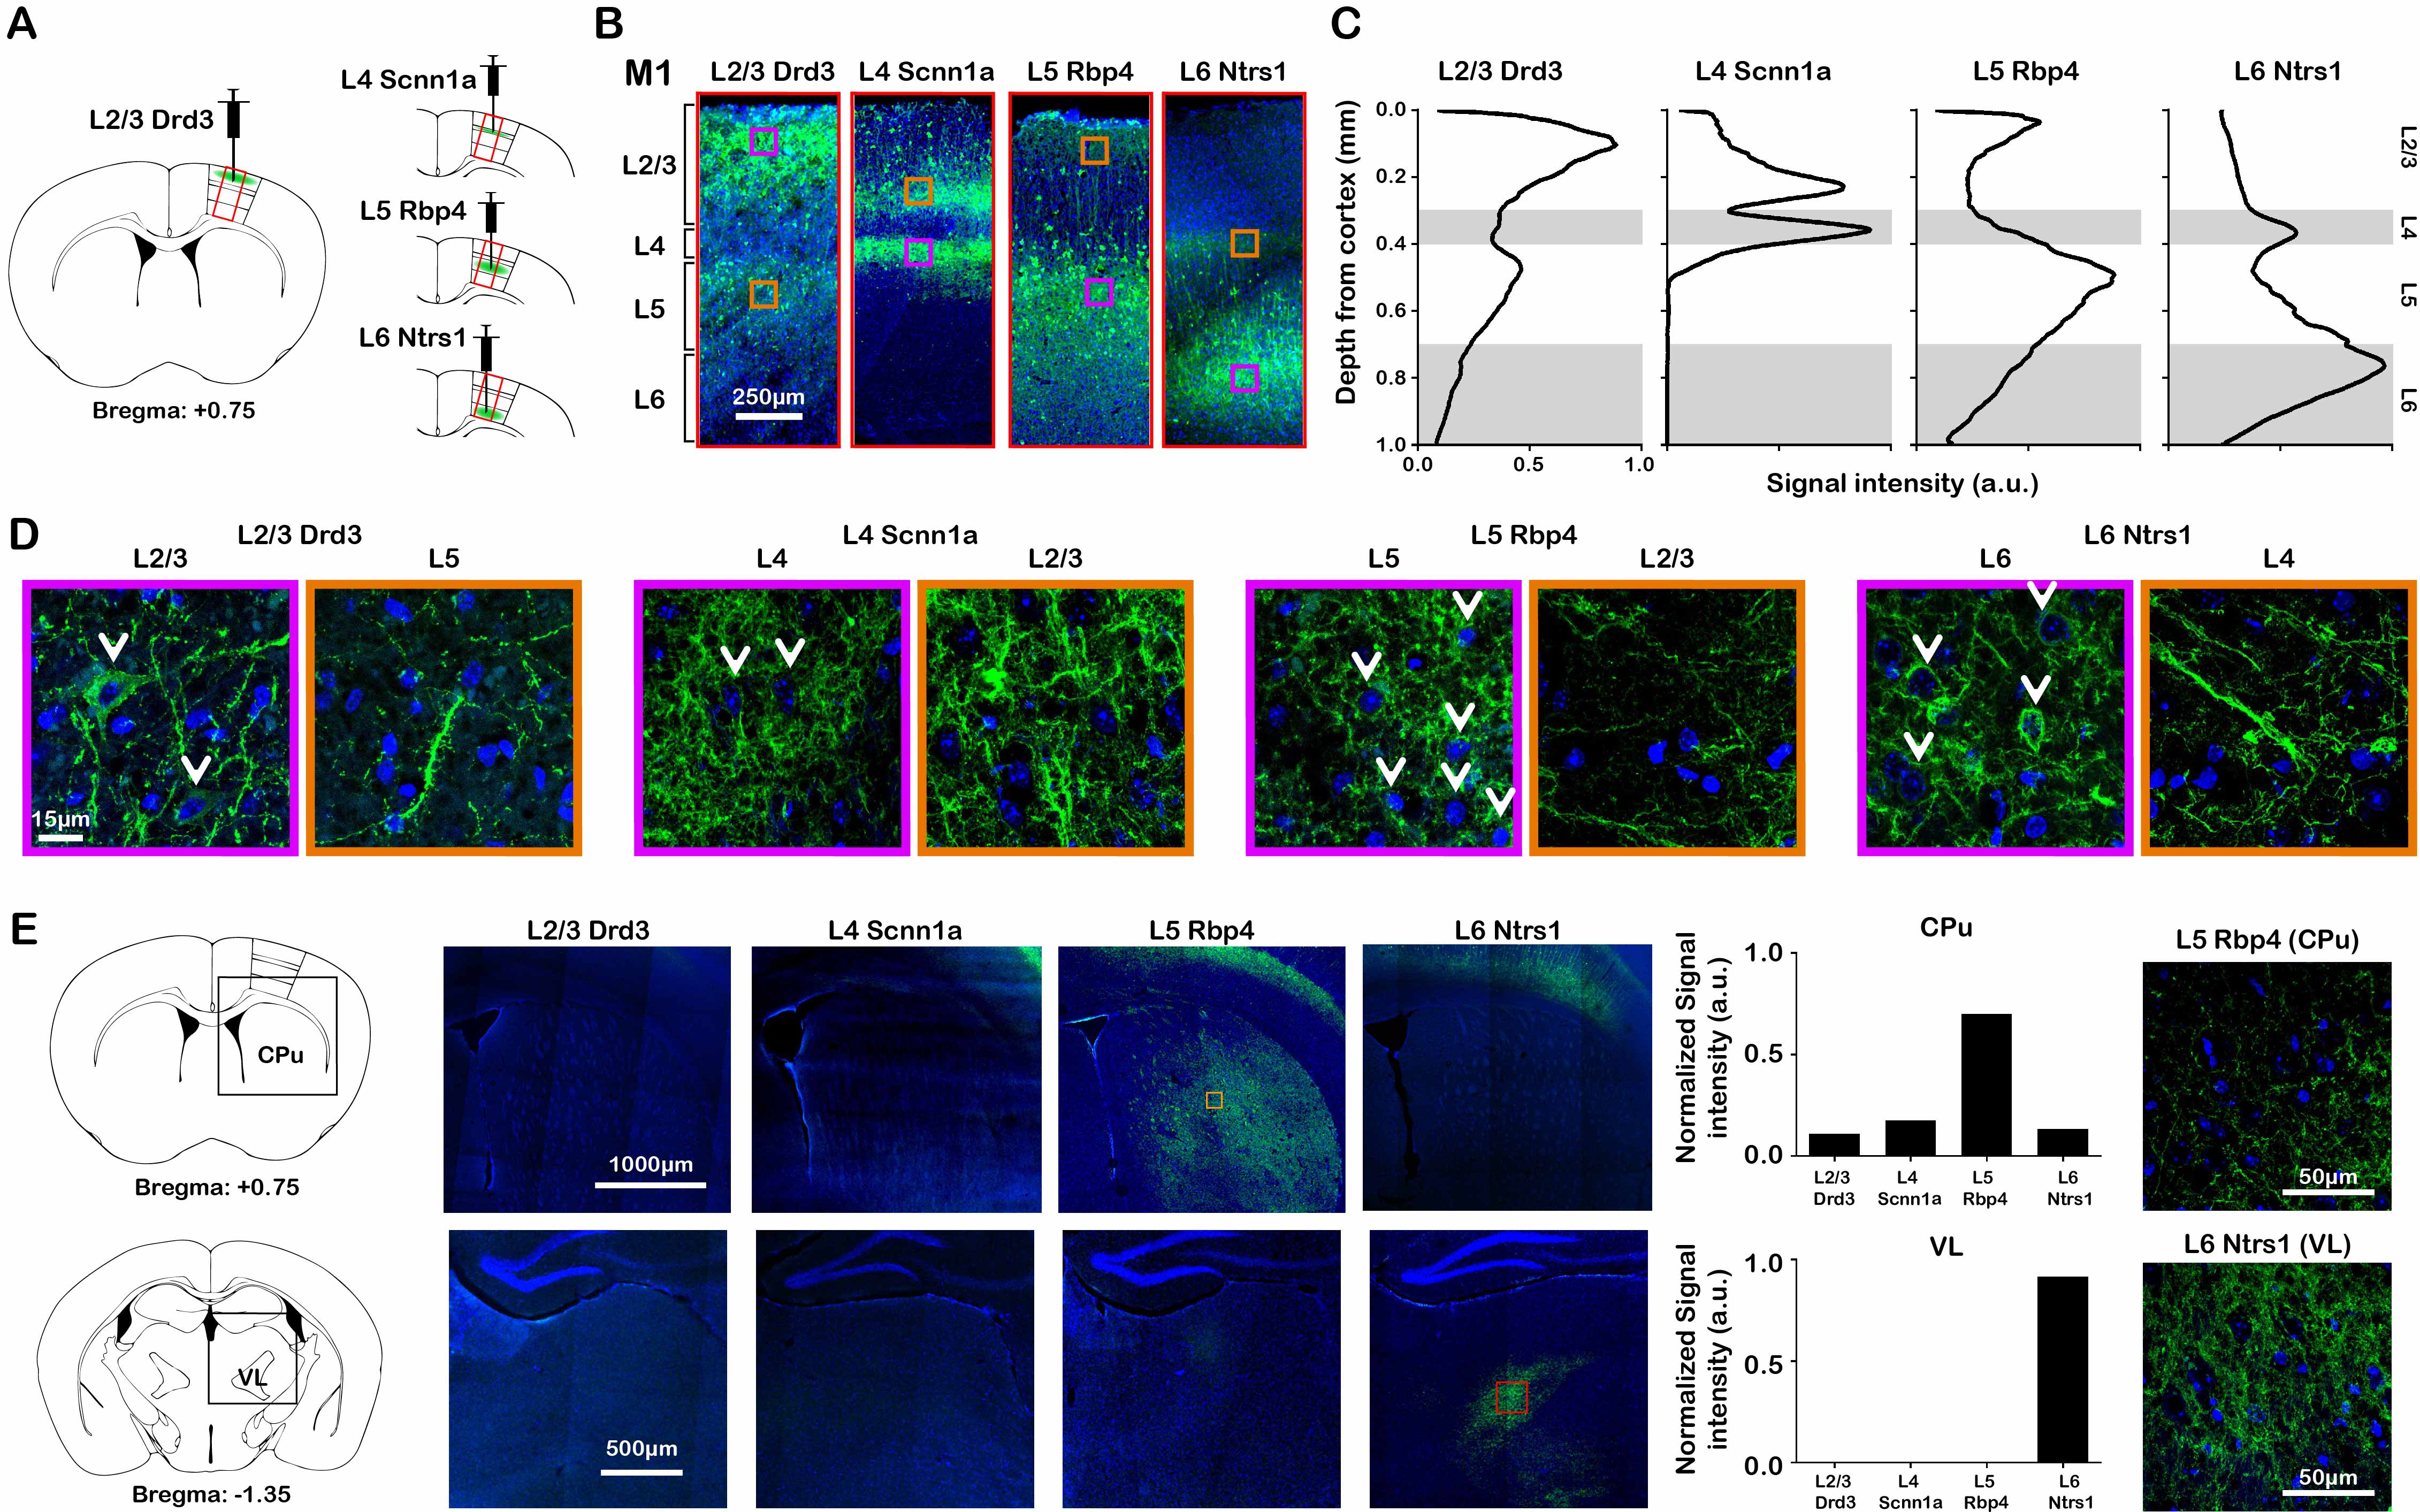
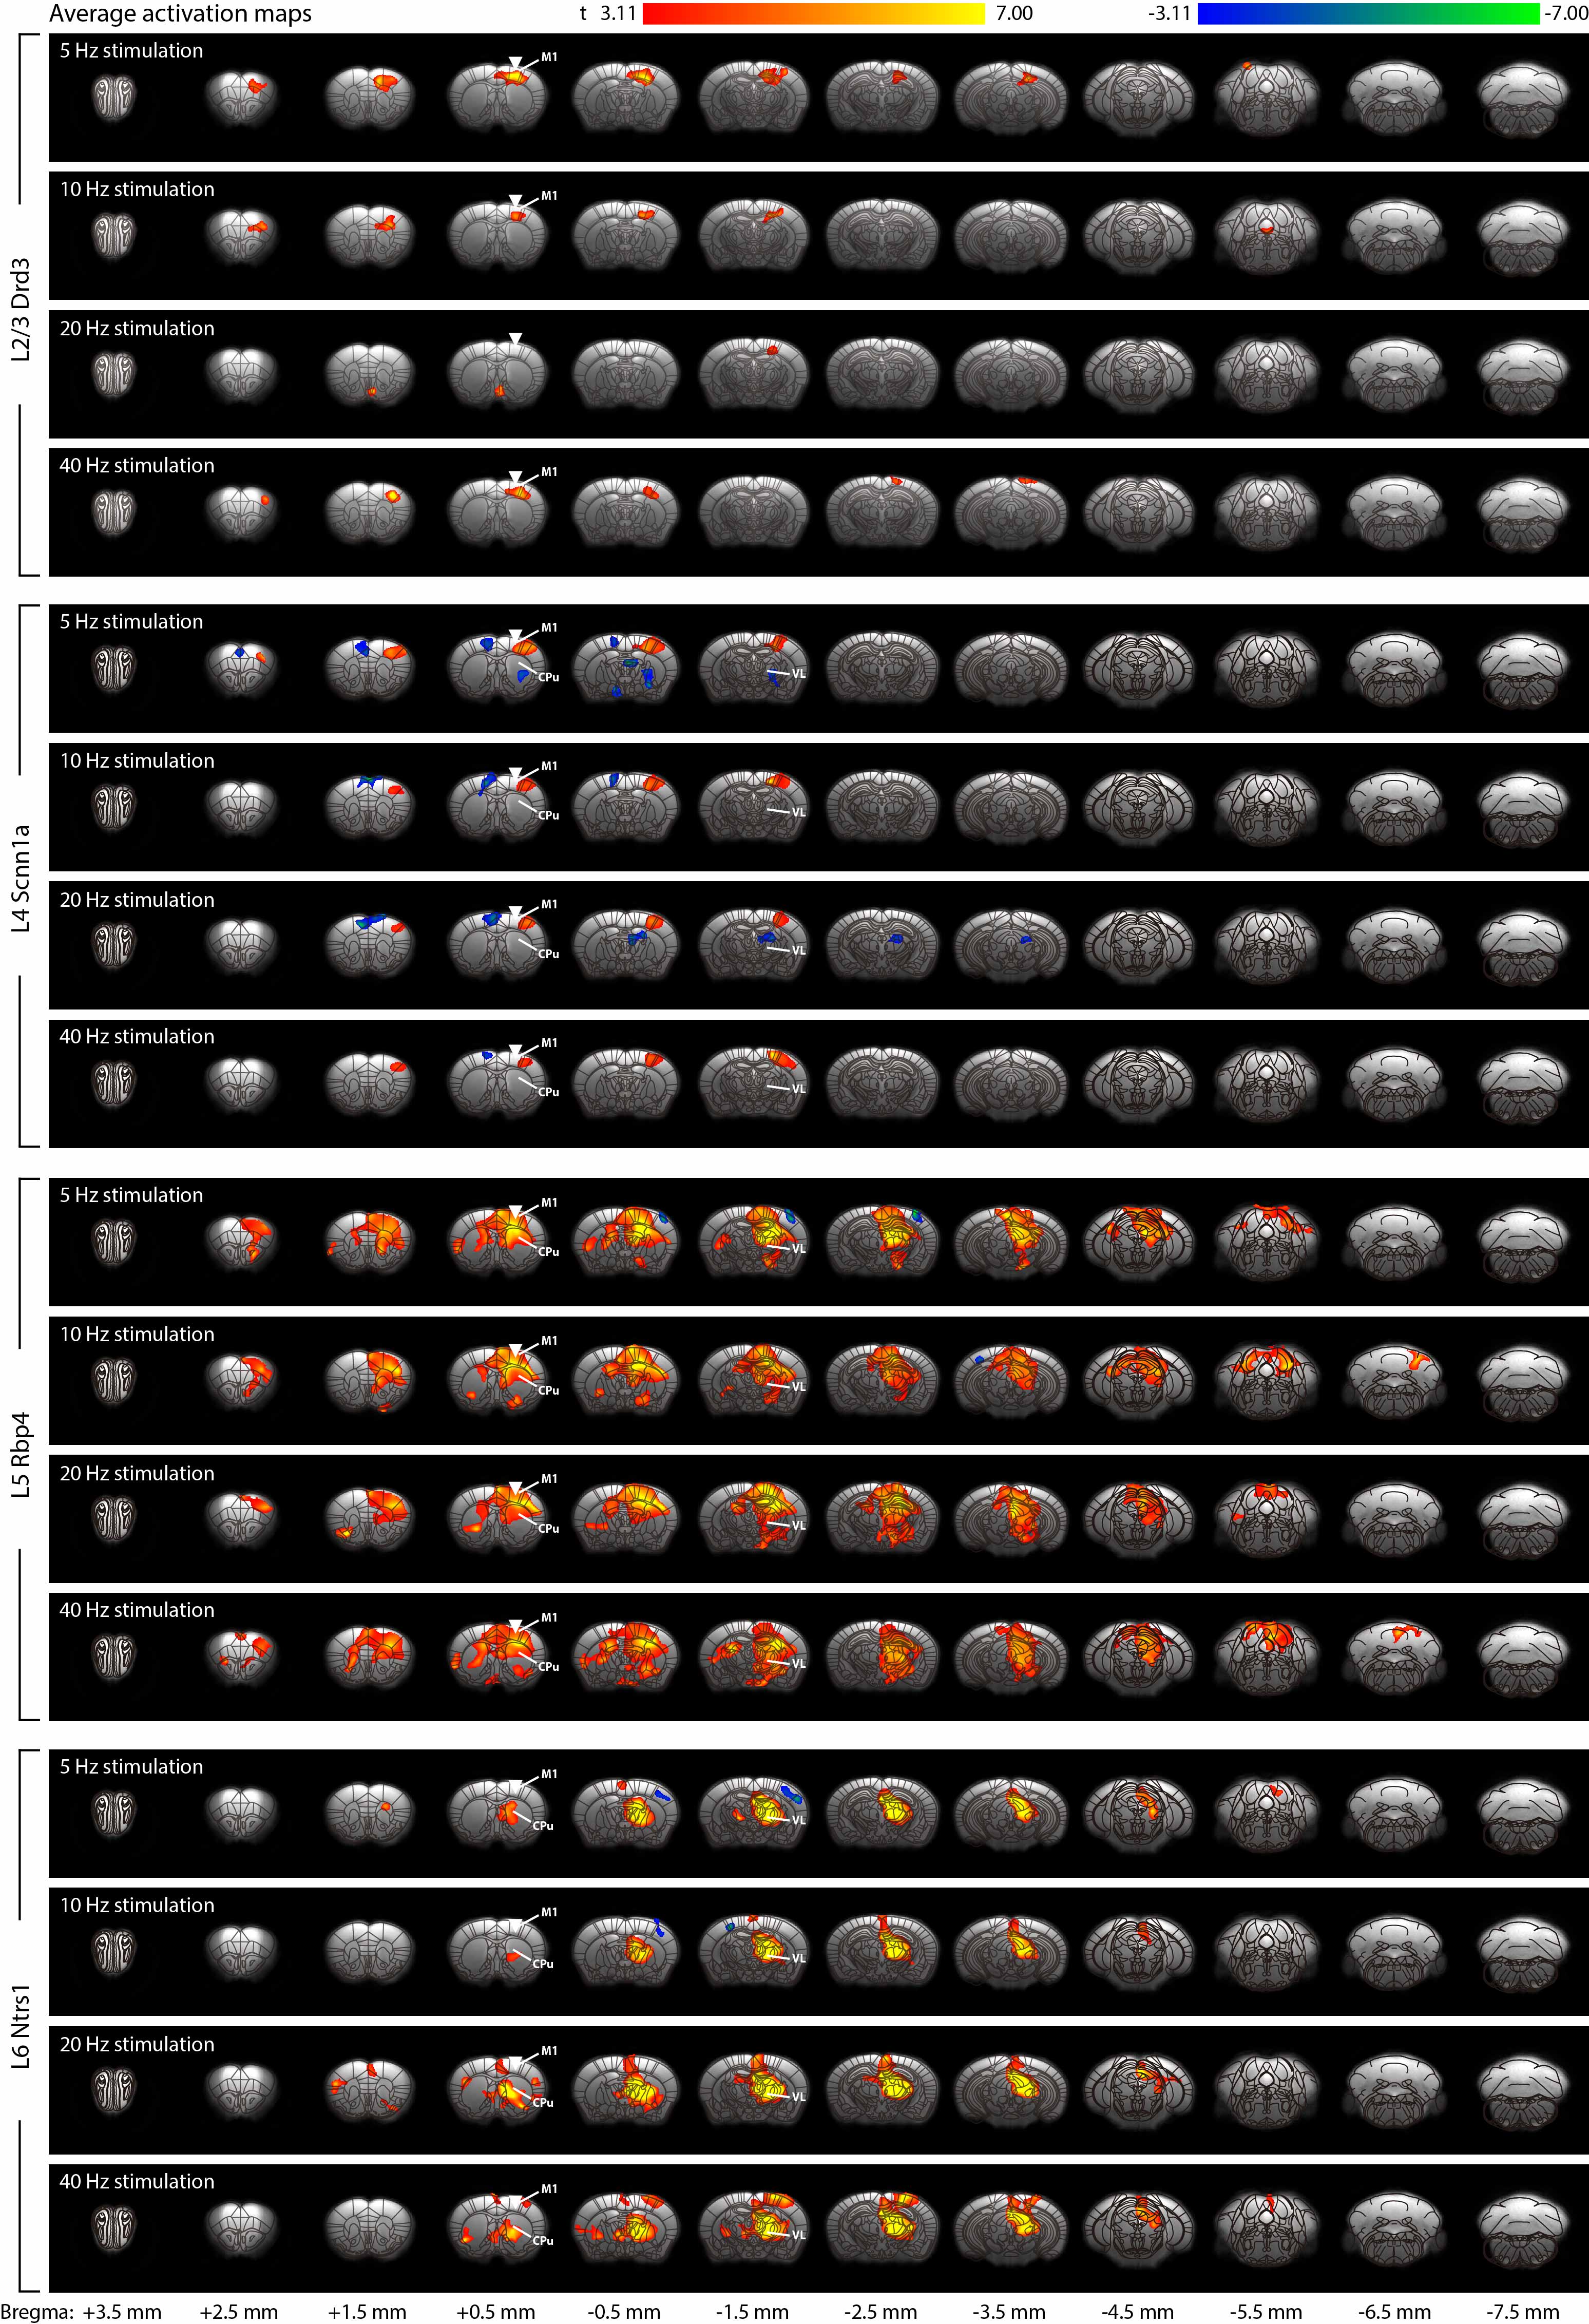
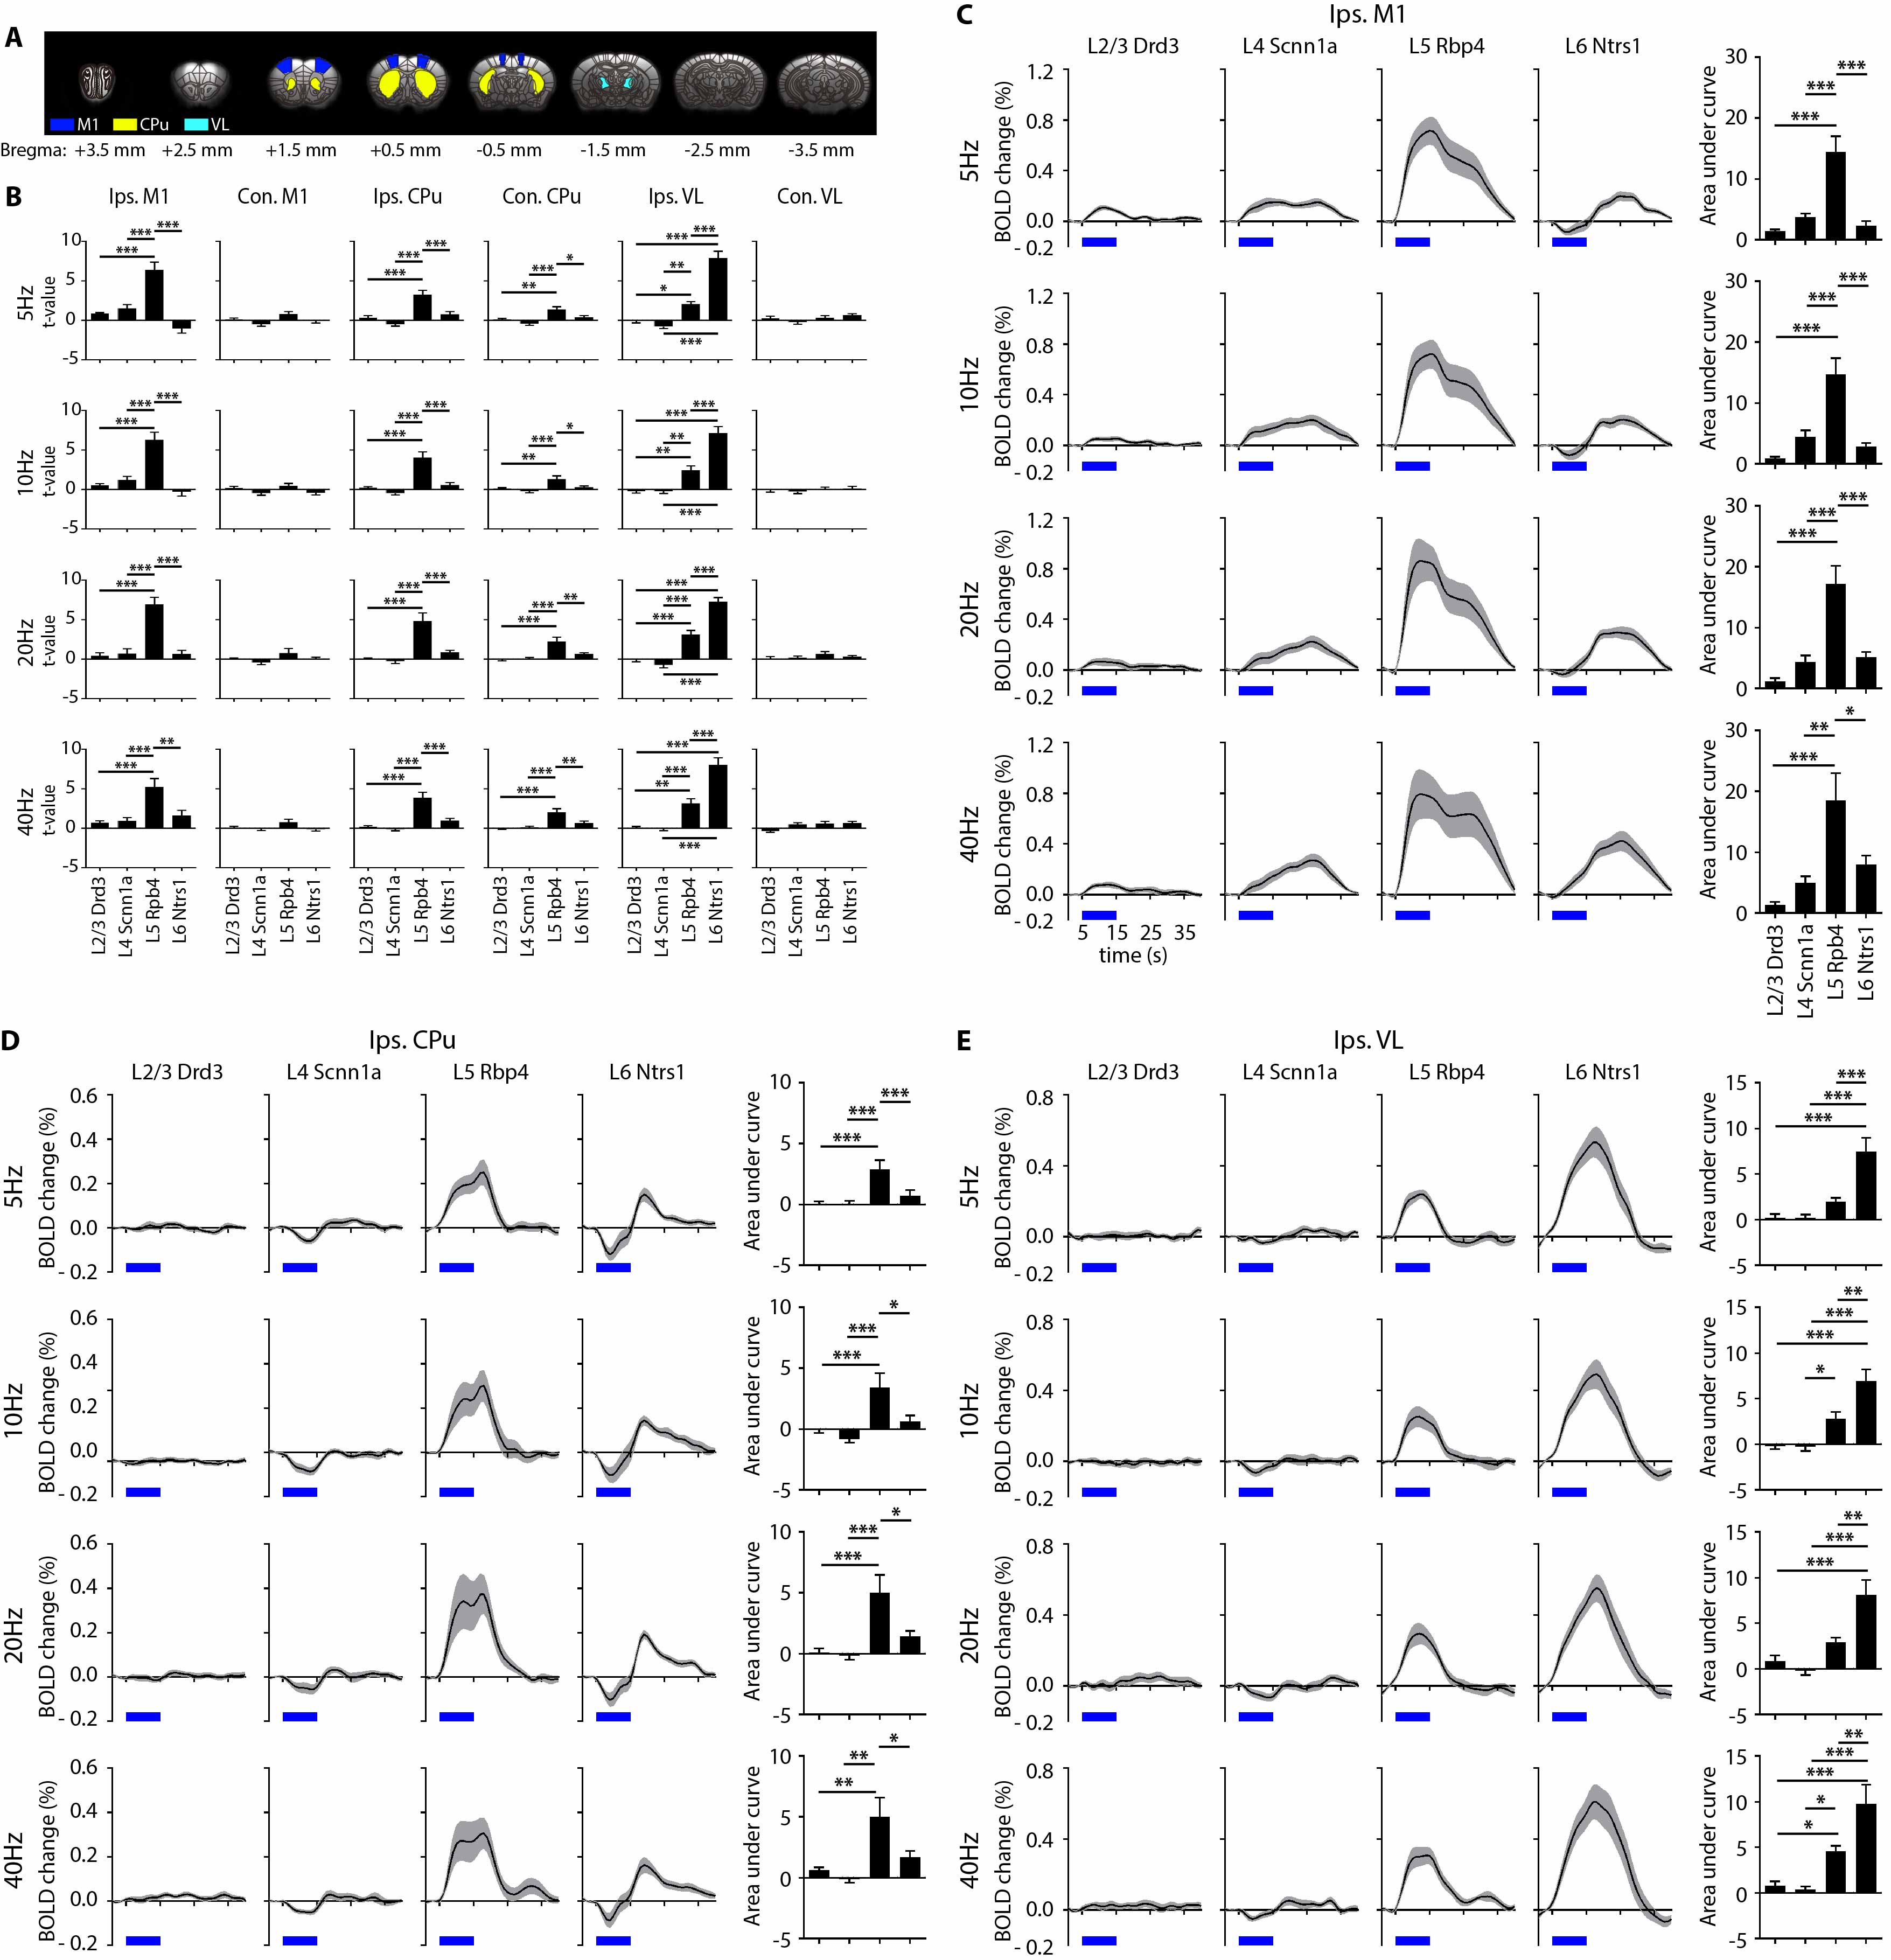
To selectively activate L2/3, L4, L5 and L6 of M1, we used mice expressing Cre-recombinase under control of Drd3, Scnn1a, Rpb4 and Nstr1 receptor elements, respectively. An AAV5 virus was injected to express the ChR2-EYFP opsin in Cre-positive neurons to enable selective layer-specific optogenetic control of M1. We performed ofMRI in lightly anesthetized mice with optical pulses delivered at 5 Hz, 10 Hz, 20 Hz or 40 Hz (30% pulse width duty cycle; light intensity, 30-50 mW/mm2).RESULTS AND DISCUSSION
Histological and immunohistochemical examination confirmed ChR2 expression
ChR2-EYFP was localized to the neurons in their respective layers and their intra-cortical projections (Figure 1A – D). Specifically, ChR2-EYFP expression was observed in L2/3 M1 neurons and L5 projections for the Drd3 L2/3 Cre-line, in L4 M1 neurons and L2/3 projections for the Scnn1a L4 Cre-line, in L5 M1 neurons and L2/3 projections for the Rbp4 L5 Cre-line, and in L6 M1 neurons and L4 projections for the Ntrs1 L6 Cre-line.Layer-specific M1 stimulation activated distinct brain-wide networks
fMRI activation maps and blood oxygen level dependent (BOLD) signal profiles showed that layer-specific and frequency-specific M1 stimulations activated distinct brain-wide networks (Figure 2 and 3). L2/3 stimulation activated only M1. L4 stimulation activated M1, with small amplitudes of negative BOLD responses observed in the CPu and VL. L5 stimulation evoked robust activation of M1, CPu and VL. Last, L6 stimulation evoked robust VL activation, as well as M1 and CPu responses. Interestingly, the BOLD signal profile in the ipsilateral M1 transitioned from negative to positive between 5 Hz and 10 Hz L6 stimulations, but not between 20 Hz and 40 Hz stimulations (Figure 3). Similarly, the BOLD signal profile in the ipsilateral CPu transitioned from negative to positive during L6 stimulations.To compare and quantify the response patterns, we extracted the t-values using the same anatomically defined ROIs and calculated the area under the BOLD profiles. L5 stimulations evoked the strongest ipsilateral M1 and bilateral CPu activations (Figure 3). On the other hand, L6 stimulations evoked the strongest ipsilateral VL activations, while L5 stimulations evoked significantly stronger activations than L2/3 and L4 stimulations (Figure 3). Since the CPu and VL displayed robust activations during L5 and L6 stimulations, respectively, histological and immunohistochemical results of these regions were examined more closely. Long-range M1 L5 and L6 projections were revealed in the CPu and VL (Figure 1E – G), respectively, supporting our fMRI results. No evoked responses were observed in the naïve animal, indicating that the observed responses were not heat induced artifacts or undesired light-induced activations8,9.
Neuronal underpinnings of the brain-wide fMRI responses
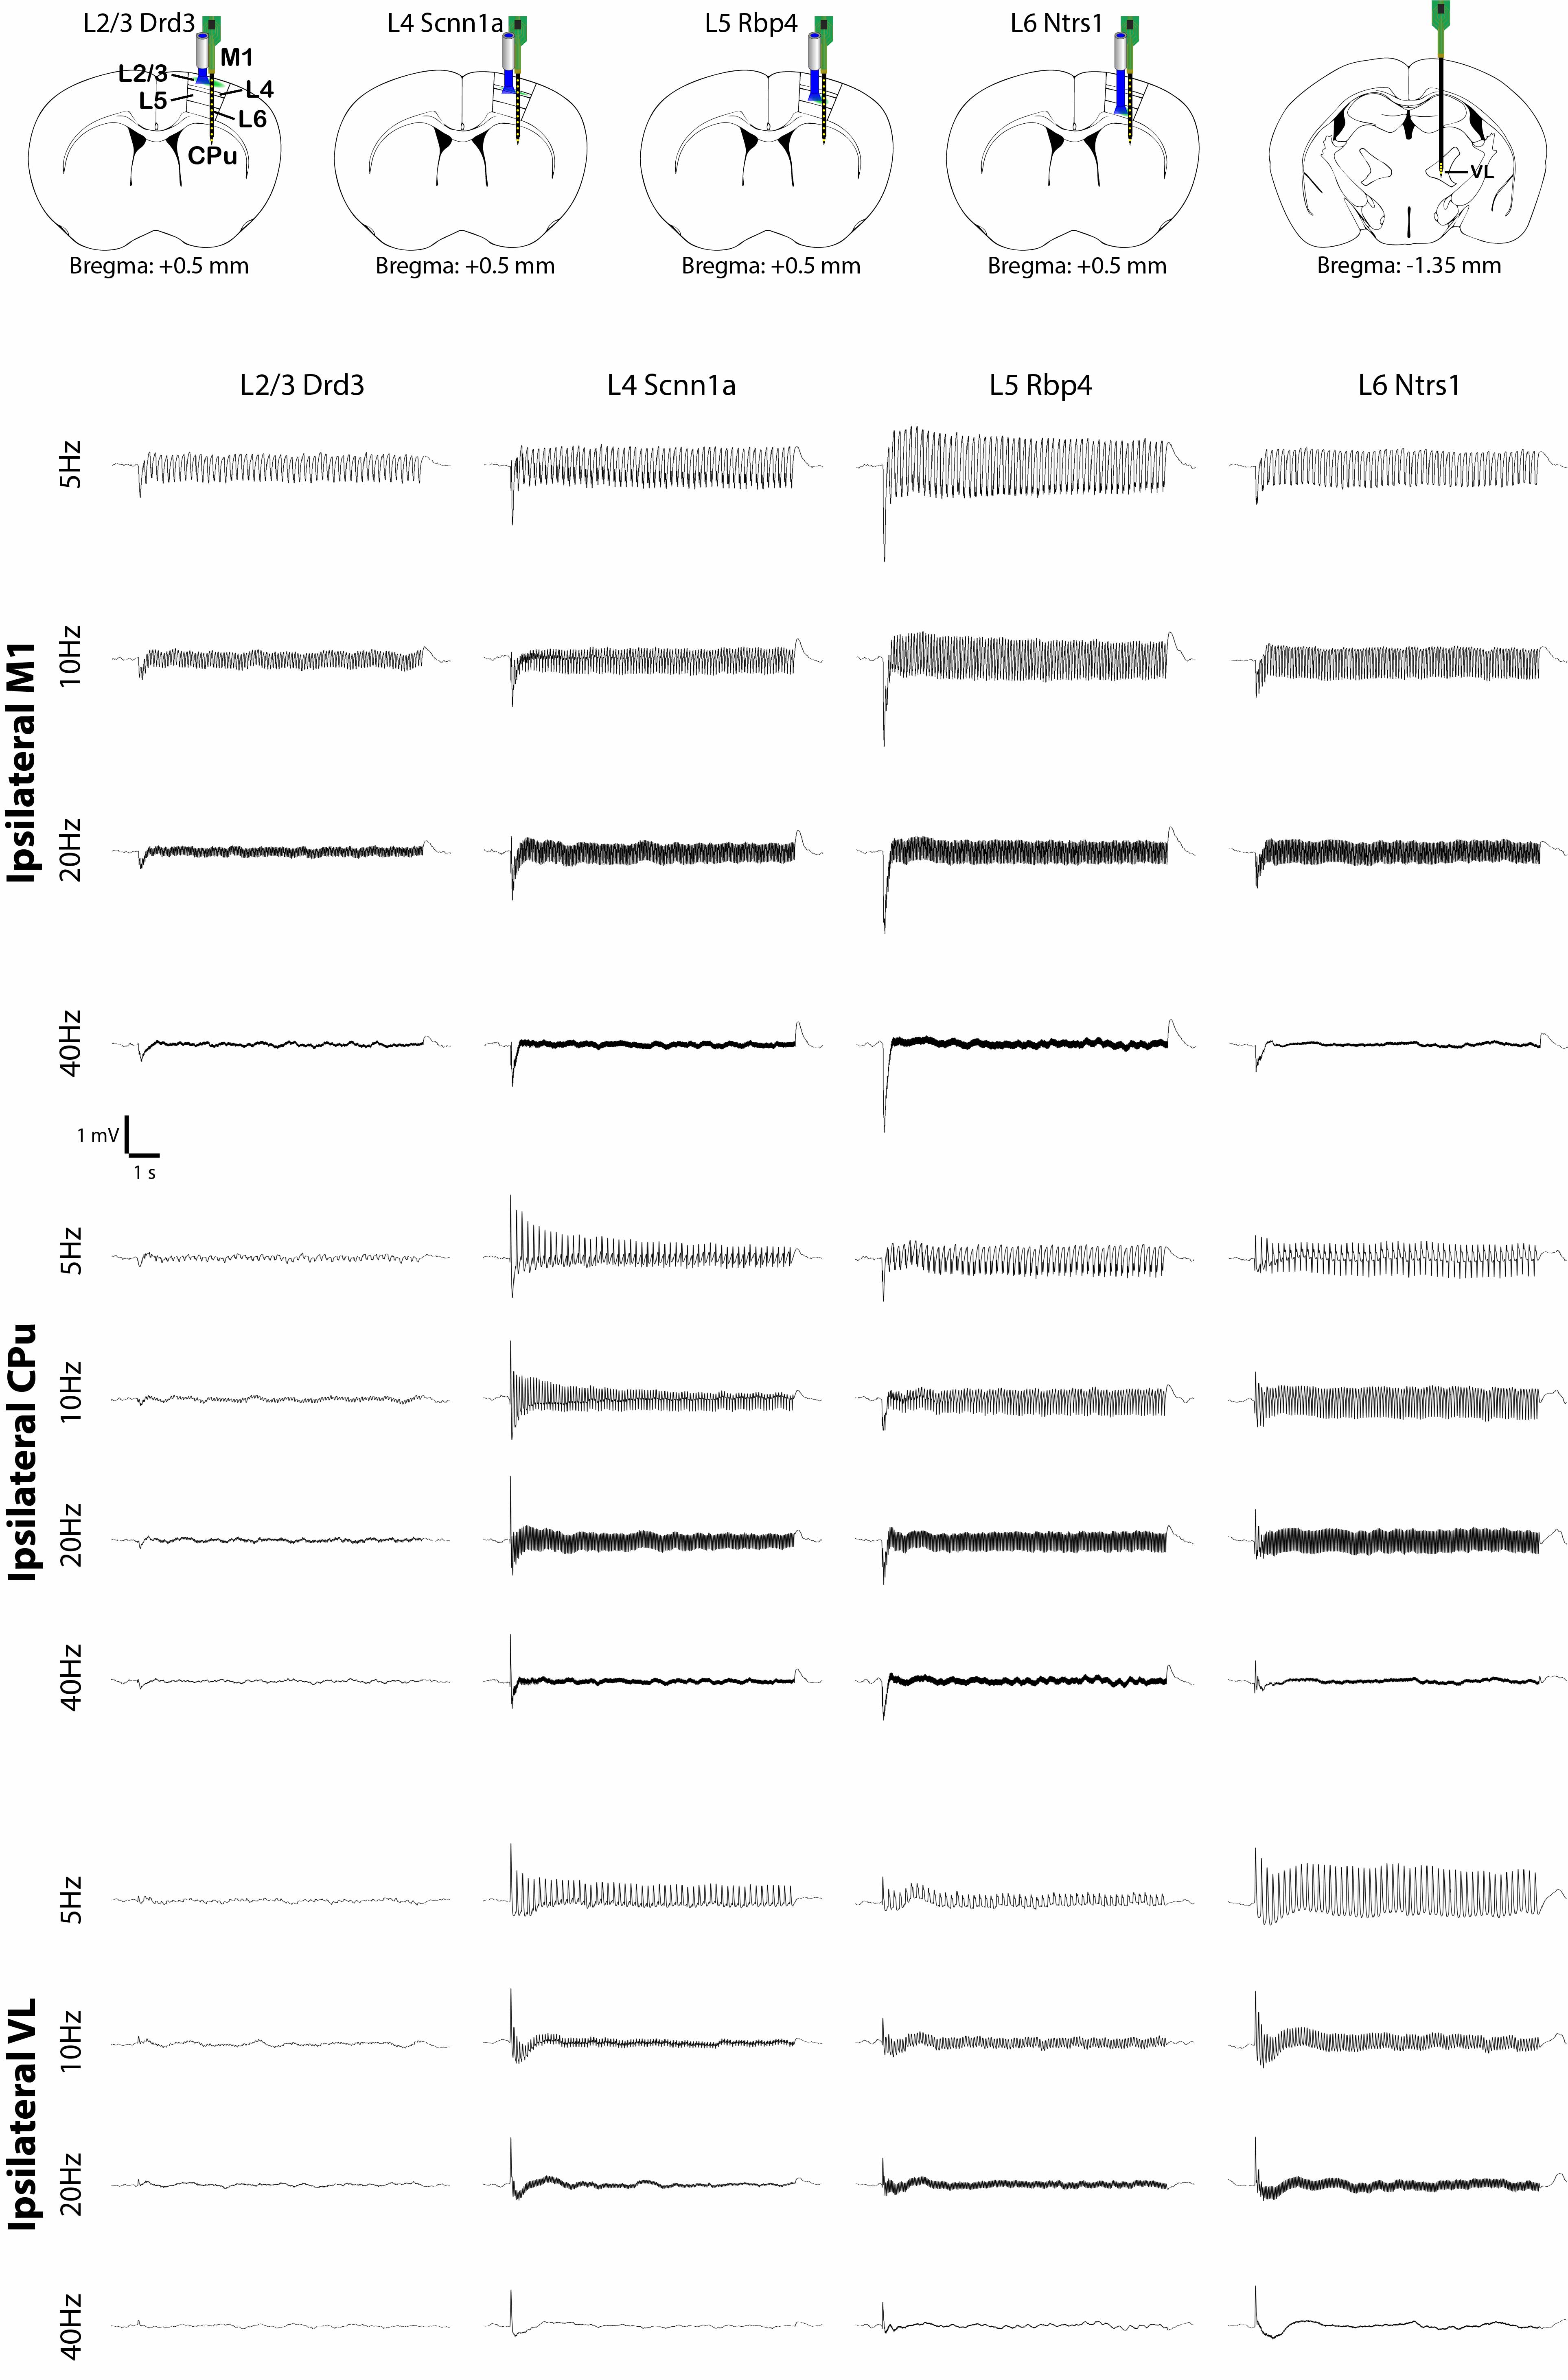
To investigate how layer- and frequency-dependent fMRI responses relate to neuronal activity, we obtained electrophysiological recordings in the ipsilateral M1, CPu and VL. Local field potential (LFP) recordings revealed that L2/3 stimulations mainly evoked responses in ipsilateral M1 and a weak response or no response in the ipsilateral CPu and VL (Figure 4). L4, L5 and L6 stimulations evoked LFP responses in the ipsilateral M1, CPu and VL (Figure 4). These results corroborate our fMRI results that L2/3 stimulation activated only ipsilateral M1 while L4, L5 and L6 stimulations evoked positive or negative BOLD responses in the M1, CPu and VL.We also analyzed the spike recordings in the ipsilateral M1, CPu and VL. Nearly all modulated units exhibited a significant increase in firing rate except for those in the ipsilateral VL during L5 and L6 stimulations (Figure 5A). The spike rates in the ipsilateral M1 significantly increased during L2/3, L4, L5 and L6 stimulation for all stimulation frequencies (Figure 5B). In the remote regions, a robust spike rate increase was observed across all stimulating frequencies in the ipsilateral CPu, while a robust spike rate increase in the VL was observed only during L4 and L6 stimulations (Figure 5B). In contrast, a significant decrease in firing rate was observed in some units during L5 and L6 stimulations (Figure 5C). No evoked responses were observed in the naïve animal, indicating that the observed responses were not photovoltaic induced artifacts or undesired light-induced activations10,11.
CONCLUSION
Layer-specific ofMRI may help investigate the mechanisms of brain-wide layer-specific cortical circuit functional changes during developmental, aging, and disease states, as well as pharmacological interventions.Acknowledgements
No acknowledgement found.References
1. Ebbesen, C. L. & Brecht, M. Motor cortex - to act or not to act? Nature reviews. Neuroscience 18, 694-705, doi:10.1038/nrn.2017.119 (2017).
2. Wise, S. P. & Donoghue, J. P. Motor Cortex of Rodents., Vol. Cerebral Cortex, vol 5. (Springer, 1986).
3. Weiler, N., Wood, L., Yu, J., Solla, S. A. & Shepherd, G. M. Top-down laminar organization of the excitatory network in motor cortex. Nature neuroscience 11, 360-366, doi:10.1038/nn2049 (2008).
4. Gong, S. et al. Targeting Cre recombinase to specific neuron populations with bacterial artificial chromosome constructs. The Journal of neuroscience : the official journal of the Society for Neuroscience 27, 9817-9823, doi:10.1523/JNEUROSCI.2707-07.2007 (2007).
5. Madisen, L. et al. A robust and high-throughput Cre reporting and characterization system for the whole mouse brain. Nature neuroscience 13, 133-140, doi:10.1038/nn.2467 (2010).
6. Pluta, S. et al. A direct translaminar inhibitory circuit tunes cortical output. Nature neuroscience 18, 1631-1640, doi:10.1038/nn.4123 (2015).
7. Adesnik, H. & Scanziani, M. Lateral competition for cortical space by layer-specific horizontal circuits. Nature 464, 1155-1160, doi:10.1038/nature08935 (2010).
8. Christie, I. N. et al. fMRI response to blue light delivery in the naive brain: implications for combined optogenetic fMRI studies. NeuroImage 66, 634-641, doi:10.1016/j.neuroimage.2012.10.074 (2013).
9. Schmid, F. et al. True and apparent optogenetic BOLD fMRI signals. Magnetic resonance in medicine 77, 126-136, doi:10.1002/mrm.26095 (2017).
10. Kozai, T. D. & Vazquez, A. L. Photoelectric artefact from optogenetics and imaging on microelectrodes and bioelectronics: New Challenges and Opportunities. Journal of materials chemistry. B 3, 4965-4978, doi:10.1039/C5TB00108K (2015).
11. Mikulovic, S. et al. On the photovoltaic effect in local field potential recordings. Neurophotonics 3, 015002, doi:10.1117/1.NPh.3.1.015002 (2016).
Figures