1354
Distinguish hemodynamic responses at the white matter tract from the laminar-specific gray matter fMRI signal with line-scanning fMRI1Max Planck Institute for Biological Cybernetics, Tuebingen, Germany, 2Graduate Training Centre of Neuroscience, Tuebingen, Germany, 3Department of Biomedical Engineering, NJIT, Newark, NJ, United States, 4MGH/MIT/HMS Athinoula A. Martinos Center for Biomedical Imaging, Department of Radiology, Harvard Medical School, Massachusetts General Hospital, Charlestown, MA, United States
Synopsis
We applied line-scanning fMRI to investigate evoked hemodynamic responses in both laminar-specific gray matter (GM) and white matter (WM) in rats. Based on the WM-specific cross-correlation lag time to the laminar-specific fMRI signal, distinct WM hemodynamic responses were characterized across animals, showing a biphasic HRF with earlier lag times and a monophasic HRF with later lag times. Also, the lag-time dependent HRFs were detected in the subcortical area under the WM. Elucidating neurovascular coupling characteristics of distinct WM hemodynamic responses may help understand the progression of WM-related diseases, e.g. multiple sclerosis (MS) or small vessel disease (SVD).
Introduction
Laminar-specific fMRI extends the spatial specificity to map connectivity based on the input-output neuronal projection across the cortical depth in human brains [1-3]. Lately, BOLD-fMRI responses in both gray matter (GM) and white matter (WM) have been characterized to specify their temporal dynamic features [4-8]. However, given the limited spatiotemporal resolution, the WM fMRI signal has not been well differentiated from the GM signal across cortical layers. There is a gap of knowledge of how the potentially distinct WM hemodynamic responses attribute to lower WM vascular densities and varied physiological effects on the neurovascular coupling. Previously, a FLASH-based line-scanning method has been developed to elucidate laminar-specific fMRI signal with high temporal (50 ms) and laminar spatial (50 µm) resolution to better understand the fMRI onset time within cortical layers in rodents [9]. Here, we applied the line-scanning method to differentiate evoked hemodynamic responses in the WM and different cortical layers of anesthetized rats. Two distinct hemodynamic response functions (HRFs) in the WM were identified based on the cross-correlation lag times to laminar-specific fMRI signal. The WM-specific hemodynamic responses may be caused by the altered brain states under anesthesia, as well as the vascular reactivity difference between WM and GM.Methods
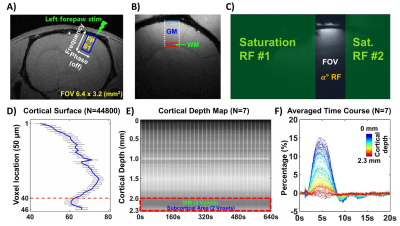
FLASH based line-scanning fMRI datasets were acquired in 10 anesthetized rats (38 trials) with a 14.1T scanner using a home-made transceiver surface coil with a 6 mm diameter. The line-scanning method is applied by combining 2 saturation RF pulses to dampen the MR signal outside the regions of interest (ROI), i.e. the forepaw somatosensory cortex (FP-S1) (Fig. 1C). To acquire BOLD-fMRI responses from GM, WM and the subcortical regions below the WM, readout direction was oriented perpendicular to the FP-S1 cortical layers based on a FLASH based anatomical image in a coronal plane (Fig. 1A, B). The following parameters were used for the acquisition, TR/TE 100/9 ms, TA 10 min 40 sec, flip angle 50°, slice 1, slice thickness 1.2 mm, slice gap 1.5 mm, FOV 6.4 x 3.2 mm2 and matrix 128 x 32. The phase-encoding gradient was turned off to perform line-scanning acquisition.Functional activation was identified by performing a left forepaw stimulation task (3Hz, 4s, pulse width 300us, 2.5mA), followed by 1 second pre-stimulation, 4 seconds during electrical stimulation and 15 seconds post-stimulation with a total 20 seconds for 10 min 40 sec. All signal processing and analysis are implemented in Matlab software (Mathworks, Natick, MA). Averaged time course and percentage change map were calculated for averaging every 20 seconds with the whole time course (640 seconds). The cross-correlation lag time between cortical layers and WM or subcortical regions was calculated in order to identify laminar-specific cross-correlation features across animals. Fisher-Z transform was used for averaging the correlation coefficients (lag time = 0) to avoid a problem of bias. Finite impulse response (FIR) bandpass filter was applied to identify fMRI signal fluctuation within 0.01 – 0.1 Hz in evoked fMRI.
Results
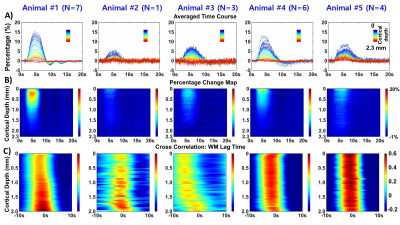
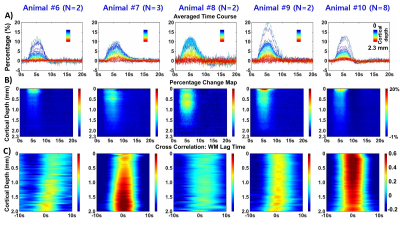
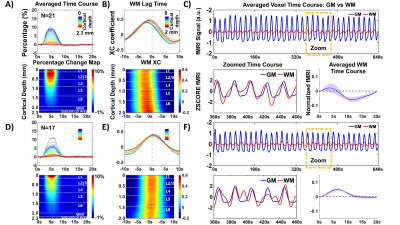
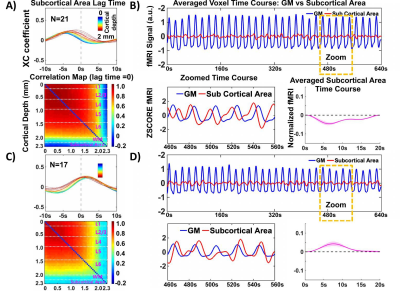
The laminar-specific BOLD-fMRI signals were detected with the line-scanning method in anesthetized rats at FP-S1 (Fig. 1). Fig. 1A/B shows the landmarks of the boundaries among GM, WM and subcortical regions based on the T2*-weighted contrast. Fig. 2A/B and 3A/B layout the averaged fMRI time courses (1s off, 4s on, and 15s off) and fMRI percentage change map across cortical layers (0 – 2.3mm), showing highly varied laminar-fMRI responses across 10 rats under anesthesia. Interestingly, despite the high varied laminar-fMRI signal, the cross-correlation (XC) of WM with laminar-specific signals enables the classification of two groups of lag time detection: earlier (median, -1.79 ± 0.28s) or later (median, 1.19 ± 0.18s) WM hemodynamic responses than GM signal (Individuals: Fig. 2/3C, Averaged: Fig. 4). Group analysis demonstrates that the mean WM hemodynamic response function (HRF) is biphasic in the earlier lag time group (Fig. 4C), in contrast to the monophasic pattern in the later lag time group (Fig. 4F). In addition, the stronger BOLD signal detected from draining veins (Fig. 4D, superficial layers) may indicate different vascular reactivity between two groups. Furthermore, hemodynamic responses of the subcortical area below the WM, i.e. striatum, between the two groups show significantly different correlation patterns to laminar-specific fMRI (Fig. 5), also presenting earlier (–1.41± 0.47s) and later (1.25 ± 0.50s) lag times to laminar-specific fMRI signal in the GM. In particular, the HRF of the subcortical area of the group with earlier lag time is dominated with the negative hemodynamic responses (Fig. 5B), showing negative correlation coefficients at lag time zero in the cross-correlation matrix (Fig. 5A).Conclusions
Using the line-scanning fMRI, we detected evoked hemodynamic responses in both GM and WM with high spatiotemporal resolution in rats. Based on the cross-correlation lag time between the WM and the laminar-specific fMRI signal, we identified distinct HRFs of the WM in two groups of animals. In addition, the lag-time specific group analysis also highlights different HRFs in the subcortical area below the WM. The distinct WM HRFs indicate different neurovascular coupling and brain state-dependent regulation from the GM. The elucidation of its underlying mechanism will help better understand the progression of WM-related diseases, e.g. multiple sclerosis (MS) or small vessel disease (SVD).Acknowledgements
This research was supported by NIH Brain Initiative funding (RF1NS113278-01), and the S10 instrument grant (S10 RR023009-01) to Martinos Center, German Research Foundation (DFG) Yu215/3-1, BMBF 01GQ1702, and the internal funding from Max Planck Society.References
[1] Polimeni JR, Fischl B, Greve DN, Wald LL. Laminar analysis of 7T BOLD using an imposed spatial activation pattern in human V1. Neuroimage 2010; 52:1334-46
[2] Huber L, Handwerker DA, Jangraw DC, Chen G, Hall A, Stüber C, Gonzalez-Castillo J, Ivanov D, Marrett S, Guidi M, Goense J, Poser BA, Bandettini PA. High-Resolution CBV-fMRI Allows Mapping of Laminar Activity and Connectivity of Cortical Input and Output in Human M1. Neuron 2017; 96: 1253-63
[3] Turner R. Uses, misuses, new uses and fundamental limitations of magnetic resonance imaging in cognitive science. Philos Trans R Soc Lond B 2016; 371:20150349
[4] Li M, Newton AT, Anderson AW et al. Characterization of the hemodynamic response function in white matter tracts for event-related fMRI. Nature Communications 2019; 10:1-11
[5] Thomas BP, Liu P, Park DC, van Osch MJ, Lu H. Cerebrovascular reactivity in the brain white matter: magnitude, temporal characteristics, and age effects. J Cereb Blood Flow Metab. 2014; 34(2):242-7
[6] Kim JH, Ress D. Reliability of the depth-dependent high-resolution BOLD hemodynamic response in human visual cortex and vicinity. Magentic Resonance Imaging. 2017; 39:53-63
[7] Courtemanche MJ, Sparrey CJ, Song X, MacKay A, D'Arcy RCN. Detecting white matter activity using conventional 3 Tesla fMRI: An evaluation of standard field strength and hemodynamic response function. NeuroImage. 2018; 169:145-150
[8] Nathoo N, Yong VW, Dunn JF. Understanding disease processes in multiple sclerosis through magnetic resonance imaging studies in animal models. NeuroImage: Clinical. 2014; 4:743-756
[9] Yu X, Qian C, Chen D, Dodd SJ, Koretsky AP. Deciphering laminar-specific neural inputs with line-scanning fMRI. Nature methods 2014; 11:55-58
Figures
