1350
M-Mapping Method for Calibrated fMRI in Awake Versus Anesthetized Mice1Institute of Neuroscinece, CAS Center for Excellence in Brain Sciences and Intelligence Technology, Key Laboratory of Primate Neurobiology, Chinese Academy of Sciences, Shanghai, China, 2iHuman Institute, ShanghaiTech University, Shanghai, China
Synopsis
In functional brain imaging, the BOLD signal represents a mixture of CBF, CBV and the CMRO2. “Calibrated fMRI” methods aim to measure CMRO2 through a metabolic model, but typically require administration of gases which is not possible in many clinical settings. Here, we developed a calibrated fMRI technique called “M-Mapping” which combines CBF and R2' maps together to calculate relative CMRO2 and showed awake mice has a greater value than anesthetized mice in a region specific manner. This method may have a great potential to compare brain metabolic activity across different resting activity levels for further clinical study.
Purpose
The purpose of this study was to develop a novel method called “M-Mapping” to compare cerebral metabolic rate of oxygen consumption (CMRO2) across different brain states.Materials and Methods
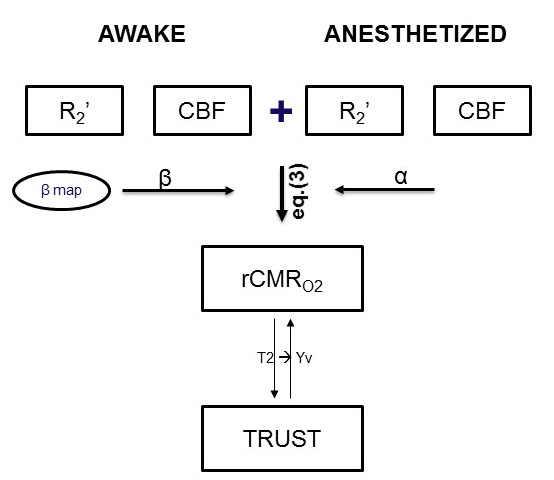
A total of 15 Male adult C57BL/6 mice were studied on a Bruker BioSpec 9.4T scanner, using 86mm volume coil (Bruker) for transmission and 4 channel phased array cryogenic mouse head coil (Bruker) for receiving. Animals underwent headpost implantation and habituation for awake imaging based on our previous studies 1. A pseudo-continuous ASL (pCASL) sequence 2 was used to measure CBF, with the following parameters: TE 22 ms, TR 4000 ms, in-plane resolution 0.225mm × 0.225 mm, slice thickness 0.5 mm, a label duration of 3s followed by 300ms post labeling delay (PLD), eighty pairs of label/control images. R2* and R2 maps were acquired with MGE (Multiple Gradient Echo, TR 500ms, TE 2.15-17.23ms, number of echo 8, number of average 4, slice thickness 0.5mm, filed of view 22×16mm) and MSME (Multi Slice Multi Echo, TR 3000ms, TE 10-100ms, number of echo 10, number of average 1, slice thickness 0.5mm, filed of view 22×16mm) sequences, respectively. An optimized T2-relaxation-under-spin-tagging (TRUST) sequence 3 was used to measure venous blood T2 in the mouse brain. The parameters used were: TE 5.9 ms, TR 5000 ms, inversion slab thickness 1.5mm, PLD 600 ms, FOV 16 mm × 16 mm, matrix size 128 × 128, slice thickness 0.5 mm, three eTE values of 0.27, 7.5, 15 ms. β mapping was based on a previously reported contrast agent (Molday) based method 4 .Data were preprocessed using custom-written scripts in MATLAB and the SPM12 (http://www.fil.ion.ucl.ac.uk/spm/) as Fig.1 steps. Among, The R2* and R2 map was calculated using the normalized magnitude multi-echo MGE and MSME data with a mono-exponential fit by using the Levenberg-Marquardt algorithm, R2’ images were calculated using eq. (1) . In addition, the following eq. (2) was used to quantify CBF 5. Finally, the relative CMRO2 was calculated using the eq. (3).
$$ R_2^\prime=R_2^\star-R_{2}(1)$$
$$ CBF=\frac{\triangle M\times\lambda\times R_{1a}\times exp(\omega\times R_{1a})}{2\times\alpha\times M_{0}\times(1-exp(-\tau\times R_{1a}))}(2)$$
$$ rCMR_{O2}=\frac{CMR_{O2,A}}{CMR_{O2,B}}=(\frac{R_{2,A}^\prime}{R_{2,B}^\prime})^{\frac{1}{\beta}}\times(\frac{CBF_{A}}{CBF_{B}})^{1-\frac{\alpha}{\beta}}(3)$$
Results
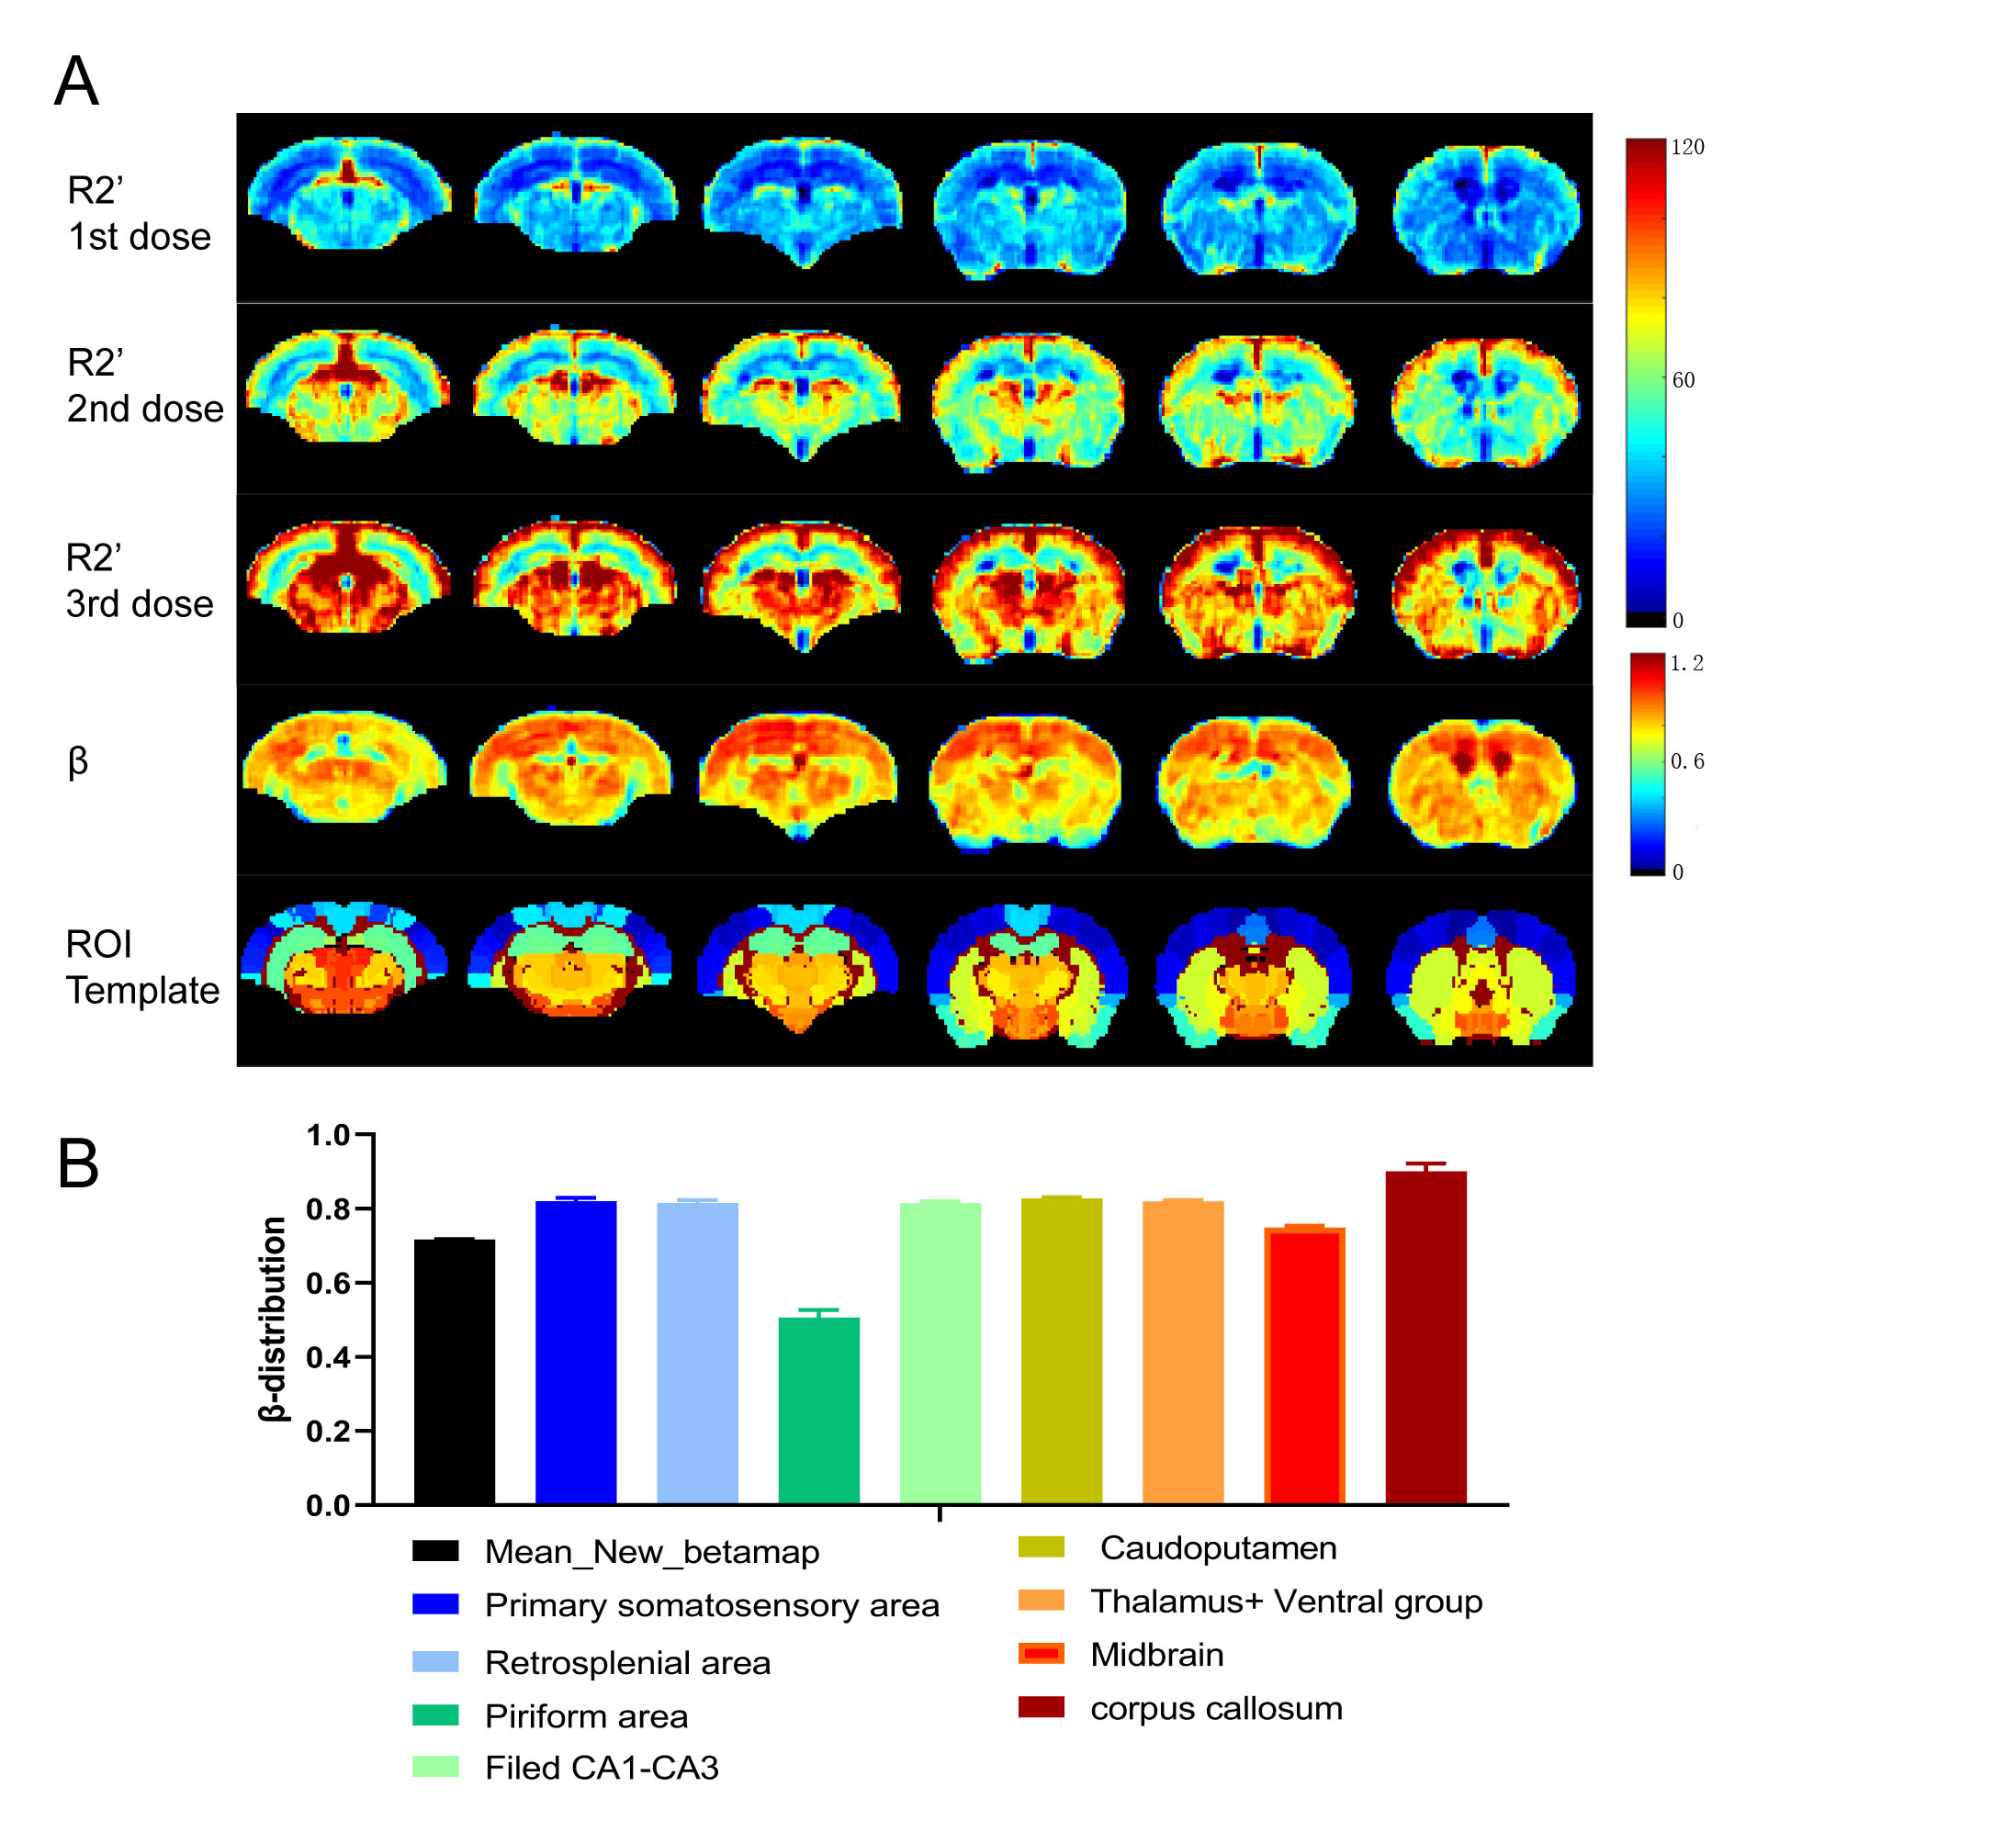
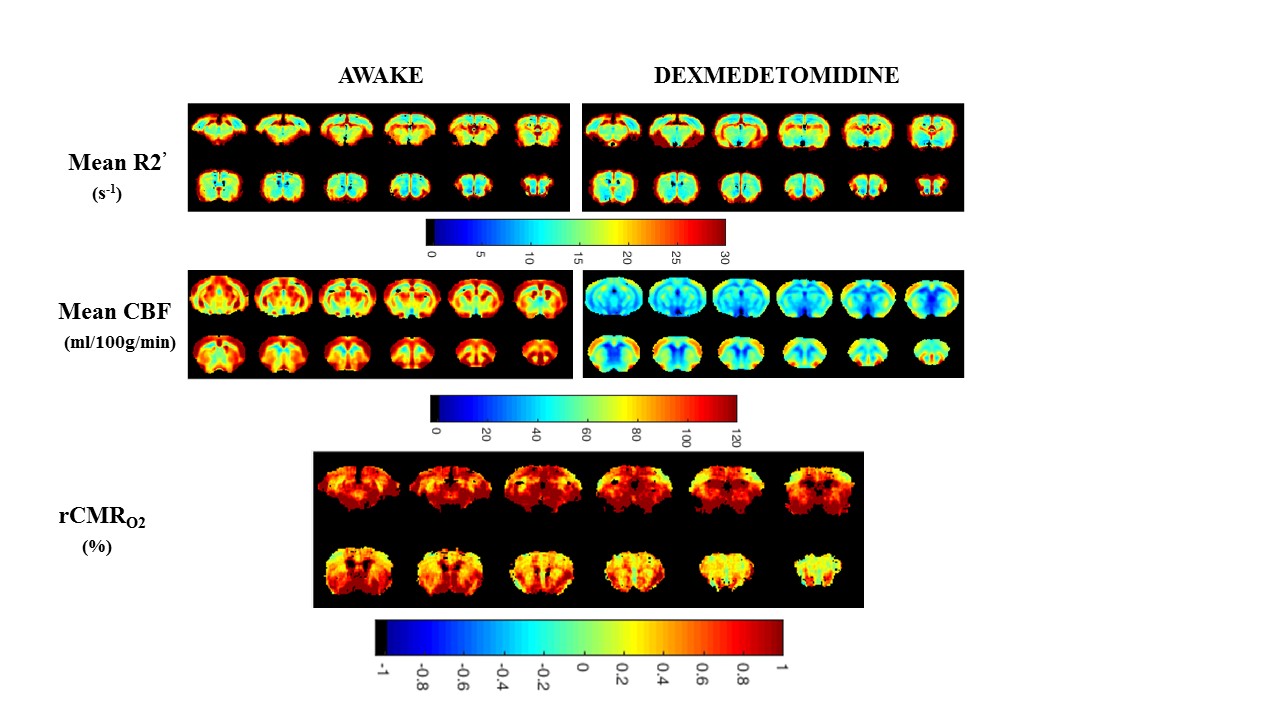
To quantify relative CMRO2 (rCMRO2) with eq. (3), the parameter of β was needed in addition to independent measurements of R2’ and CBF. Figure 2 shows multiple slices of β measured for the whole brain under anesthesia. A uniform β among the cortical gray matter was measured, with a mean of 0.82±0.083. In the subcortical gray matter, β was lower in magnitude, with a mean of 0.77±0.0097.Relative cerebral metabolic rate of oxygen consumption (rCMRO2) demonstrated awake mice exhibited a greater value than anesthetized mice (dexmedetomidine). A higher level of R2’ and CBF leading to a higher baseline in awake mice versus dexmedetomidine (Fig.3).
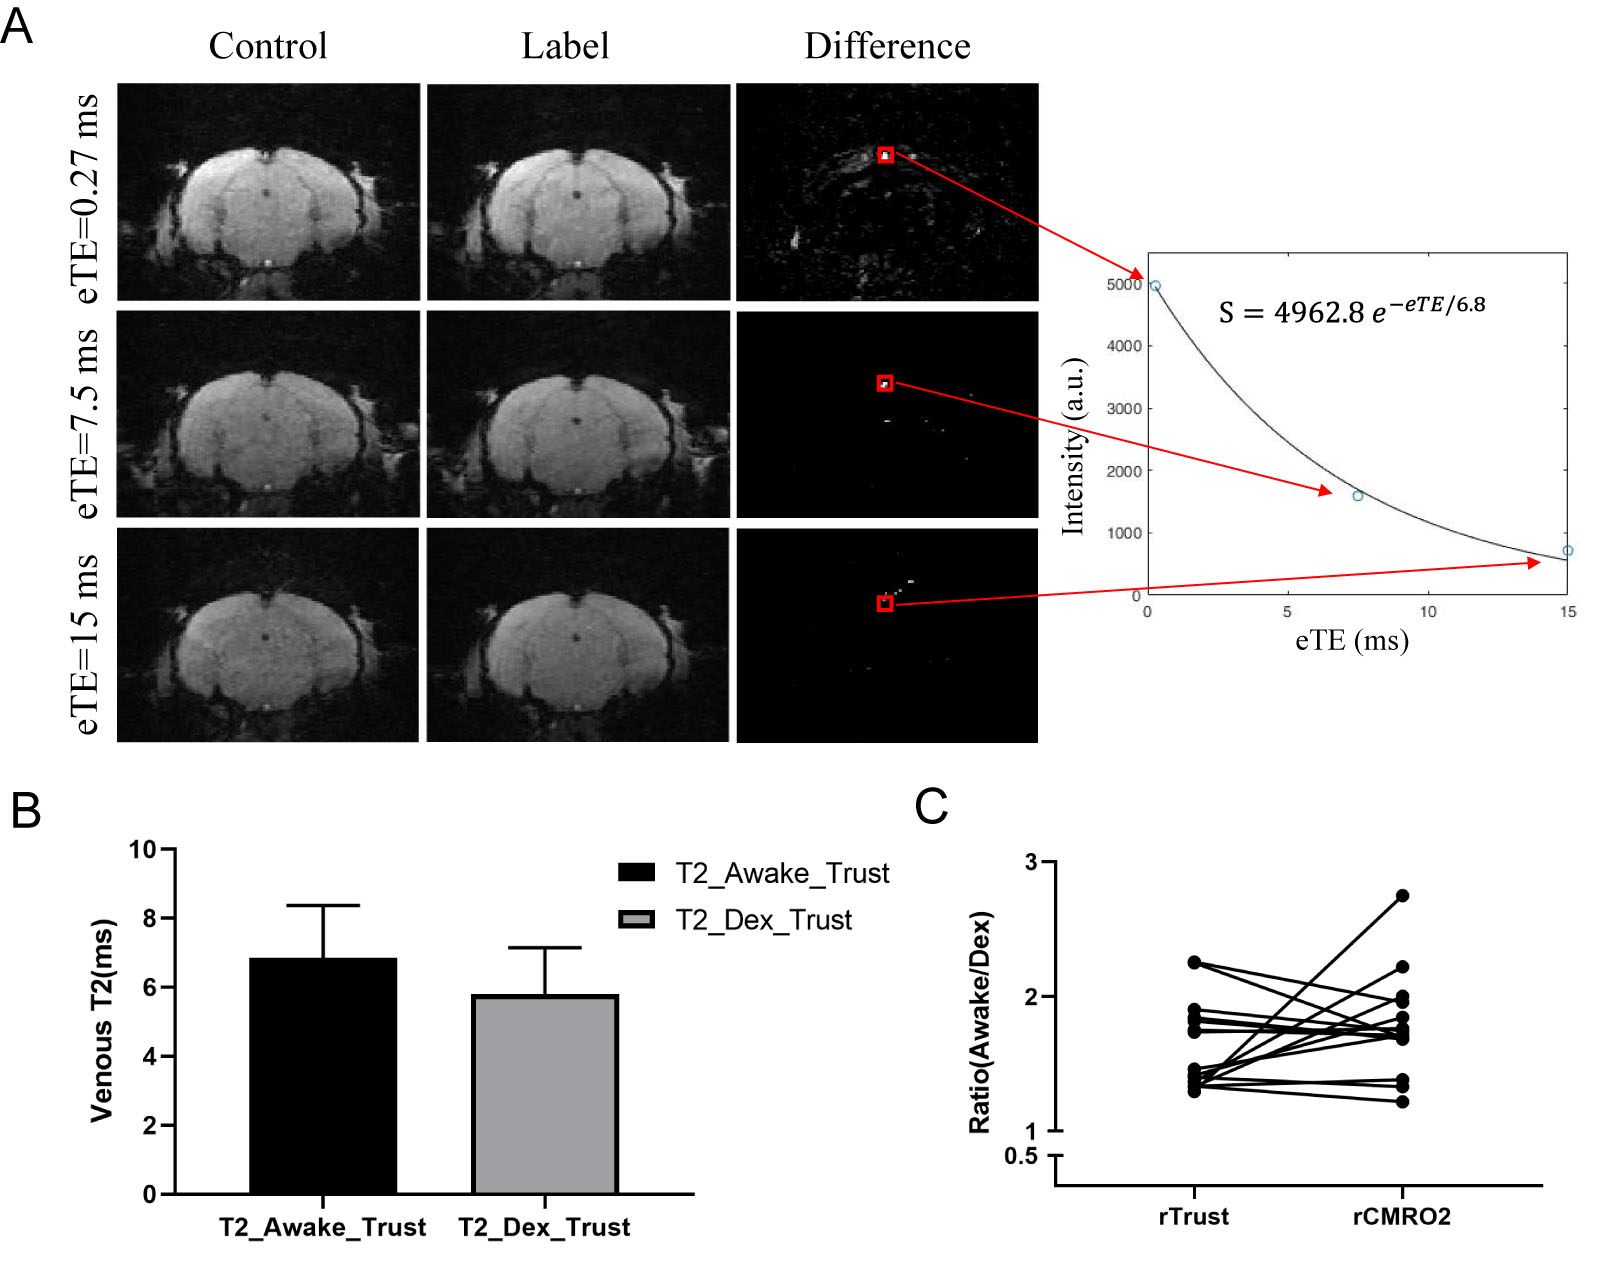
Using TRUST based global rCMRO2 measurement, we were able to show the global trend rCMRO2 of using “M-Mapping” method is consistent with that of TRUST method (Fig.4). Mono-exponential fitting of the difference signal in the sagittal sinus is also shown. T2v values during awake and dexmedetomidine were found to be 6.84±1.53 and 5.80±1.34 ms, respectively. The relative global cerebral metabolic rate of oxygen consumption was calculated using a TRUST approximate method 3,6,7, and no significant difference (p=0.285) was found between the two methods.
Discussion and conclusions
In this study, we obtained β values range between 0.5 and 1.0 in the rodent brain, with the cortical gray matter regions being uniformly higher than the subcortical gray matter regions, these results were in agreement with previous study. However, this study benefited from high magnetic field strength with its inherent higher spatial resolution and reduced intravascular weighting to achieve mono-exponential R2’ decay. Under these conditions, R2’ and β should not vary significantly between R2’ methods, but further measurements are needed to confirm this.In addition, we observed global CBF to be 90 ± 7 and 52 ± 10 ml/100g/min in awake and dexmedetomidine mice respectively, which is comparable to values from literature obtained in Sprague-Dawley rats under isoflurane anesthesia 2. These results lead to a higher rCMRO2 in awake than anesthetized mice.
To further support our notion, we combined Fick principle and TRUST method to approximately quantify the rCMRO2 at the two different states. Finally, the measured results were also in good agreement with our “M-Mapping” method results. However, as TRUST method only provides an estimation of global venous oxygenation, with no spatial information, further technical improvements are needed to extend the global measurement into spatially resolved maps.
In summary, “M-Mapping” method is a plausible way to compare brain activity across different resting activity levels. Unlike other methods, M-Mapping does not require additional agents or gases, therefore shows great potentials for further clinical study.
Acknowledgements
This study was supported by the Strategic Priority Research Program of the Chinese Academy of Sciences (Grant No. XDB32030100 to Z. L.).
References
1.Han Z, Chen W, Chen X, et al. Awake and behaving mouse fMRI during Go/No-Go task. Neuroimage. 2019; 188:733-742.
2. Hirschler L, Debacker C S, Voiron J, et al. Inter-pulse phase corrections for unbalanced pseudo-continuous arterial spin labeling at high magnetic field. Magnetic resonance in medicine. 2018; 79(3):1314-1324.
3. Wei Z, Xu J, Liu P, et al. Quantitative assessment of cerebral venous blood T2 in mouse at 11.7T: Implementation, optimization, and age effect. Magnetic resonance in medicine. 2018; 80(2):521-528.
4. Shu C Y, Sanganahalli B G, Coman D, et al. Quantitative β mapping for calibrated fMRI. NeuroImage. 2016; 126:219-228.
5. Wang Z, Aguirre G K, Rao H, et al. Empirical optimization of ASL data analysis using an ASL data processing toolbox: ASLtbx. Magnetic resonance imaging. 2008; 26(2):261-269.
6. Rodgers Z B, Detre J A, Wehrli F W. MRI-based methods for quantification of the cerebral metabolic rate of oxygen. Journal of Cerebral Blood Flow & Metabolism. 2016; 36(7):1165-1185.
7. Lu H, Xu F, Grgac K, et al. Calibration and validation of TRUST MRI for the estimation of cerebral blood oxygenation. Magnetic resonance in medicine. 2012; 67(1):42-49.
Figures