1349
Ultrafast functional MRI signals reflect activation sequence in the mouse visual pathway1Champalimaud Neuroscience Programme, Champalimaud Centre for the Unknown, Lisbon, Portugal
Synopsis
We investigated BOLD response profiles along the entire mouse visual pathway (with monocular stimulation) using an ultrafast fMRI acquisition with 50 ms temporal resolution and quantified onset, half-maximum and peak times. To achieve the spatial coverage with this temporal resolution, an oblique slice covering the entire visual pathway was tailored. The quantified onset times were the only parameter correlating with the visual pathway neural input order. Our findings highlight a potential importance for onset time quantification – requiring ultrafast fMRI acquisitions – as a signature capable of mapping the underlying activation sequence of events in distributed neural networks.
Introduction
Assessing activation dynamics in distributed pathways using fMRI is difficult due to the tradeoff between spatial and temporal resolution and the slow and complex hemodynamic coupling mechanisms. A few fMRI studies have suggested that BOLD onset times in cortical layers reflect neural input order1-6. We hypothesized that onset times preserve neural input order in a more general fashion. To test this, we harnessed an ultrafast 2D fMRI approach covering the entire mouse visual pathway7-9 with a temporal resolution of 50ms and very high sensitivity due to the use of a cryogenic coil10,11.Methods
Animal experiments were preapproved by the institutional and national authorities and were carried out according to European Directive 2010/63.Animal preparation: Adult C57BL/6 mice (n=9) were kept under medetomidine and 0.3% isoflurane anaesthesia while breathing oxygen-enriched air. Temperature and respiration rate were monitored and remained stable throughout the experiment.
MRI experiments: A 9.4T BioSpec scanner (Bruker, Karlsruhe, Germany) with an 86mm quadrature resonator for transmittance and a 4-element array cryoprobe10,11 (Bruker, Fallanden, Switzerland) for signal reception were used. For the ultrafast fMRI, one oblique slice was tailored to capture the entire visual pathway (GE-EPI: TR/TE=50/17.5msec, FOV=16×12.35mm2, resolution=167×167μm2, slice thickness=1mm, tacq=7min30sec).
A multislice fMRI acquisition (GE-EPI: TR/TE=1000/15msec, FOV=16×12mm2, resolution=145×145μm2, slice thickness=1mm, tacq=5min40sec) was performed for validation prior to ultrafast acquisitions.
A hypercapnia experiment was designed to assess the vascular contribution to the onset times and consisted of two 1.5min periods with medical-air ventilation interleaved with 1.5min of hypercapnia state (6.5%CO2).
Visual Stimulation: Left eye monocular stimulation (Fig.1A) was performed using a 470 nm LED (2.89x10⁻³W/m2). For ultrafast fMRI, ten blocks of 1sec stimulation (frequency = 2Hz; pulse width = 10ms) and 40sec rest were used (Fig.1B). For multislice fMRI, five blocks of 20sec stimulation and 40sec rest were applied. All experiments were separated by a 6min resting period to avoid habituation.
Data analysis: Pre-processing steps included manual outlier detection (<0.5% of data), motion correction and regression and animal registration.
Fourier analysis (Fig1.B, C) was performed as in [12], where the power in frequencies associated with the stimulation paradigm was mapped voxelwise and detected activated areas along the visual pathway. Regions of interest (ROIs) were manually drawn along the visual pathway and time-courses were detrended with a polynomial fit to the resting periods. Hypercapnia time-courses were detrended using a linear fit to the initial 1.5min.
Voxelwise analysis: A 4-term Gaussian function was fitted to the average BOLD response of each voxel. Peak and half-maximum times were computed as the maximum and time to half maximum of the fitted curve respectively. Onset times were calculated as the first time point of the fitted curve after stimulation, above 95th percentile of the noise level with two consecutive points fulfilling this rule. A minimum cluster size of 15 voxels was imposed, and maps were masked with the obtained Fourier maps.
For statistical analysis, a Kruskal-Wallis test was used with multiple-comparison correction.
Results
ROI analysis: SNR in contralateral V1, ipsilateral V1B, LP, SC, and LGN was 73, 83, 47, 83 and 53, respectively. LGN and SC had similar early BOLD onsets, followed by LP and then by visual cortices (Fig.2). A hypercapnia challenge evidenced similar onset times for all structures (Fig.3).Voxelwise analysis: Onset time maps (Fig.4C, F) showed similar earlier responses for LGN and SC around 400-800ms after stimulus presentation; followed by LP with 900-1100ms and, finally, visual cortices were activated between 1200-1800ms suggesting the correct activation sequence: LGN/SC->LP->V1. The half-maximum (Fig.4D, G) and peak time maps (Fig.4E, H) failed to depict this sequence.
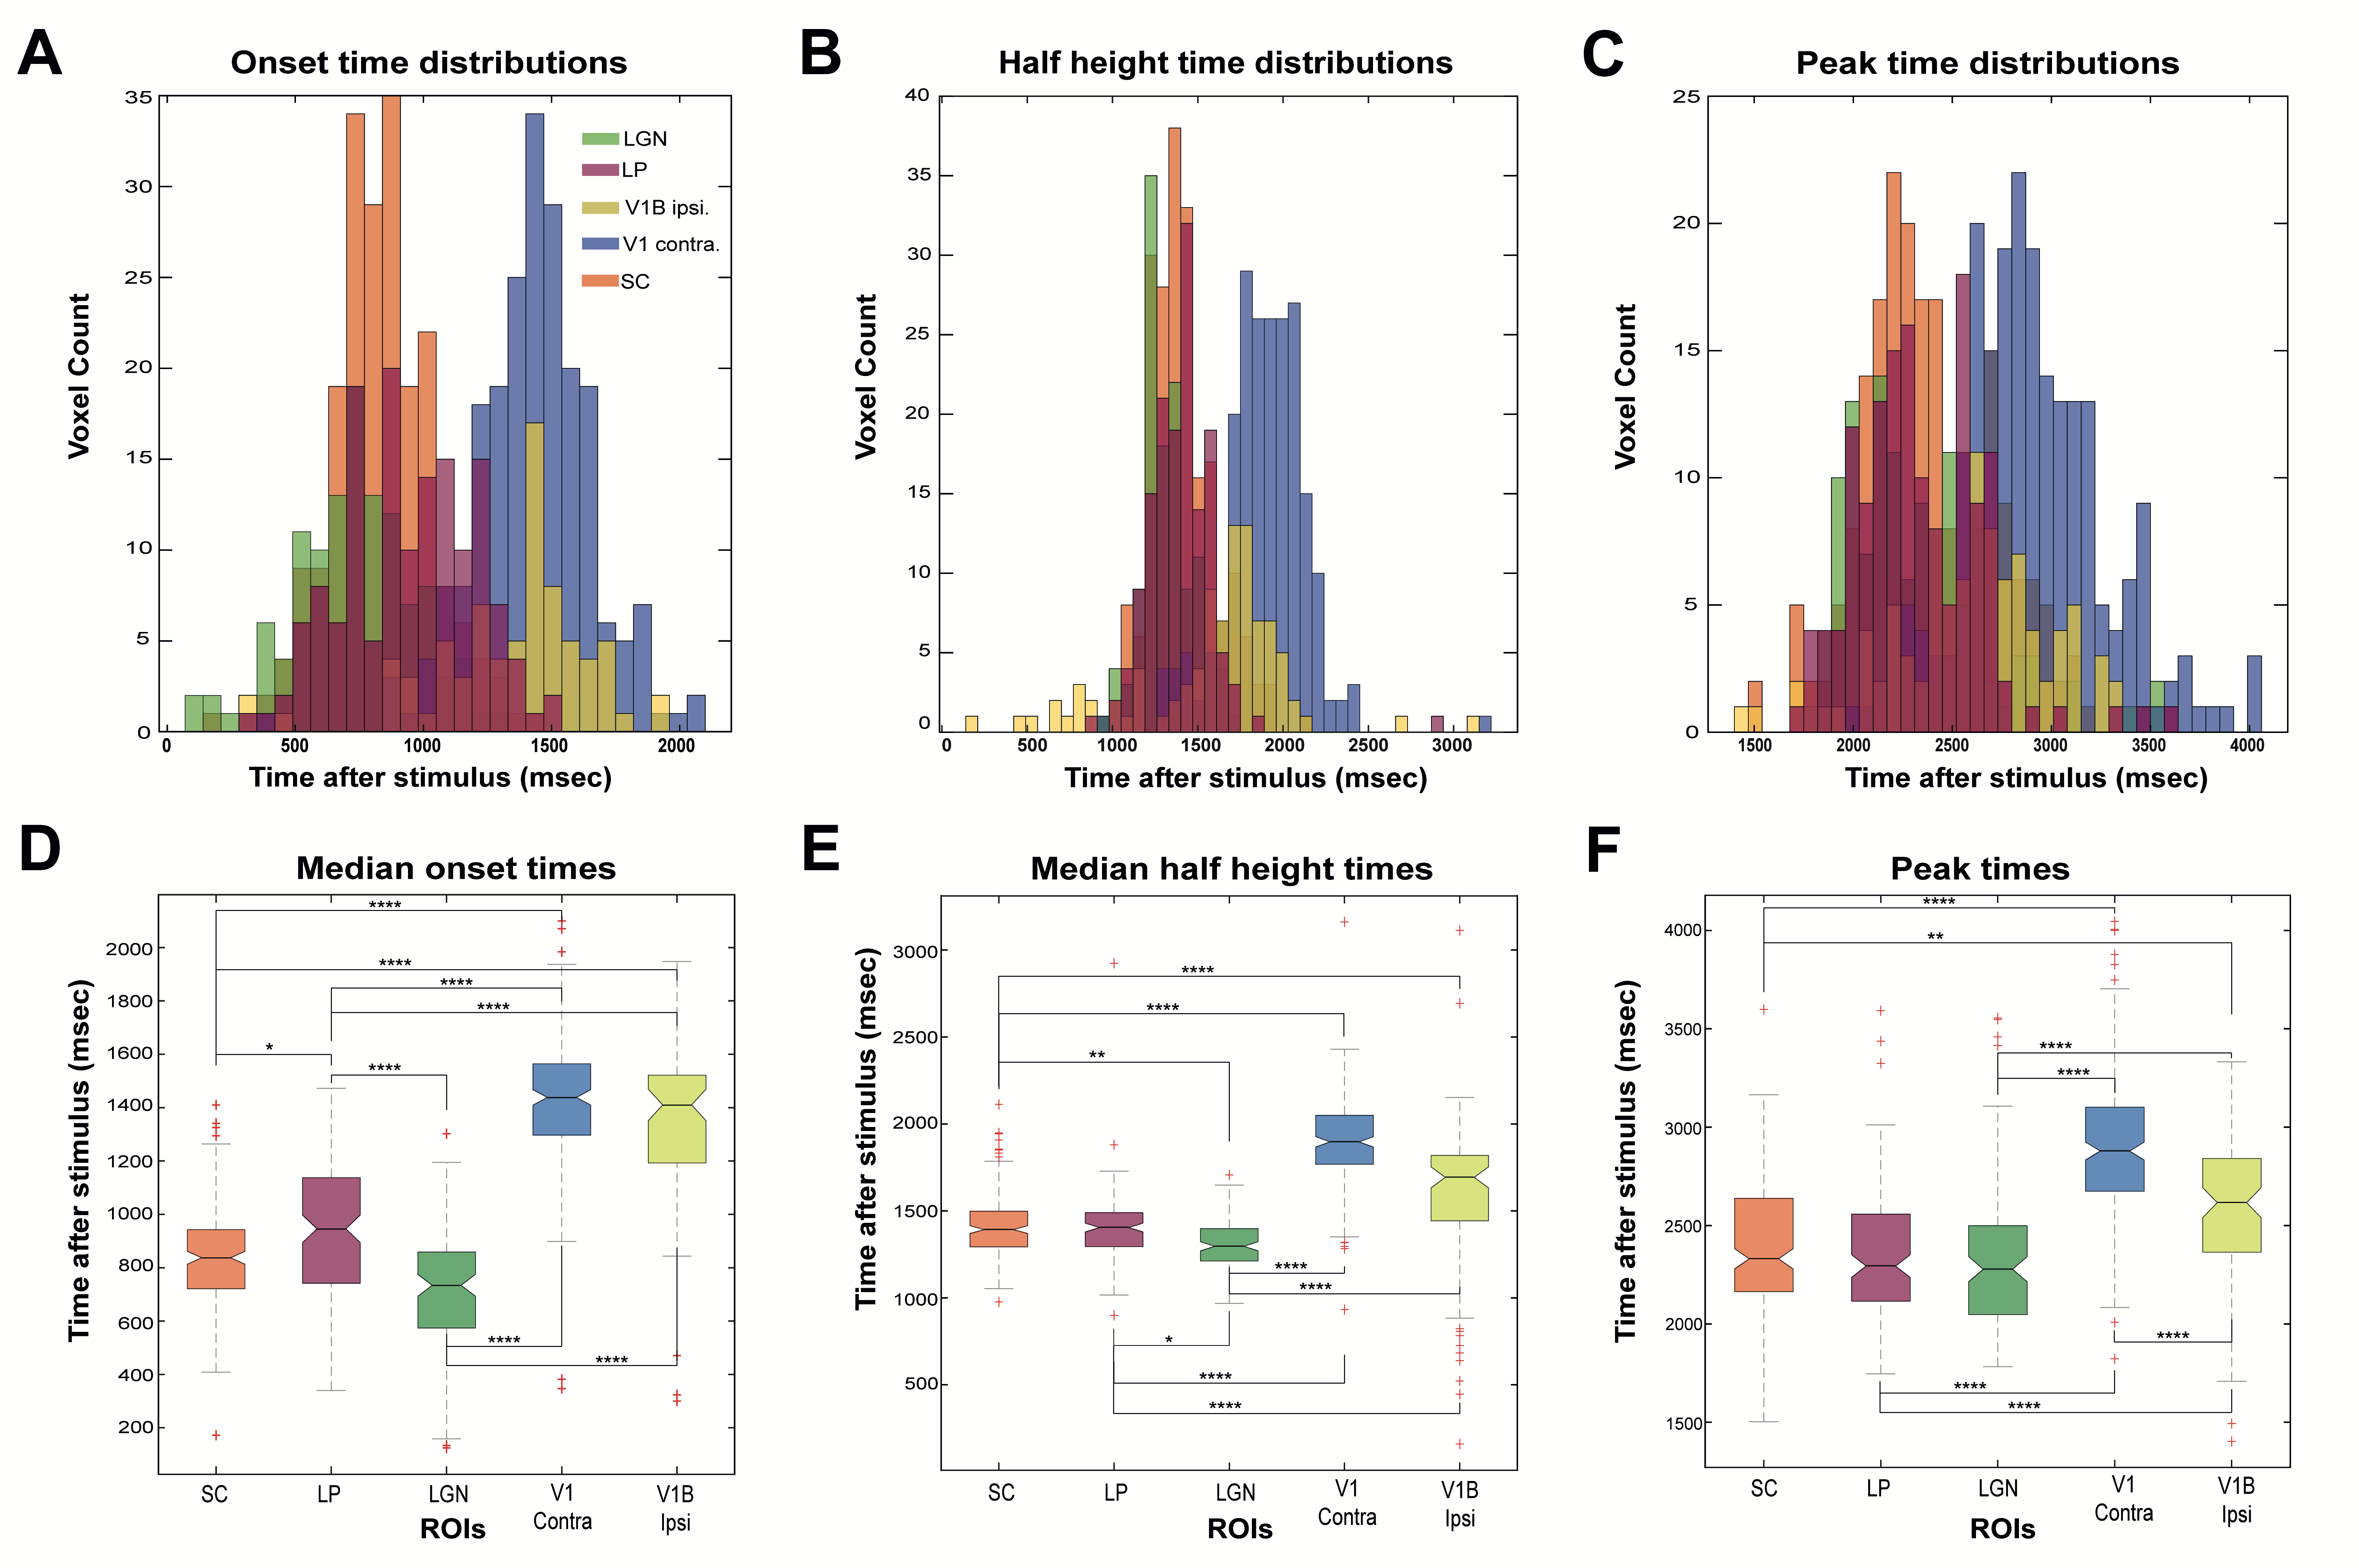
Statistical analysis: Onset time histograms (Fig.5A) further show that LGN and SC bins overlapped, while LP showed higher values, followed by much longer onsets for visual cortices. The Kruskal-Wallis test (Fig.5D) showed statistically significant differences between different ROIs (p≤0.0001 - SC and LP: p≤0.05) except LGN and SC (p=0.09). The half-maximum (Fig.5B, E) and peak times (Fig.C, F) statistics confirmed more dissociated dynamics in subcortical structures.
Discussion
Neurovascular couplings are yet to be fully deciphered13-16 and the relationship between the BOLD responses and underlying neural activity remains contested17-23. Our study generalizes previous findings1-5, revealing that BOLD onset times can reflect the known neuronal input sequence in distributed pathways while other timing parameters appear to be dissociated. Our hypercapnic control experiments ruled out differences in vasculature as the source for the onset time contrast. The dissociation of later timings from neural input order may reflect a more convoluted interplay between ongoing activity and hemodynamic effects.Despite that local field potentials are still ten times faster24 than our measured onset times, since visual stimulus only included two 10ms flashes, accumulation of repeated inputs is likely not the source of these time differences. Multimodal approaches (e.g. electrical recordings17, calcium recordings25 or optical imaging26,27) are required to further dissect the mechanisms underpinning BOLD onset time differences.
Conclusions
An ultrafast fMRI approach achieving the temporal resolution and sensitivity required for resolving onset times in distributed networks was presented. The importance in mapping BOLD earlier rather than later timing parameters, was demonstrated. Our study is thus encouraging for identifying neural input order (as well as aberrations thereof) in distributed pathways using fMRI and for further investigation of neurovascular coupling.Acknowledgements
This study was funded in part by the European Research Council (ERC) (agreement No. 679058), as well as by Fundação para a Ciência e Tecnologia (Portugal), project 275-FCT-PTDC/BBB-IMG/5132/2014. The authors acknowledge the vivarium of the Champalimaud Centre for the Unknow, a facility of CONGENTO which is a research infrastructure co- financed by Lisboa Regional Operational Programme (Lisboa 2020), under the PORTUGAL 2020 Partnership Agreement through the European Regional Development Fund (ERDF) and Fundação para a Ciência e Tecnologia (Portugal), project LISBOA-01-0145-FEDER-022170. The authors would like to thank Dr. Daniel Nunes for assistance in the hypercapnia experiments.References
[1] Ogawa, S. et al. An approach to probe some neural systems interaction by functional MRI at neural time scale down to milliseconds. Proc. Natl. Acad. Sci. U. S. A. 97, 11026–31 (2000)
[2] Hirano, Y., Stefanovic, B. & Silva, A. C. Spatiotemporal evolution of the functional magnetic resonance imaging response to ultrashort stimuli. J. Neurosci. 31, 1440–7 (2011).
3] Yu, X. et al. Direct imaging of macrovascular and microvascular contributions to BOLD fMRI in layers IV-V of the rat whisker-barrel cortex. Neuroimage 59, 1451–1460 (2012)
[4] Silva, A. C. & Koretsky, A. P. Laminar specificity of functional MRI onset times during somatosensory stimulation in rat. Proc. Natl. Acad. Sci. U. S. A. 99, 15182–7 (2002)
[5] Yu, X., Qian, C., Chen, D., Dodd, S. J. & Koretsky, A. P. Deciphering laminar-specific neural inputs with line- scanning fMRI. Nat. Methods 11, 55–8 (2014)
[6] Albers, F., Schmid, F., Wachsmuth, L. & Faber, C. Line scanning fMRI reveals earlier onset of optogenetically evoked BOLD response in rat somatosensory cortex as compared to sensory stimulation. Neuroimage 1–11 (2016). doi:10.1016/j.neuroimage.2016.12.059
[7] Piscopo, D. M., El-Danaf, R. N., Huberman, A. D. & Niell, C. M. Diverse visual features encoded in mouse lateral geniculate nucleus. J. Neurosci. 33, 4642–4656 (2013).
[8] Seabrook, T. A., Burbridge, T. J., Crair, M. C. & Huberman, A. D. Architecture, Function, and Assembly of the Mouse Visual System. Annual Review of Neuroscience 40, 499–538 (2017)
[9] Gao, E., DeAngelis, G. C. & Burkhalter, A. Parallel input channels to mouse primary visual cortex. J. Neurosci. 30, 5912–5926 (2010)
[10] Niendorf, Thoralf, et al. "Advancing cardiovascular, neurovascular and renal magnetic resonance imaging in small rodents using cryogenic radiofrequency coil technology." Frontiers in pharmacology 6 (2015): 255
[11] Baltes, Christof, et al. "Micro MRI of the mouse brain using a novel 400 MHz cryogenic quadrature RF probe." NMR in Biomedicine: An International Journal Devoted to the Development and Application of Magnetic Resonance In vivo22.8 (2009): 834-842
[12] Nunes, Daniel, Andrada Ianus, and Noam Shemesh. "Layer-specific connectivity revealed by diffusion-weighted functional MRI in the rat thalamocortical pathway." NeuroImage 184 (2019): 646-657
[13] Boorman, L. et al. Long-Latency Reductions in Gamma Power Predict Hemodynamic Changes That Underlie the Negative BOLD Signal. J. Neurosci. 35, 4641–4656 (2015)
[14] He, Y. et al. Ultra-Slow Single-Vessel BOLD and CBV-Based fMRI Spatiotemporal Dynamics and Their Correlation with Neuronal Intracellular Calcium Signals. Neuron 97, 925-939.e5 (2018)
[15] Cauli, B. Revisiting the role of neurons in neurovascular coupling. Front. Neuroenergetics 2, 1–8 (2010)
[16] Mishra, A. et al. Astrocytes mediate neurovascular signaling to capillary pericytes but not toarterioles. Nat. Neurosci. 19, 1619–1627 (2016)
[17] Logothetis, N. K., Pauls, J., Augath, M., Trinath, T. & Oeltermann, A. Neurophysiological investigation of the basis of the fMRI signal. Nature 412, 150–157 (2001)
[18] Mukamel, R. et al. Coupling between neuronal firing, field potentials, and FMRI in human auditory cortex. Science 309, 951–954 (2005)
[19] Logothetis, N. K. & Wandell, B. a. Interpreting the BOLD signal. Annu. Rev. Physiol. 66, 735–769 (2004)
[20] Nir, Y. et al. Coupling between Neuronal Firing Rate, Gamma LFP, and BOLD fMRI Is Related to Interneuronal Correlations. Curr. Biol. 17, 1275–1285 (2007)
[21] Logothetis, N. K. The ins and outs of fMRI signals. Nat. Neurosci. 10, 1230–1232 (2007)
[22] Devor, A. et al. Coupling of the cortical hemodynamic response to cortical and thalamic neuronal activity. Proc. Natl. Acad. Sci. U. S. A. 102, 3822–3827 (2005)
[23] Viswanathan, A. et al. Neurometabolic coupling in cerebral cortex reflects synaptic more than spiking activity. Nat. Neurosci. 10, 201504327 (2016)
[24] McAfee, S. S., Liu, Y., Dhamala, M. & Heck, D. H. Thalamocortical communication in the awake mouse visual system involves phase synchronization and rhythmic spike synchrony at high gamma frequencies. Front. Neurosci. 12, 1–10 (2018)
[25] Schulz, K. et al. Simultaneous BOLD fMRI and fiber-optic calcium recording in rat neocortex. Nat. Methods 9, 597– 602 (2012)
[26] Tian, P. et al. Cortical depth-specific microvascular dilation underlies laminar differences in blood oxygenation level-dependent functional MRI signal. Proc. Natl. Acad. Sci. 107, 15246–15251 (2010)
[27] Uhlirova, H. et al. Cell type specificity of neurovascular coupling in cerebral cortex. Elife 5, 1–23 (2016).
Figures