1347
Validation of MRI-based Oxygen Extraction Fraction (OEF) Measurement with 15O Positron Emission Tomography1Department of Radiology, Johns Hopkins University School of Medicine, Baltimore, MD, United States, 2Research Imaging Institute, University of Texas Health Science Center at San Antonio, San Antonio, TX, United States, 3Siemens Healthineers, Baltimore, MD, United States
Synopsis
Cerebral oxygen extraction fraction (OEF) is a potential biomarker in various diseases. The current gold standard to measure OEF is 15O-PET, but its clinical applications are impeded by inherent limitations. To facilitate broader clinical applications of OEF as a disease biomarker, in this work, we compared the whole-brain OEF measurement of a non-invasive MRI technique, T2-relaxation-under-spin-tagging (TRUST), with the gold standard PET measurement, and demonstrated a strong linear correlation and no systematic difference between the two methods.
INTRODUCTION
Cerebral oxygen extraction fraction (OEF), even only measured at a whole-brain level, has been demonstrated to be a potential biomarker in various diseases, such as Alzheimer’s diseases,1 moyamoya,2 and multiple sclerosis.3 The current gold standard to measure OEF is positron emission tomography (PET) with 15O-labeled radiotracers.4 However, challenges of using 15O-PET to measure OEF include its highly invasive procedures, exposure to radiation, and the requirement of an onsite cyclotron. T2-relaxation-under-spin-tagging (TRUST) is a widely used MRI technique to measure whole-brain OEF non-invasively.5,6 The advantages of TRUST include its short scan time (1.2min), excellent reproducibility7 and great scalability across multiple sites8 and across different vendors.9 To facilitate broader clinical applications of OEF as a disease biomarker, in this work, our goal is to validate the TRUST whole-brain OEF estimation by comparing it with gold standard 15O-PET measurements.METHODS
ParticipantsFifteen healthy adult subjects (8M/7F, 27.6±5.1 years old) were scanned on a 3T MRI scanner (Trio, Siemens) and a PET scanner (CTI HR+, Siemens) on the same day. The MRI and PET scans were 1.5-3 hours apart. The hematocrit level of each subject was measured from venous blood samples collected before the PET scans.
MRI Experiment
The whole-brain OEF of each subject was measured using TRUST with the following parameters6: FOV=220×220mm2, voxel-size=3.4×3.4×5.0mm3, TR=3s, TI=1.02s and scan time=1.2min. Each subject underwent three TRUST scans. The arterial oxygenation level (Ya) of each subject was measured with a pulse oximeter during the TRUST scans. An MPRAGE scan was also performed.
PET Experiment
Each PET experiment included a calibration scan for attenuation correction and three actual scans using different radiotracers: inhalation of 15O-labeled carbon monoxide (C15O) to estimate cerebral blood volume (CBV); injection of 15O-labeled water (H215O) to measure cerebral blood flow (CBF); and inhalation of 15O-labeled oxygen (15O2) to measure oxygen uptake, which can be converted to OEF by combining it with CBF and CBV.4 The scan durations were 8min, 3.3min and 3.3min for the C15O, H215O and 15O2 PET scans, respectively. An interval about 10min was waited between two consecutive scans to allow for radioactive decay (note: half-life of 15O is 122s) and preparation of the next radiotracer. Arterial blood samples were collected continuously (at an interval of 5-10 sec) during the PET scans to determine the arterial-input-function. In a subset of 8 subjects (4M/4F), the PET experiment was repeated once to evaluate the reproducibility of PET whole-brain OEF measurements.
MRI Data Processing
For TRUST, whole-brain cerebral venous oxygenation (Yv) was computed following previous literature,5,6 based on the subject-specific measured hematocrit level. Then, the TRUST whole-brain OEF was calculated as:
$$OEF_{TRUST}=\frac{Y_a-Y_v}{Y_a}\times100\%$$
where Ya was measured by pulse oximetry. OEF values from three TRUST MRI scans were averaged before comparison with PET.
PET Data Processing
For PET, CBV, CBF and OEF maps were calculated following established procedures.4 A whole-brain mask was obtained from segmentation of the MPRAGE MRI images and then transformed to the PET image space. Non-zero values in the PET OEF map were averaged to yield a whole-brain average value.
Statistical Analysis
A paired Student’s t-test was utilized to examine whether there was a systematic difference between TRUST and PET whole-brain OEF values. Correspondence between TRUST and PET was evaluated with Pearson correlation. Bland-Altman analysis was also used to examine the difference between TRUST and PET.
To evaluate the test-retest reproducibility of each technique, we calculated the coefficient-of-variation (CoV) for TRUST and PET whole-brain OEF measures in the subset of 8 subjects who had two runs of PET experiments. CoVs were compared by a paired t-test between TRUST and PET.
RESULTS AND DISCUSSION
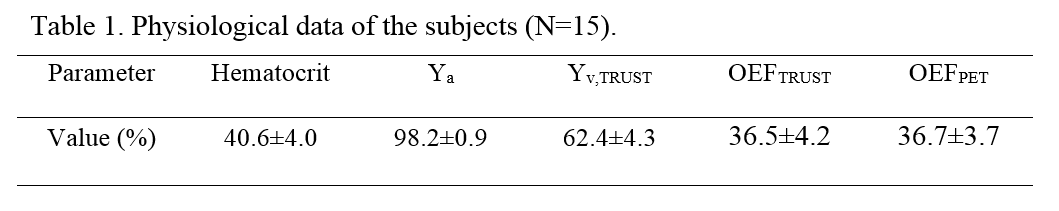
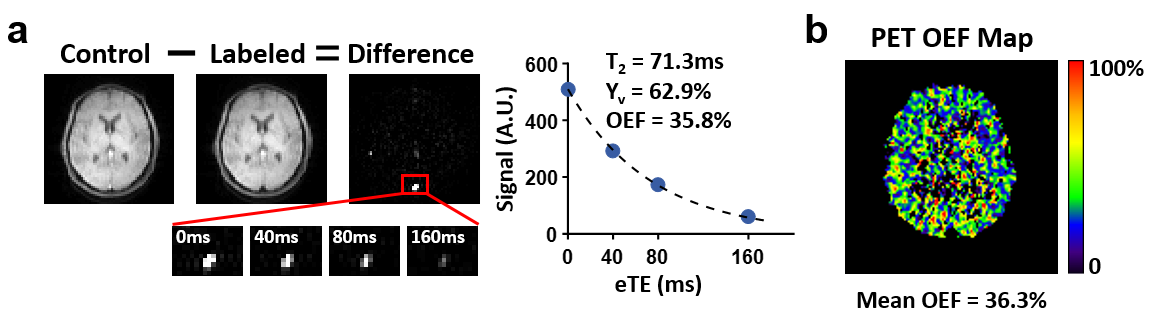
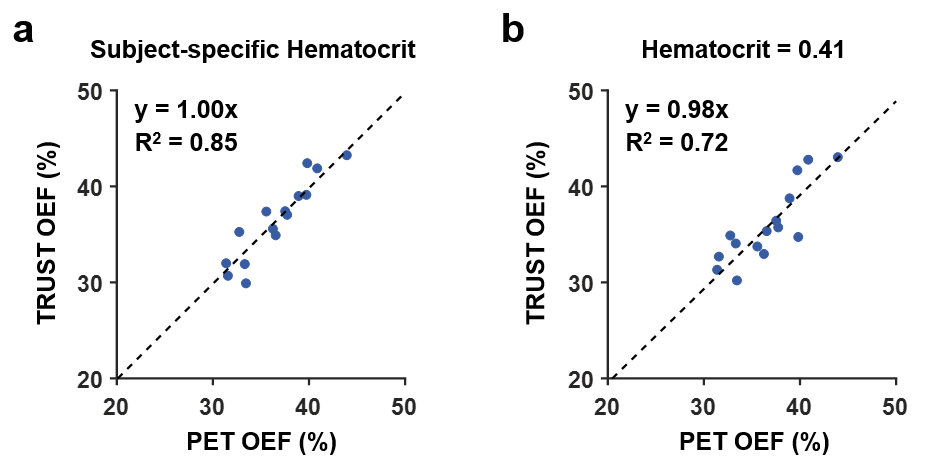
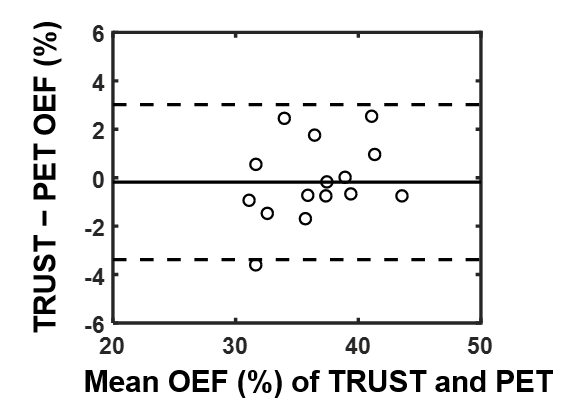
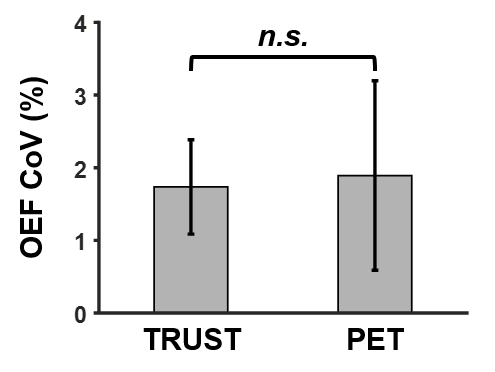
Figure 1 presents the TRUST and PET data of a representative subject. Table 1 summarizes the physiological data of the subjects. Across the 15 subjects, the mean whole-brain OEF of TRUST and PET (first run) were 36.5±4.2% and 36.7±3.7%, respectively, which agreed well with previous literature using TRUST7,10,11 or 15O-PET.12,13 Paired t-test revealed no difference between TRUST and PET whole-brain OEF values (P=0.67). Figure 2a displays a scatter plot between TRUST and PET whole-brain OEF, showing a strong linear correlation (R2=0.85, P<10-6). Figure 3 shows a Bland-Altman plot comparing TRUST and PET whole-brain OEF values.The CoVs of TRUST and PET whole-brain OEF measurements were 1.7±0.7% and 1.9±1.3%, respectively, showing no difference (P=0.74, Figure 4). Our CoVs were slightly lower than previous literature which reported a CoV of 3.2±1.2% for TRUST7 and 5.7±4.4% for PET OEF measurements.14
As an additional analysis, we also tested the role of hematocrit in the estimation of OEF with TRUST MRI. We re-analyzed the data by assuming a fixed hematocrit of 0.41 for all subjects (rather than using subject-specific values). As shown in Figure 2b, the correlation between TRUST and PET became weaker (although still significant). These results suggest that knowledge of subject-specific hematocrit is useful in improving the accuracy of OEF measurement with TRUST MRI.
CONCLUSION
This work demonstrated that whole-brain OEF measured by TRUST was strongly correlated with that measured by gold standard 15O-PET, with highly comparable accuracy and reproducibility. These findings suggest that TRUST MRI can provide accurate non-invasive quantification of whole-brain OEF.Acknowledgements
No acknowledgement found.References
1. Thomas BP, Sheng M, Tseng BY, Tarumi T, Martin-Cook K, Womack KB, Cullum MC, Levine BD, Zhang R, Lu H. Reduced global brain metabolism but maintained vascular function in amnestic mild cognitive impairment. J Cereb Blood Flow Metab 2017;37:1508-1516.
2. Watchmaker JM, Juttukonda MR, Davis LT et al. Hemodynamic mechanisms underlying elevated oxygen extraction fraction (OEF) in moyamoya and sickle cell anemia patients. J Cereb Blood Flow Metab 2018;38:1618-1630.
3. Ge Y, Zhang Z, Lu H, Tang L, Jaggi H, Herbert J, Babb JS, Rusinek H, Grossman RI. Characterizing brain oxygen metabolism in patients with multiple sclerosis with T2-relaxation-under-spin-tagging MRI. J Cereb Blood Flow Metab 2012;32:403-412.
4. Mintun MA, Raichle ME, Martin WR, Herscovitch P. Brain oxygen utilization measured with O-15 radiotracers and positron emission tomography. J Nucl Med 1984;25:177-187.
5. Lu H, Ge Y. Quantitative evaluation of oxygenation in venous vessels using T2-Relaxation-Under-Spin-Tagging MRI. Magn Reson Med 2008;60:357-363.
6. Xu F, Uh J, Liu P, Lu H. On improving the speed and reliability of T2-relaxation-under-spin-tagging (TRUST) MRI. Magn Reson Med 2012;68:198-204.
7. Liu P, Xu F, Lu H. Test-retest reproducibility of a rapid method to measure brain oxygen metabolism. Magn Reson Med 2013;69:675-681.
8. Liu P, Dimitrov I, Andrews T et al. Multisite evaluations of a T2-relaxation-under-spin-tagging (TRUST) MRI technique to measure brain oxygenation. Magn Reson Med 2016;75:680-687.
9. Jiang D, Liu P, Li Y, Mao D, Xu C, Lu H. Cross-vendor harmonization of T2-relaxation-under-spin-tagging (TRUST) MRI for the assessment of cerebral venous oxygenation. Magn Reson Med 2018;80:1125-1131.
10. Xu F, Uh J, Brier MR, Hart J, Jr., Yezhuvath US, Gu H, Yang Y, Lu H. The influence of carbon dioxide on brain activity and metabolism in conscious humans. J Cereb Blood Flow Metab 2011;31:58-67.
11. Xu F, Liu P, Pascual JM, Xiao G, Lu H. Effect of hypoxia and hyperoxia on cerebral blood flow, blood oxygenation, and oxidative metabolism. J Cereb Blood Flow Metab 2012;32:1909-1918.
12. Perlmutter JS, Powers WJ, Herscovitch P, Fox PT, Raichle ME. Regional asymmetries of cerebral blood flow, blood volume, and oxygen utilization and extraction in normal subjects. J Cereb Blood Flow Metab 1987;7:64-67.
13. Hatazawa J, Fujita H, Kanno I et al. Regional cerebral blood flow, blood volume, oxygen extraction fraction, and oxygen utilization rate in normal volunteers measured by the autoradiographic technique and the single breath inhalation method. Ann Nucl Med 1995;9:15-21.
14. Coles JP, Fryer TD, Bradley PG, Nortje J, Smielewski P, Rice K, Clark JC, Pickard JD, Menon DK. Intersubject variability and reproducibility of 15O PET studies. J Cereb Blood Flow Metab 2006;26:48-57.
Figures