1346
Simultaneous fMRI/fMRE reveals BOLD and viscoelastic changes in the cerebellum during motor planning1Bioengineering, Stanford University, Stanford, CA, United States, 2Radiology, Mayo Clinic, Rochester, MN, United States, 3Radiology, Stanford University, Stanford, CA, United States
Synopsis
In this work, we demonstrate the first fMRE (functional MR elastography) activation in the cerebellum using a motor planning task. A block paradigm of 24s ON (auditory-cued button pressing) and 24s OFF (rest) was used and images were acquired with a single-shot spin-echo EPI MRE sequence. Our results show that tissue stiffness within the cerebellum increases with motor planning. Furthermore, the stiffness and BOLD activation colocalize in the cerebellum but do not match exactly, suggesting that the two modalities may reveal different aspects of the mechanisms for neural activation.
Introduction
Previously we demonstrated robust simultaneous fMRI and fMRE (functional MR elastography) activation in the human visual cortex using a multi-modal time series method1. In this study, we sought to demonstrate stiffness changes in regions of the brain other than the visual cortex. Using a block design paradigm, we were able to observe increases in shear modulus within the cerebellum due to motor planning for the first time and compare it to the simultaneously acquired fMRI results.Methods
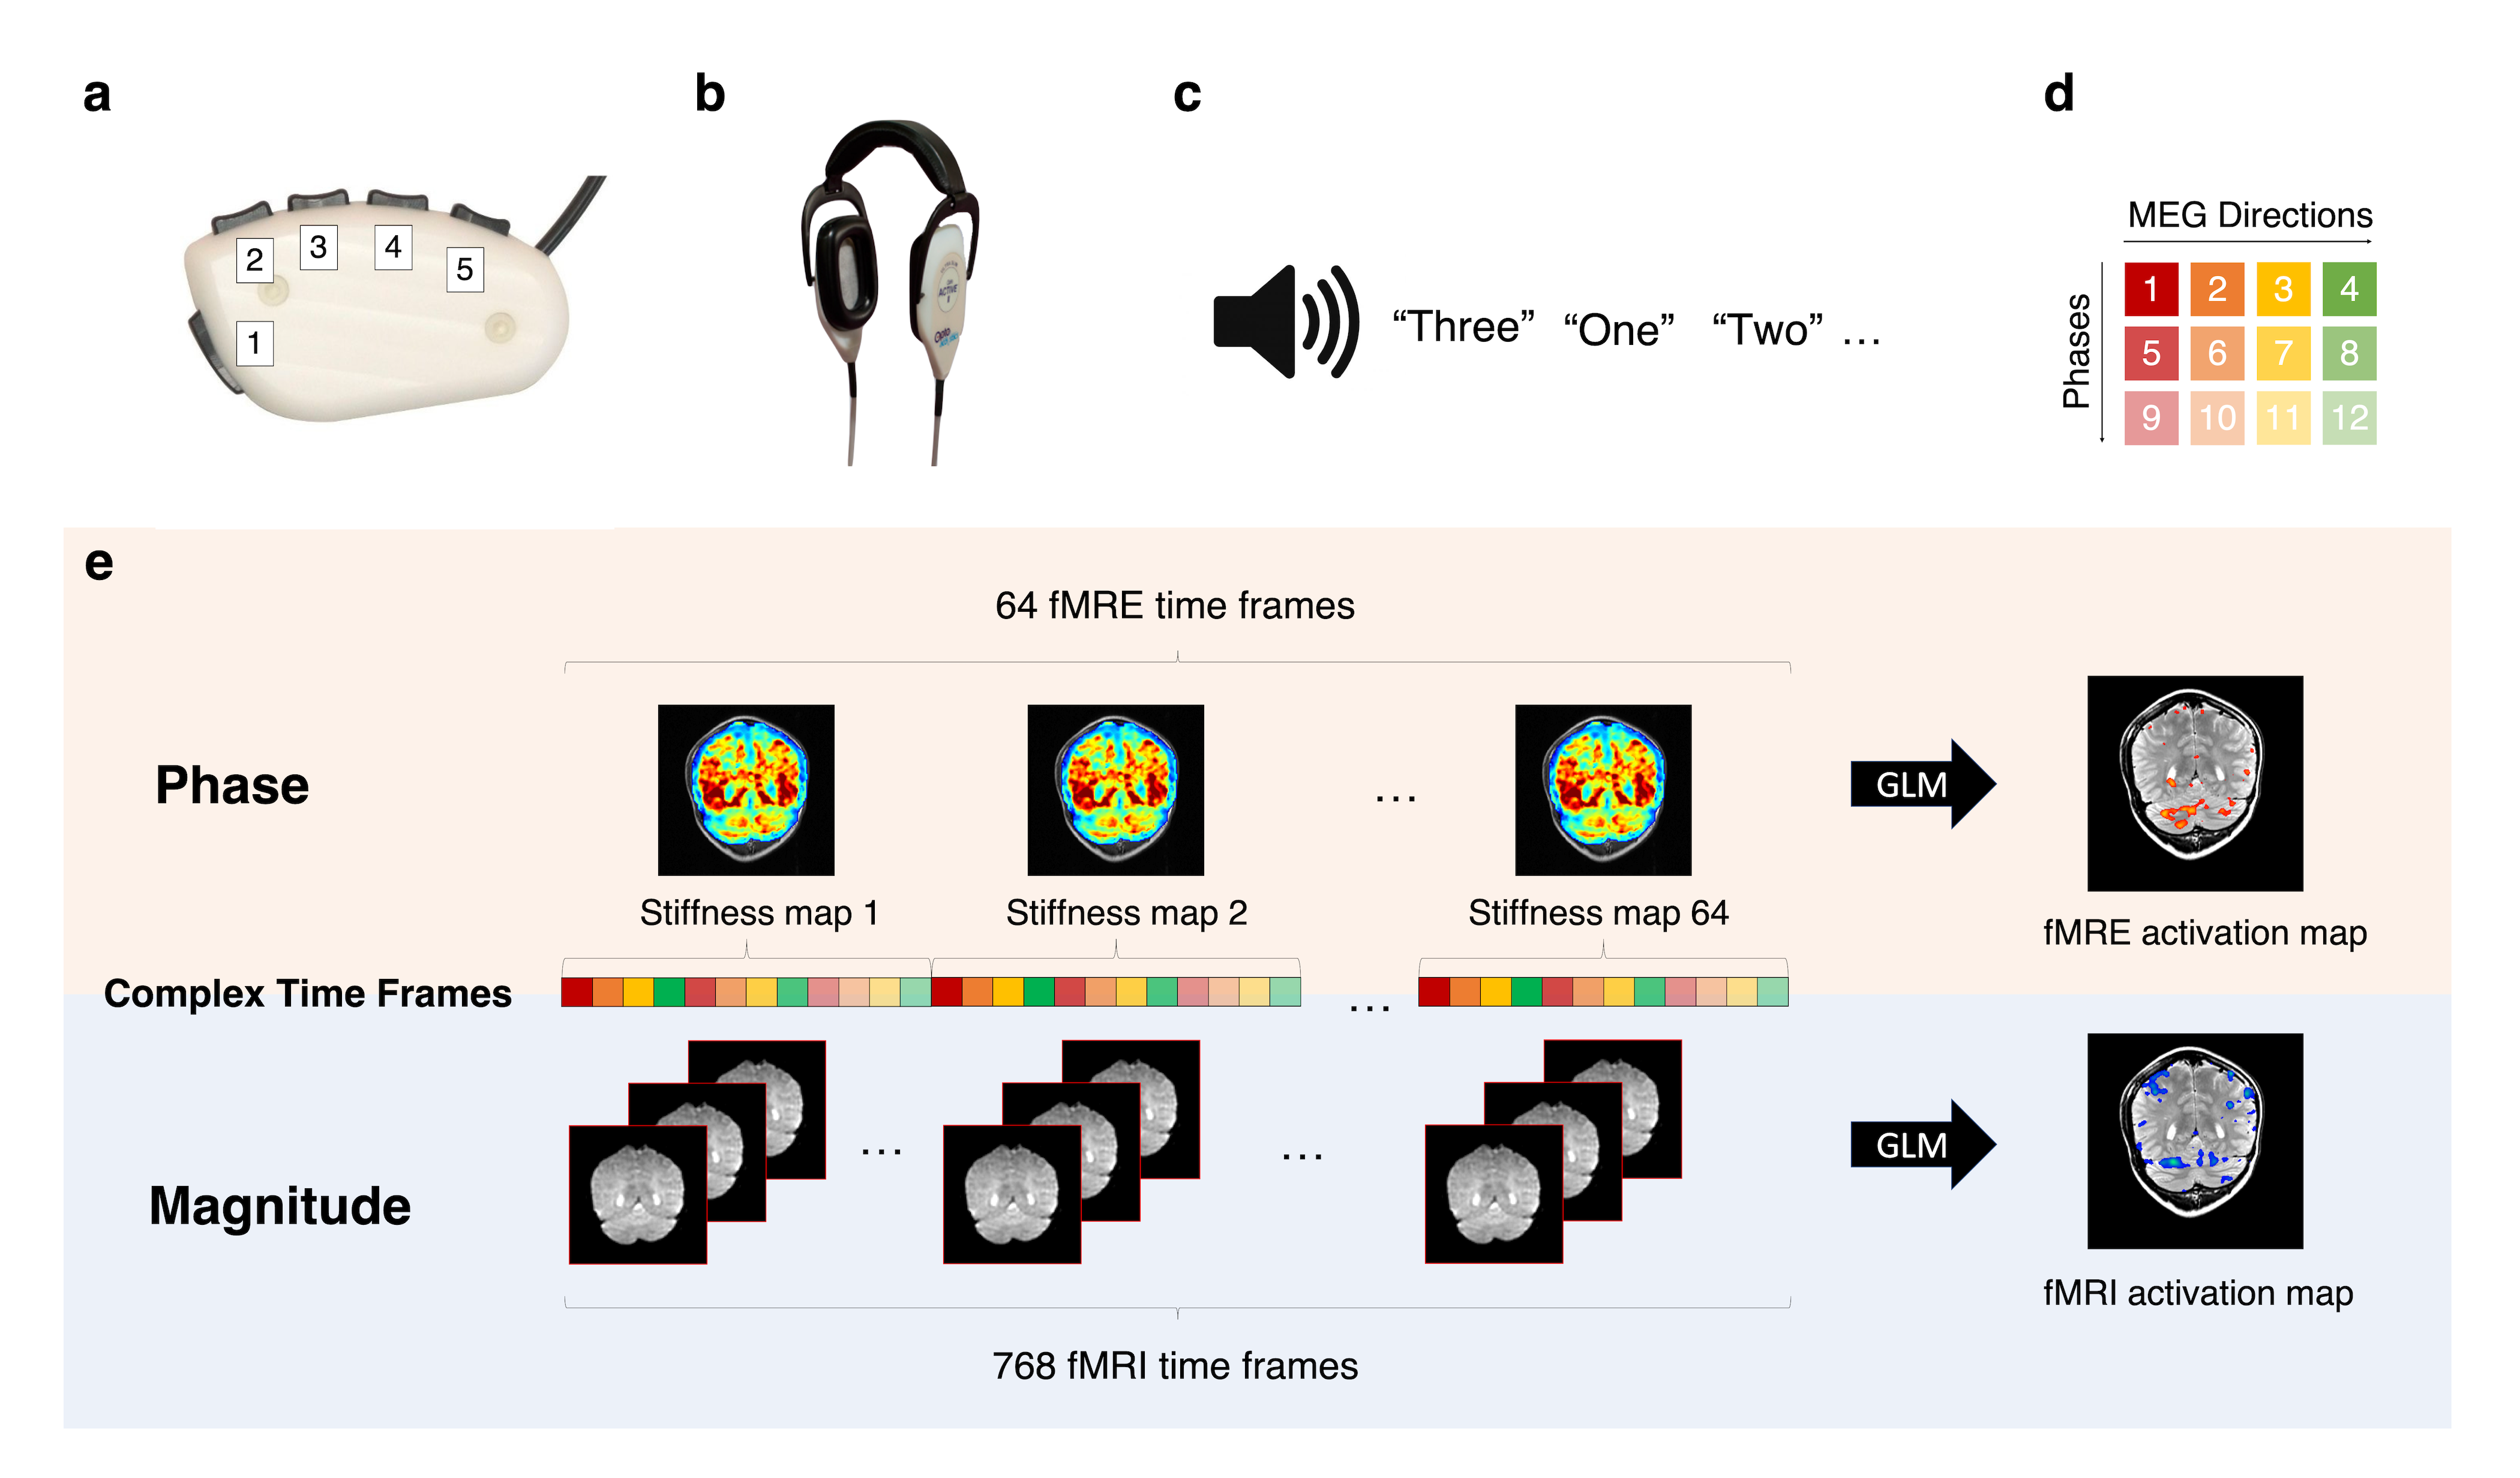
Experimental setup:The functional scans were acquired using a block design paradigm, with 32 alternating on and off blocks (each 24s) for a total scan time of 768s. The healthy volunteer was given a button box (Fig. 1a) and noise-canceling headphones (Fig. 1b) and instructed to keep their eyes closed for the entire experiment. The on block consisted of a motor planning task, where randomly generated numbers between 1 and 3 were used as audio cues for corresponding finger presses (Fig. 1c). The experiment was conducted for both the right and left hands in separate scans. Using auditory cues avoided the confound of activating the visual cortex adjacent to the cerebellum.
Data Acquisition:
A pillow-like passive driver placed under the subject’s head was used to induce 60-Hz shear waves in the brain as described by Murphy et al.2 Data were acquired on a 3T, GE, Discovery MR-750 scanner, with a standard 8-channel coil, using a single-shot, spin-echo EPI MRE sequence with the following parameters: 12 contiguous oblique slices, TR/TE=1000/64.5ms, FOV=22cm, BW=+/-250kHz, 72x72 imaging matrix reconstructed to 128x128, 2x ASSET acceleration, 3.5-mm thick slices, Hadamard motion-encoding (4 directions of motion-encoding gradients (MEGs)), and 3 phase offsets sampled over one period of motion at 60Hz. The sequence of 4 MEGs x 3 phases (Fig. 1d) resulted in a 12s fMRE repetition time (TRfMRE=12s) and was repeated 64 times for a total acquisition time of 768s (Fig. 1e). The slice prescription spanned both the cerebellum and the motor cortex (approaching coronal).
Processing & Analysis:
From the phase information, complex-valued images containing the motion in the X, Y, and Z directions were calculated from the 4 MEG directions. These volumes were smoothed in the Z direction using a 1D, 4th-order, Butterworth, low-pass filter with a cut-off frequency of 3 cycles per FOVz to reduce potential slice-to-slice phase jitter. The complex-valued shear modulus was then calculated using a direct inversion of the Helmholtz wave equation as described by Murphy et al. The final stiffness images for the fMRE time series were generated as the absolute value of the complex shear modulus2,3. The fMRI time series was generated by taking the magnitude of the T2-weighted raw spin-echo images (TRfMRI=1s).
Statistical analysis was performed with the general linear model (GLM) using FSL FEAT4,5 to generate activation maps. The fMRI hemodynamic response function (HRF) is the canonical double gamma variate; the fMRE viscoelastic response function (VRF) is the single gamma variate with $$$\alpha$$$=8s (modeled in our previous fMRE study in the visual cortex1).
Results and Discussion
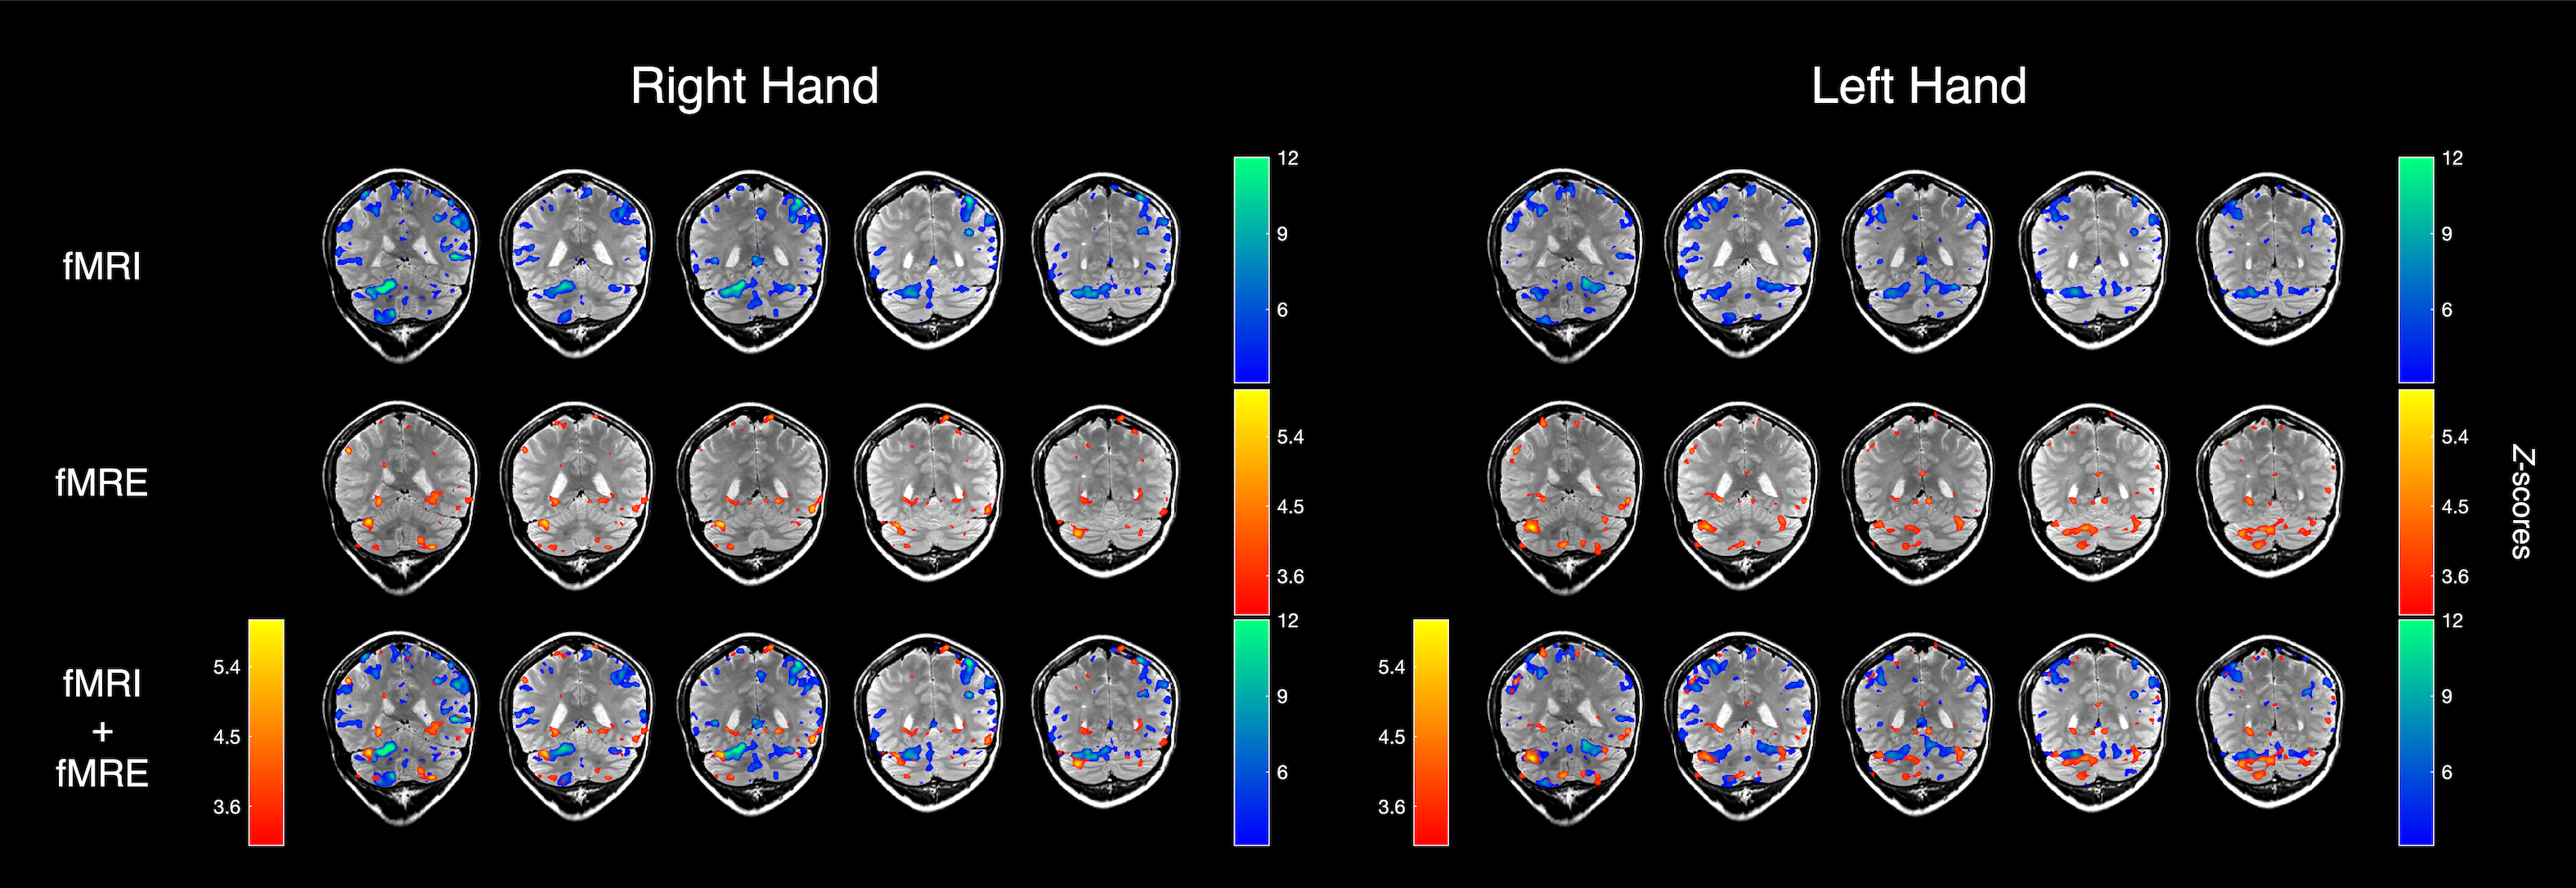
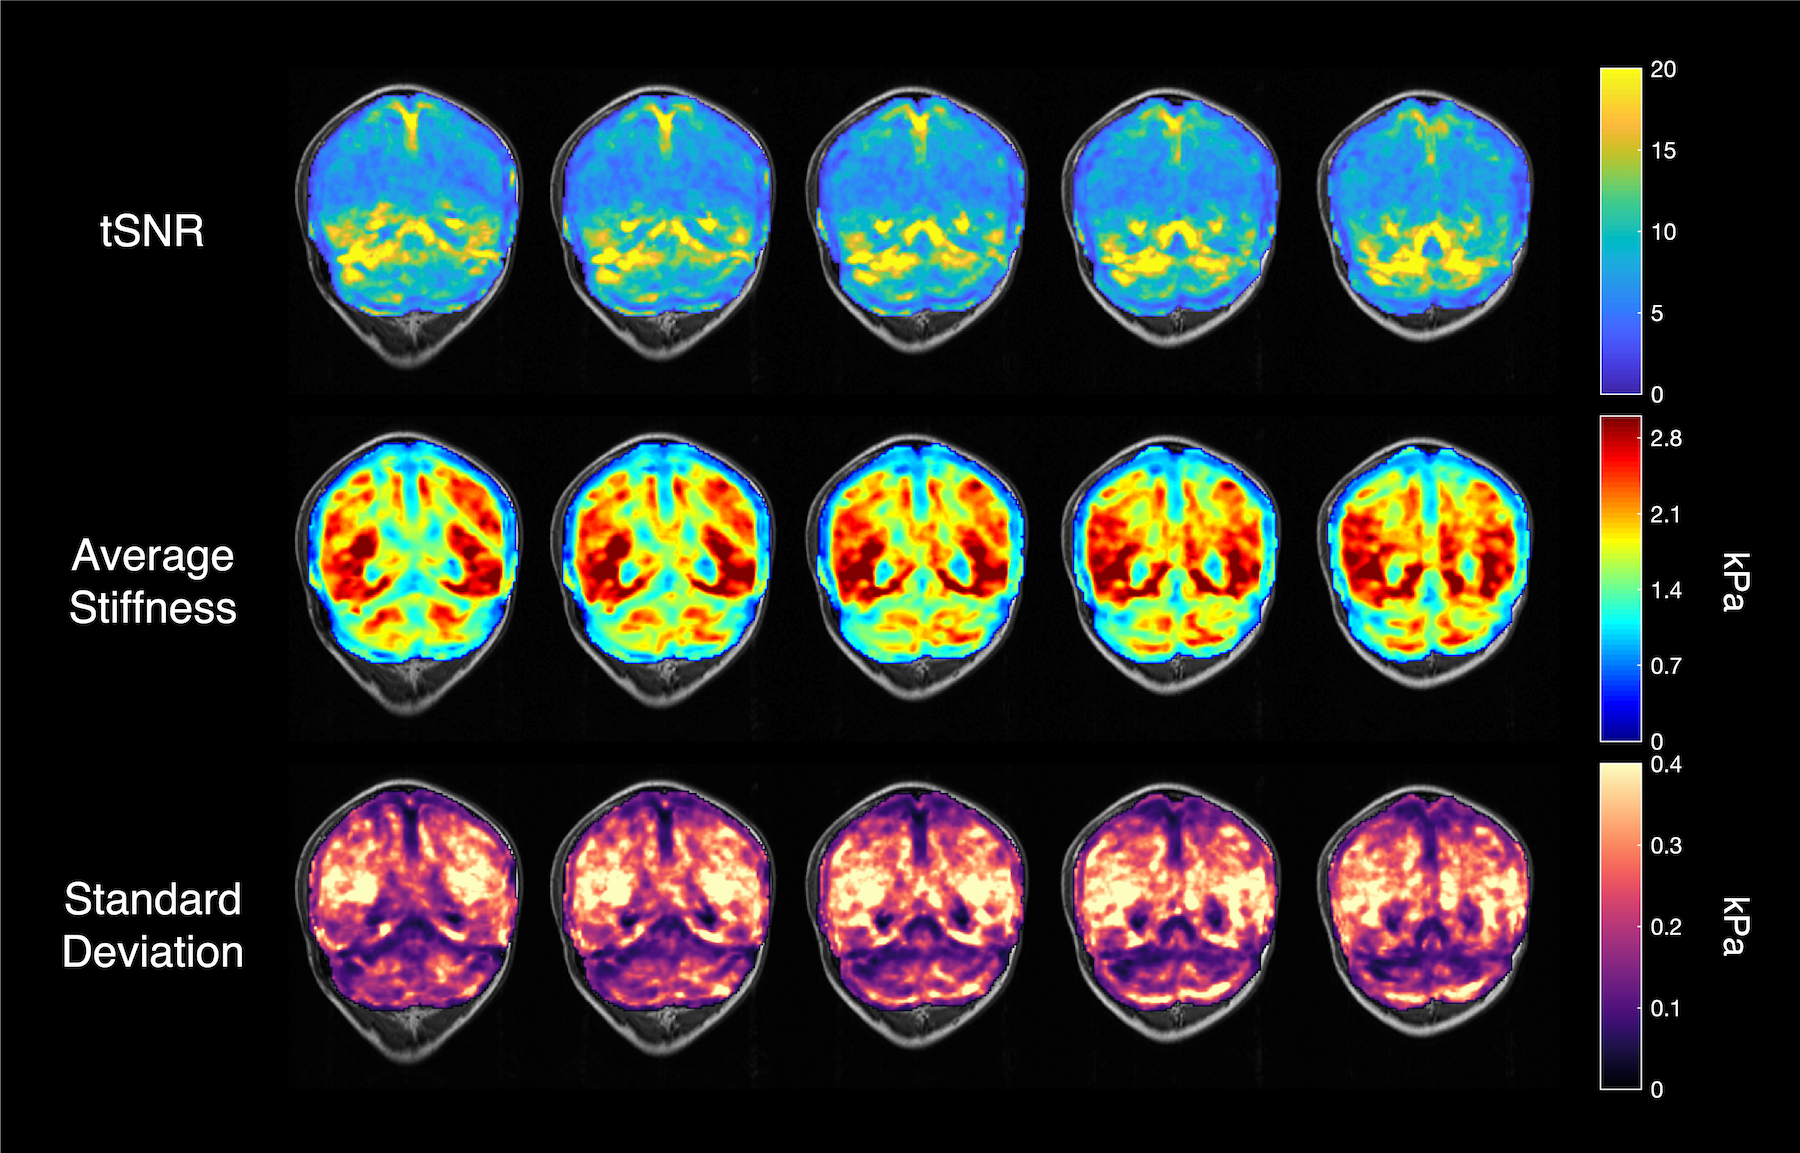
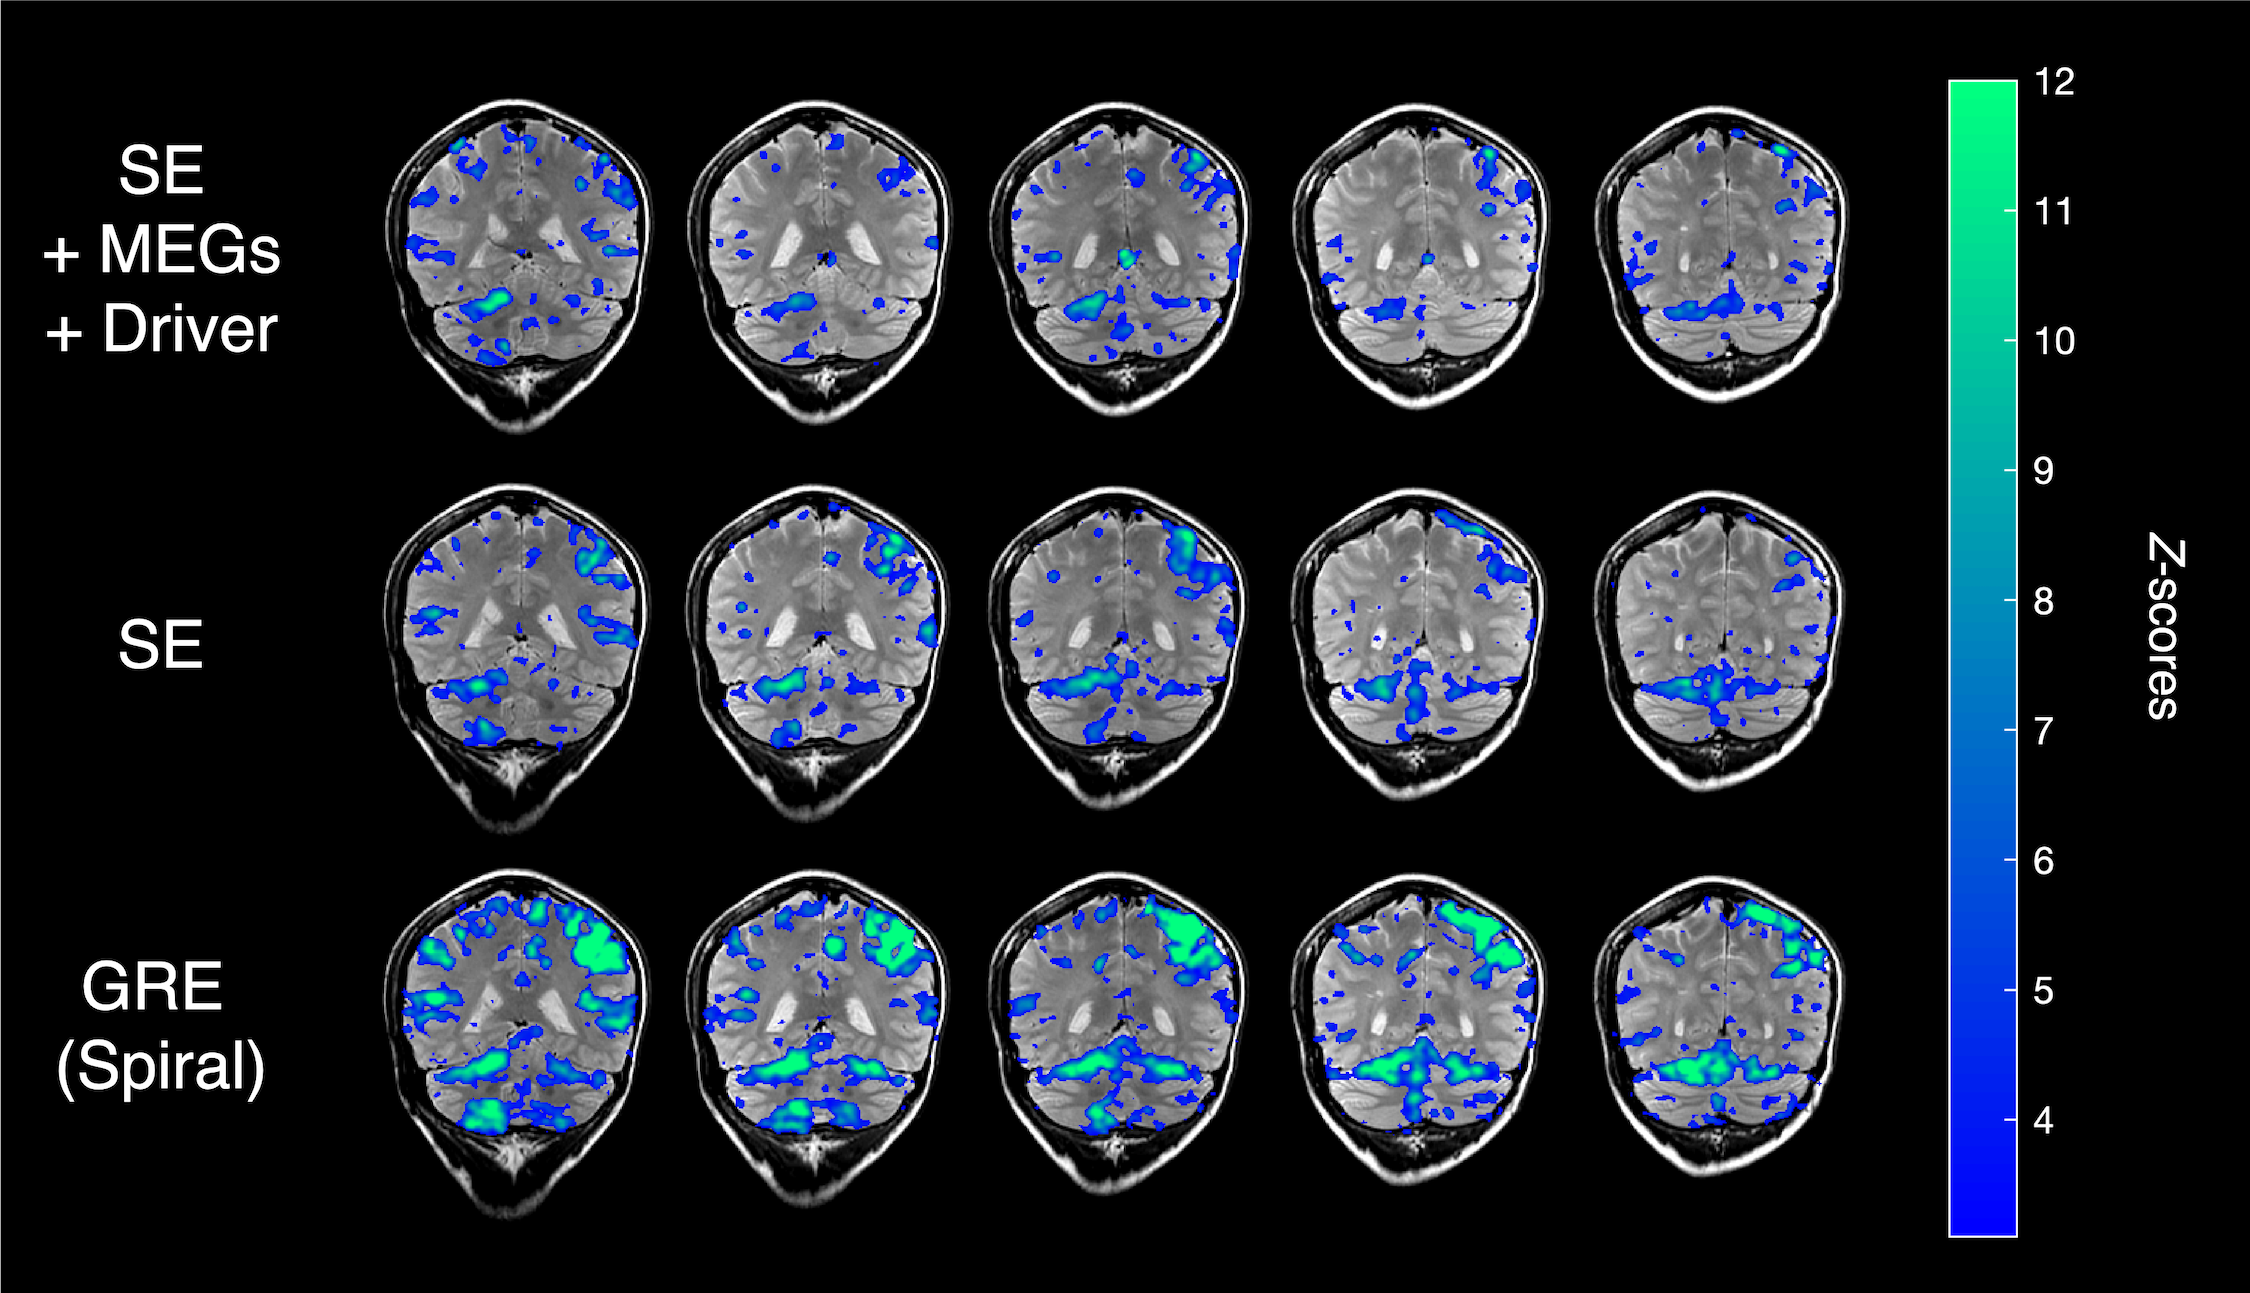
The fMRE activation maps show spatially localized stiffness increases in the cerebellum during a motor planning task (Fig. 2), but not in the motor cortex. The absence of fMRE activation in the motor cortex is likely due to the low stiffness-to-noise ratio in that region (Fig. 3) compared to regions like the visual cortex and the cerebellum. Even though the average stiffness of the cerebellum is lower than that of the motor cortex6, the smaller noise in the cerebellum makes its tSNR much higher than that of the motor cortex. Further investigation of methods to decrease the noise in the motor cortex can potentially reveal fMRE activation in the region.As expected from a motor planning task, BOLD-fMRI activation was observed in the cerebellum (ipsilateral for the right-hand task, bilateral for the left-hand task) and the motor cortex (contralateral for both hands). We conducted the same motor planning task with the right hand using three sequences: (1) spin-echo + MEGs + driver, as in our MRE experiments, (2) spin-echo without MEGs + driver, (3) gradient-echo with spiral readout. As anticipated, BOLD activation is the strongest with GRE and weakest with SE + MEGs + driver (Fig. 4). These comparisons between different sequences helped verify that BOLD activation from our MRE experiments have the same spatial pattern as that of standard gradient-echo BOLD.
By overlaying the activation maps from the two modalities (Fig. 2), we see that the stiffness activation colocalizes with the BOLD activation in the cerebellum, but do not match exactly. This suggests that our understanding of neural signaling may be enriched by combining the two vastly different modalities.
Conclusion
In this study, we demonstrated the first fMRE activation in the cerebellum using a motor planning task and our previously developed fMRI/fMRE time series method. The stiffness-to-noise ratio maps suggest that further work to reduce reconstruction noise in the motor cortex may be necessary to see fMRE activation in the region.Acknowledgements
Funding supplied by NIH-P41EB01589 and NIH-EB001981. We acknowledge Karla Epperson’s expertise in setting up the Resoundant pneumatic driver system.References
1. Lan PS, Glaser KJ, Ehman RL, Glover GH. Simultaneous fMRE and fMRI measures the viscoelastic and BOLD responses of the human brain to functional activation in the visual cortex. ISMRM 27th Annual Meeting 2019:206.
2. Murphy MC, Huston J, Jack CR, Glaser KJ, Manduca A, Felmlee JP, Ehman RL. Decreased brain stiffness in Alzheimer's disease determined by magnetic resonance elastography. J Magn Reson Imaging 2011;34(3):494-498.
3. Manduca A, Oliphant TE, Dresner MA, Mahowald JL, Kruse SA, Amromin E, Felmlee JP, Greenleaf JF, Ehman RL. Magnetic resonance elastography: non-invasive mapping of tissue elasticity. Med Image Anal 2001;5(4):237-254.
4. Jenkinson M, Beckmann CF, Behrens TE, Woolrich MW, Smith SM. FSL. Neuroimage 2012;62(2):782-790.
5. Woolrich MW, Ripley BD, Brady M, Smith SM. Temporal autocorrelation in univariate linear modeling of FMRI data. Neuroimage 2001;14(6):1370-1386.
6. Zhang J, Green MA, Sinkus R, Bilston LE. Viscoelastic properties of human cerebellum using magnetic resonance elastography. J Biomech 2011;44(10):1909-1913.
Figures