1343
Diffusion functional MRI characterizes dynamical brain function in a neuropsychiatric disease model mouse1Keio University School of Medicine, Tokyo, Japan
Synopsis
We propose an analytical framework to characterize dynamic brain function in neuropsychiatric conditions by taking advantage of the technical aspects of diffusion functional MRI (DfMRI). The pipeline consists of local activity analysis with apparent diffusion coefficient (ADC) data, functional connectivity (FC) analysis with diffusion-weighted data (Sb1800), and ignition-driven mean integration (IDMI) analysis combining both. We illustrated its utility by analyzing model mice with an obsessive–compulsive disorder (OCD)-related behavior. The framework was successful in detecting hyperactivation and biased connectivity across the cortico-striato-thalamic circuitry. The IDMI analysis found unseen local activity-initiated propagation to the global network.
Introduction
Functional MRI (fMRI) based on a blood oxygenation-level dependent (BOLD) mechanism is a powerful tool for investigating whole brain connectivity as well as brain activity. However, the BOLD signal sometimes fails when neurovascular coupling is disrupted (e.g. cerebrovascular disease, astrocytic dysfunction, intake of drugs, such as anesthetized condition)1-3. Thus, BOLD-fMRI under these conditions may exhibited false-positive or false-negative findings of brain network and activity.An essential tool to resolve the drawback of BOLD-fMRI is diffusion fMRI (DfMRI) which has proposed a functional imaging technique as an alternative to BOLD-fMRI4. DfMRI has been shown to reflect neural activity more directly, compared with BOLD-fMRI, as DfMRI signals are not of vascular origin3-5. It suggests that DfMRI has an advantage to evaluate brain function regardless of the status of hemodynamic responses.
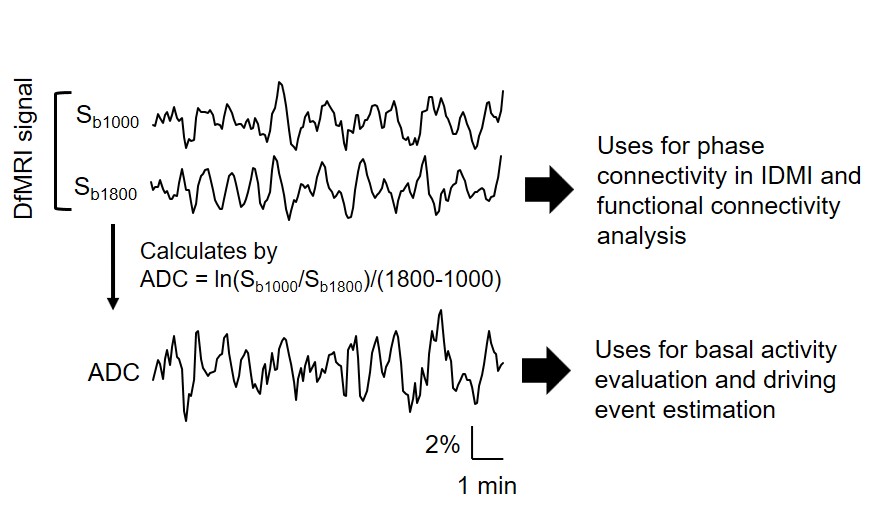
Here, by employing the technical advantages of DfMRI, we proposed the analytical framework to characterize dynamical brain function in neuropsychiatric disease model mice with an obsessive–compulsive disorder (OCD)-related behavior. The framework consists of three analyses; local activity analysis with water apparent diffusion coefficients (ADC) data, functional connectivity (FC) analysis with diffusion-weighted signal obtained with b=1800 s/mm² (Sb1800) data, and ignition-driven mean integration (IDMI) analysis with both data (Fig. 1).
Methods
Animal: We recruited astrocytic glutamate transporter (GLT1)-knockdown (KD) mice (GLASTCreERT2/+;GLT1 flox/flox, n=14)6. GLAST+/+;GLT1flox/flox mice were used as the control (ctl) mice (n=14). All animals were intraperitoneally injected with 100 mg/kg tamoxifen (TAM) at postnatal days 17-21 for consecutive five days to induce the deficit of GLT1.MRI acquisition: MRI were conducted under awake condition at 11.7T equipped with cryoprobe and a gradient system allowing a maximum gradient strength of 1000 mT/m. (BioSpec, Bruker). A detail method of awake MRI was previously described7. DfMRI images were acquired with the following parameters: diffusion-sensitized double spine echo (SE)-echo planner imaging (EPI) sequence; TR/TE=2000/37 ms, Resolution=0.2×0.2×0.8 mm3, Slice number=10, Repetition number=150, Scan time=10 min, and b-values=1000 and 1800 mm2/s along 1 directions; [X=1,Y=1,Z=1].
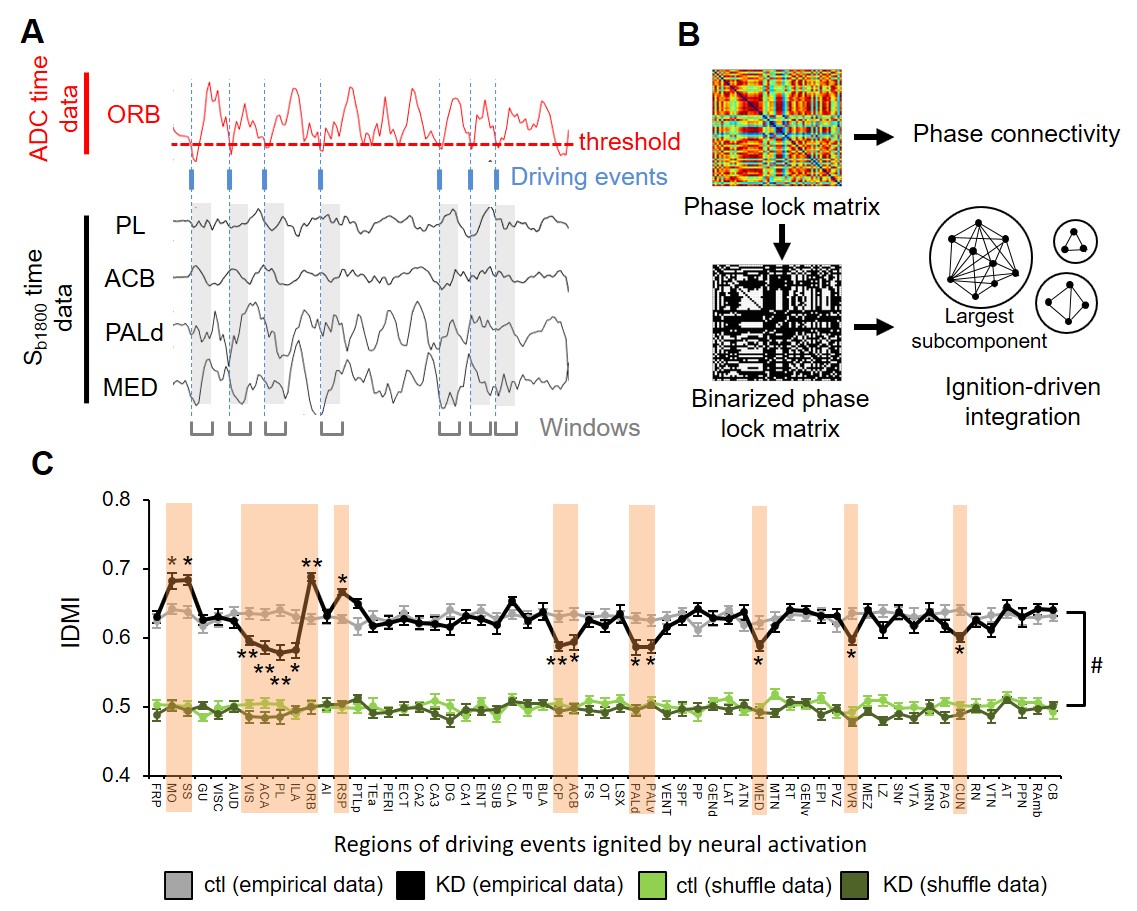
Analysis: Pre-processing (realignment, slice timing, normalization, and smoothing) and statistics were performed using SPM12. ADCs were calculated as ADC=ln(Sb1000/Sb1800)/800 and compared a magnitude of ADC for local activity3. FC was calculated using Sb1800 by CONN. ROIs of 59 bilateral brain loci were defined from the Allen Mouse Brain Atlas. IDMI analysis were referred as the previous literatures8,9. Briefly, intrinsic ignition events for each given brain region were determined using time points of up-regulation triggers of neural activation (ADC decrease). Then we calculated the IDMI value from the event-related phase synchronized connectivity of Sb1800 data (See Fig. 5A and B). The IDMI value reflects amounts of information propagation from local activity defined by the driving events to global network.
Results and Discussion
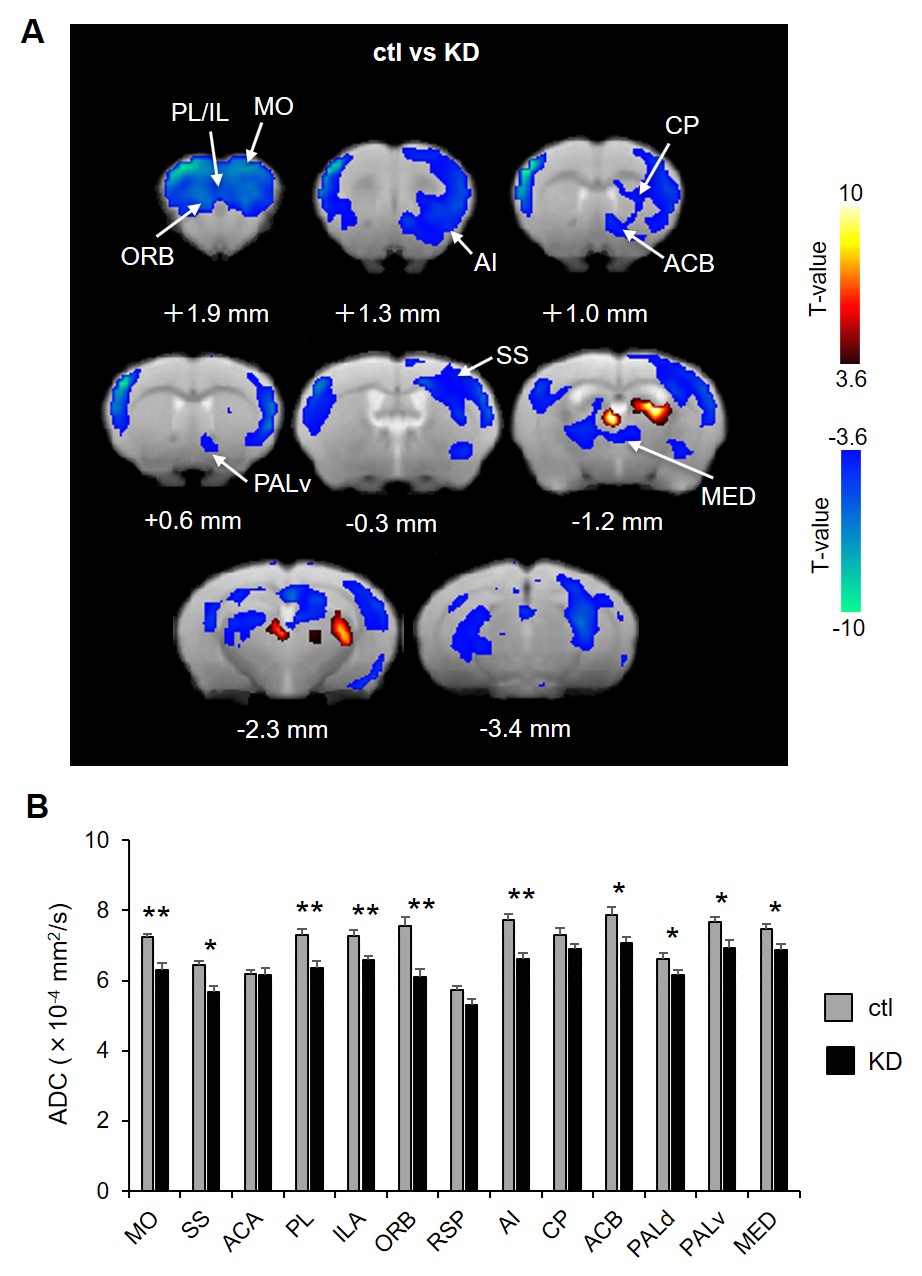
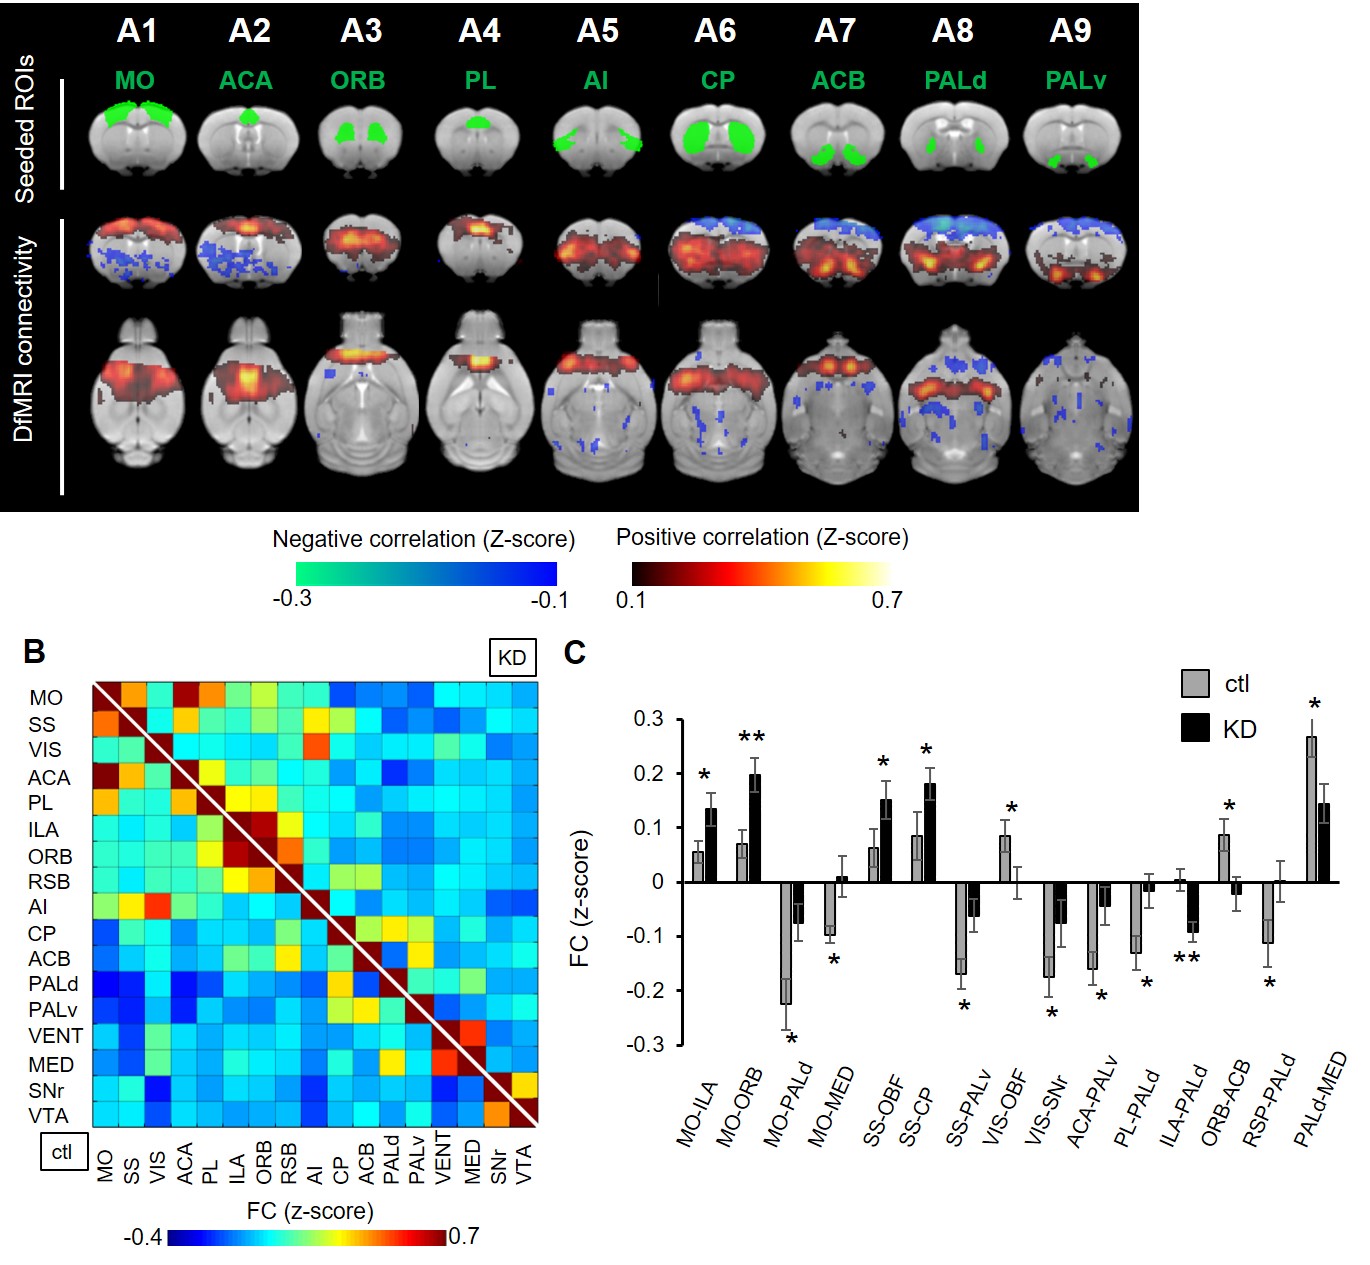
ADC values were used as a quantitative marker of neuronal activity without hemodynamic confound3,10. We compared ADC magnitude as local activity between the ctl and KD mice. Voxel based and ROI-based analysis found that ADCs were significantly decreased in motor cortex (MO), somatosensory cortex (SS), prelimbic area (PL), infralimbic area (ILA), orbitofrontal area (ORB), angular insular cortex (AI), Caudate-Putamen (CP), nuclear accumbens (ACB), ventral globus pallidus (PALv), medial group of the dorsal thalamus (MED) in the KD mice (Fig. 2). According to previous evidence that the ADC decrease reflected an increase of neural activity3, this result indicated that the KD mice exhibited hyperactivation of the cortico-striato-thalamic (CST) circuit. The previous electrophysiological study using the same KD mice confirmed hyperactivation at the striatum6.Next, we calculated FC as a pairwise Peason’s correlation of time-series Sb1800 between brain nodes, and then generated FC maps and matrix with the seeded bilateral ROIs (Fig. 3A and B). We found FC alterations in the CST circuit (Fig. 3C). From these results, local activity and FC analysis confirmed the hyperactivation and abnormal connectivity of CST circuit in the KD mice, as suggested from previous findings in OCD patients11-13.
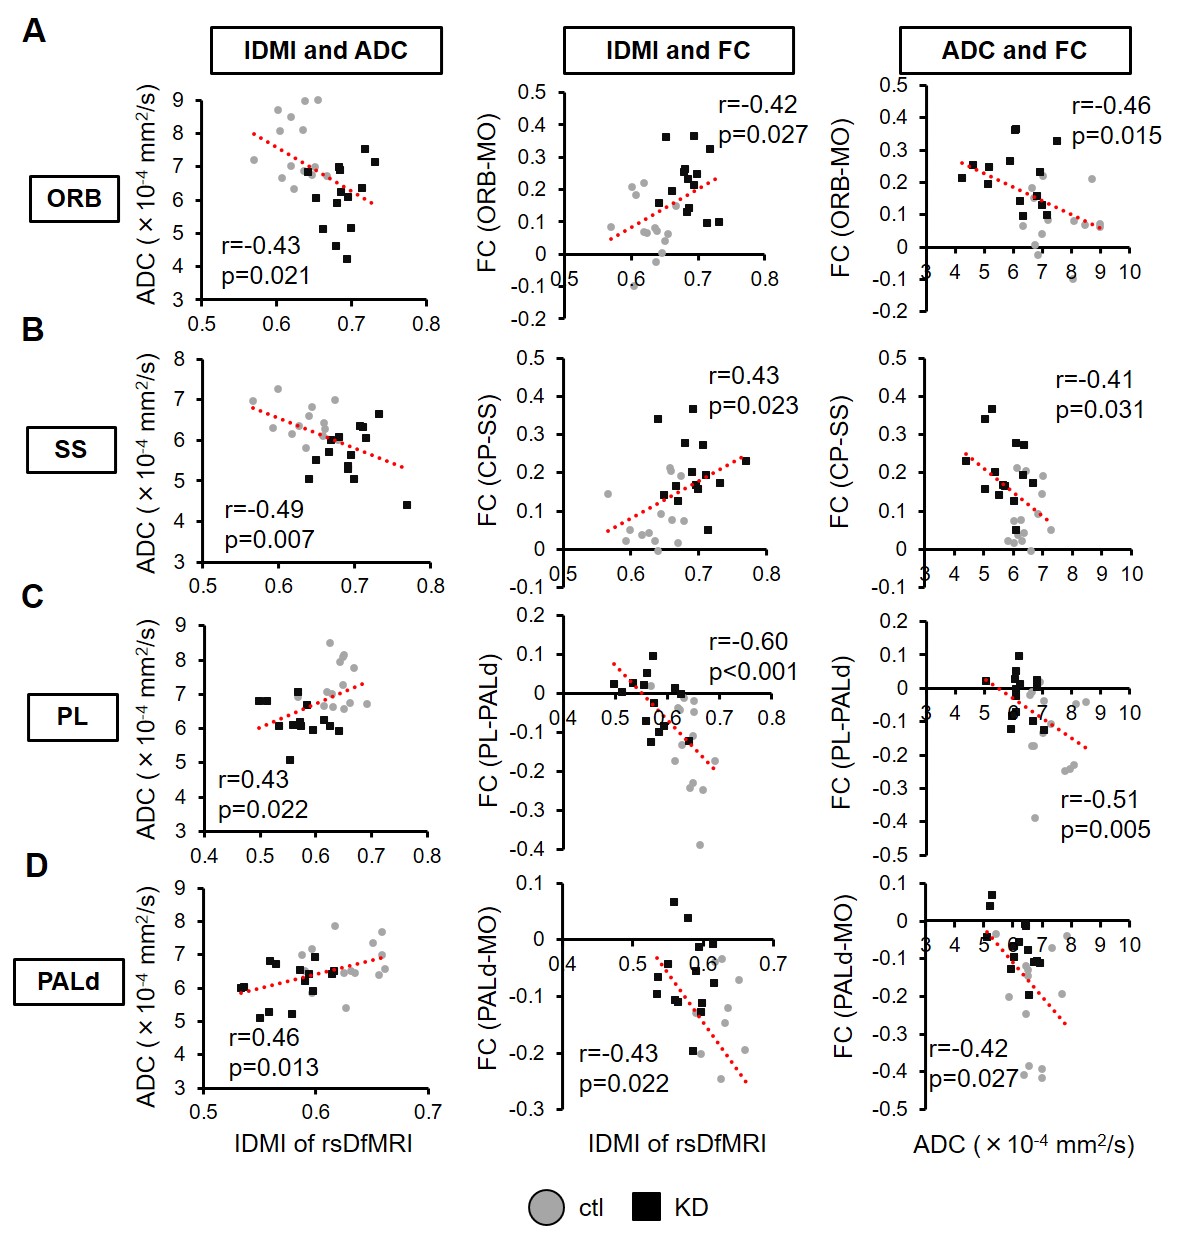
Finally, we performed IDMI analysis to elucidate the relationship between hyperactivation and abnormal FC patterns. As a result, we found the IDMI values were significantly increased at MO, SS, ORB, and RSP in the KD mice while they were decreased at VIS, ACA, PL, ILA, CP, ACB, PALd, PALv, MED (Fig. 5C). The IDMI increase reflected an increase in neural propagation from local activity of the given brain region to global network. In addition, we investigated relationship between the IDMI value and ADC or FC (Fig. 5). In ORB and SS, the ADC decrease was related with the IDMI increase and the enhancement of their connectivity, On the other hand, in PL and dorsal globus pallidus (PALd), the ADC decrease was related with the IDMI decrease and the weakening of their connectivity. These results indicated that the hyperactivation of the CST circuit was associated with the abnormal connectivity and neural propagation.
Conclusion
We proposed DfMRI analytical framework and characterized dynamical brain function in the neuropsychiatric conditions. The hemodynamic-independent measurement by DfMRI is a key to succeed in detecting these brain function. We anticipate that our DfMRI approach is suitable to measure brain function in conditions of neurovascular coupling impairment. Applying our approach to clinical studies with geriatric patients who commonly comorbid dysfunction of vascular response will be a worthwhile challenge.Acknowledgements
This work was supported by a Grant-in-Aid for Research Fellowships of the Japan Society for the Promotion of Science (JSPS Research Fellow) under grant number 18J00922 and Early-Career Scientists of JSPS KAKENHI under grant number 19K16298.References
1. Shih, Y. Y. et al. A new scenario for negative functional magnetic resonance imaging signals: endogenous neurotransmission. J Neurosci 29, 3036-3044 (2009).
2. Veldsman, M., Cumming, T. & Brodtmann, A. Beyond BOLD: optimizing functional imaging in stroke populations. Hum Brain Mapp 36, 1620-1636 (2015).
3. Abe, Y., Tsurugizawa, T. & Le Bihan, D. Water diffusion closely reveals neural activity status in rat brain loci affected by anesthesia. PLoS Biol 15, e2001494, (2017).
4. Le Bihan, D., Urayama, S., Aso, T., Hanakawa, T. & Fukuyama, H. Direct and fast detection of neuronal activation in the human brain with diffusion MRI. Proc Natl Acad Sci U S A. 103, 8263-8268 (2006).
5. Tsurugizawa, T., Ciobanu, L. & Le Bihan, D. Water diffusion in brain cortex closely tracks underlying neuronal activity. Proc Natl Acad Sci U S A 110, 11636-11641 (2013).
6. Aida, T. et al. Astroglial glutamate transporter deficiency increases synaptic excitability and leads to pathological repetitive behaviors in mice. Neuropsychopharmacology 40, 1569-1579 (2015).
7. Yoshida, K. et al. Physiological effects of a habituation procedure for functional MRI in awake mice using a cryogenic radiofrequency probe. J Neurosci Methods 274, 38-48 (2016).
8. Deco, G., Tagliazucchi, E., Laufs, H., Sanjuan, A. & Kringelbach, M. L. Novel Intrinsic Ignition Method Measuring Local-Global Integration Characterizes Wakefulness and Deep Sleep. eNeuro 4 (2017).
9. Deco, G. & Kringelbach, M. L. Hierarchy of Information Processing in the Brain: A Novel 'Intrinsic Ignition' Framework. Neuron 94, 961-968 (2017).
10. Abe, Y., Van Nguyen, K., Tsurugizawa, T., Ciobanu, L. & Le Bihan, D. Modulation of water diffusion by activation-induced neural cell swelling in Aplysia Californica. Sci Rep 7 (2017).
11. Hou, J. M. et al. Resting-state functional connectivity abnormalities in patients with obsessive-compulsive disorder and their healthy first-degree relatives. J Psychiatry Neurosci 39, 304-311 (2014).
12. Jung, W. H. et al. Altered functional network architecture in orbitofronto-striato-thalamic circuit of unmedicated patients with obsessive-compulsive disorder. Hum Brain Mapp 38 (2017).
13. Yang, X. et al. Intrinsic brain abnormalities in drug-naive patients with obsessive-compulsive disorder: A resting-state functional MRI study. J Affect Disord 245, 861-868 (2019).
Figures