1342
Simultaneous whole brain resting state fMRI and full-spectrum electrophysiology in rodents1The Huck Institutes of the Life Sciences, Penn State University, University Park, PA, United States, 2Biomedical Engineering, Penn State University, University Park, PA, United States
Synopsis
To elucidate the neural basis of resting state functional network, it is important to continuously record neural activity during rsfMRI. In this study, we developed a platform including animal setup and a signal denoising pipeline to achieve continuous measurement of local field potential (LFP) and neuronal spikes with simultaneous whole-brain rsfMRI in rats.
Introduction
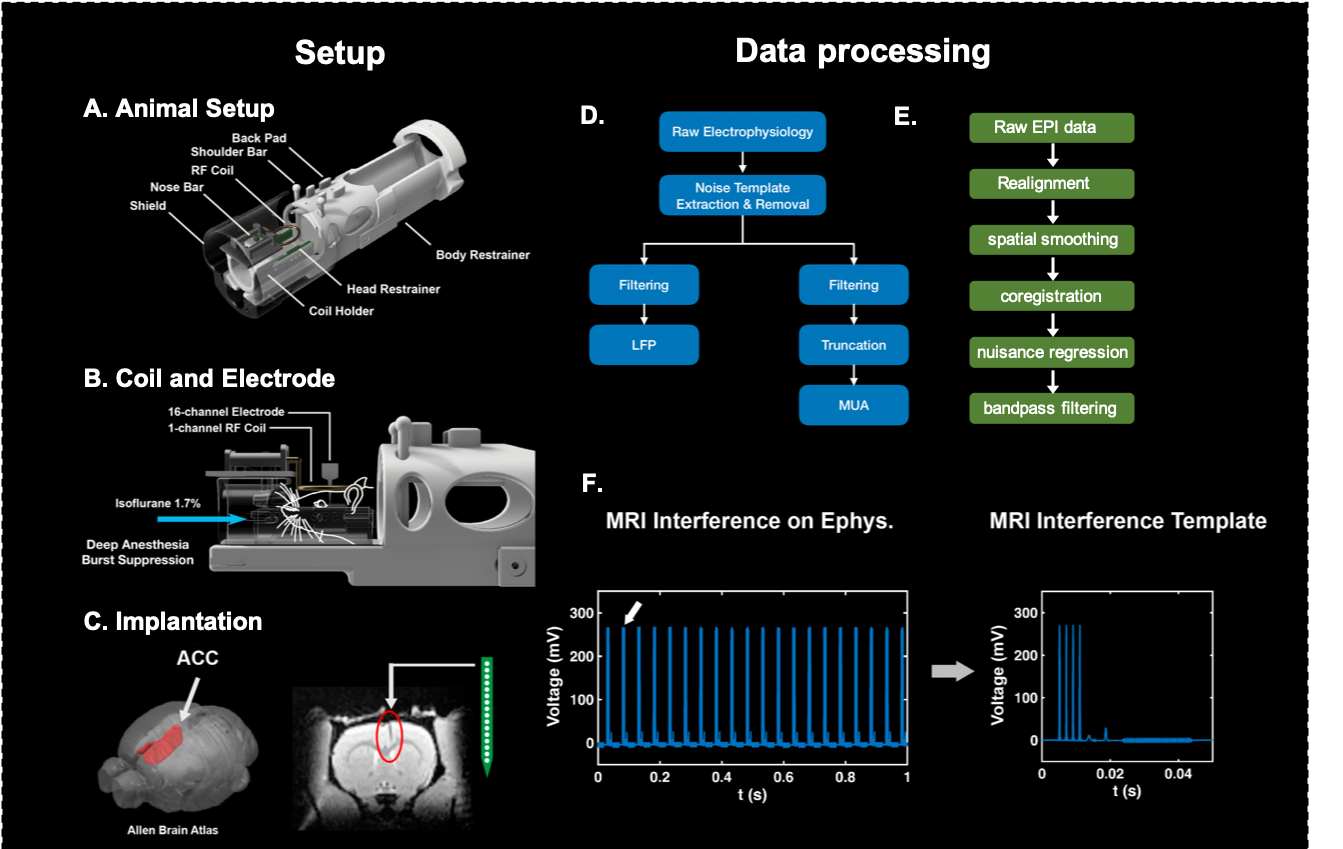
Resting state fMRI (rsfMRI) measures the spontaneous fluctuating BOLD signal without any specific task, which facilitates the exploration of functional circuits and networks in the brain1,2. However, the neural origin of resting state functional networks remains poorly understood. Previous concurrent electrophysiology and fMRI studies were mostly conducted on non-continuous electrophysiology recording with limited brain coverage in rsfMRI acquisition3,4, due to the difficulty in removing MR-related artifacts in electrophysiology data. Those technical challenges impeded us from investigating the neural basis of resting state functional networks on the whole brain level. In the current study, we developed a platform for continuous local field potential (LFP) recording and simultaneous whole-brain-wide rsfMRI (fig. 1). We also detected neuronal spikes and examined how they correlated to whole-brain rsfMRI data. Comprehensively understanding the neural basis of resting state network can help interpret network dynamics observed in human studies.Methods
Animals were stereotactically implanted with a 16-channel MRI-compatible electrode in the anterior cingulate cortex (ACC). We built a custom-designed single loop surface coil that was compatible with our animal setup. Simultaneous resting state fMRI and electrophysiology recording were conducted on rats anesthetized with 1.7% isoflurane, during which a clear burst suppression pattern was observed. We have two imaging paradigms including a 20-slice and 10-slice coverages, respectively. For both paradigms, we acquired T2*-weighted gradient-echo rsfMRI images using the echo-planar-imaging (EPI) sequence with the following parameters: repetition time = 1000ms; echo time = 15ms; matrix size = 64×64; field of view = 3.2 × 3.2 cm2; slice thickness = 1mm; flip angle = 60°; 1200 volume each run. To remove the MR-related artifact in LFP, we segmented the electrophysiology data according to each slice acquisition, and averaged them to generate an approximate MRI interference template. Then we re-aligned this template to each slice acquisition to obtain its precise timing, and then generated a finalized template. The template was then linearly regressed from the raw electrophysiology data, followed by a series of notch filtering to remove residues of MRI interference and harmonics of power-line frequency. In both paradigms, we got continuous LFP (0.1 -300 Hz). In the 10-slice imaging paradigm, we extracted multi-unit activity (MUA, 700-7000Hz) during ‘MRI-quiet time’. All acquired fMRI images were preprocessed with the following steps including realignment (SPM12), spatial smoothing, coregistration, voxel-wise nuisance regression, and bandpass filtering (0.01-0.1Hz). To investigate the relationship between neurophysiology and rsfMRI, we convolved gamma band power in LFP and firing rate in MUA with hemodynamic impulse function (gamma distribution function from SPM12, a=6, b=1) and then calculated its correlation with the timecourse of ACC and voxel-wise rsfMRI across the whole brain.Results
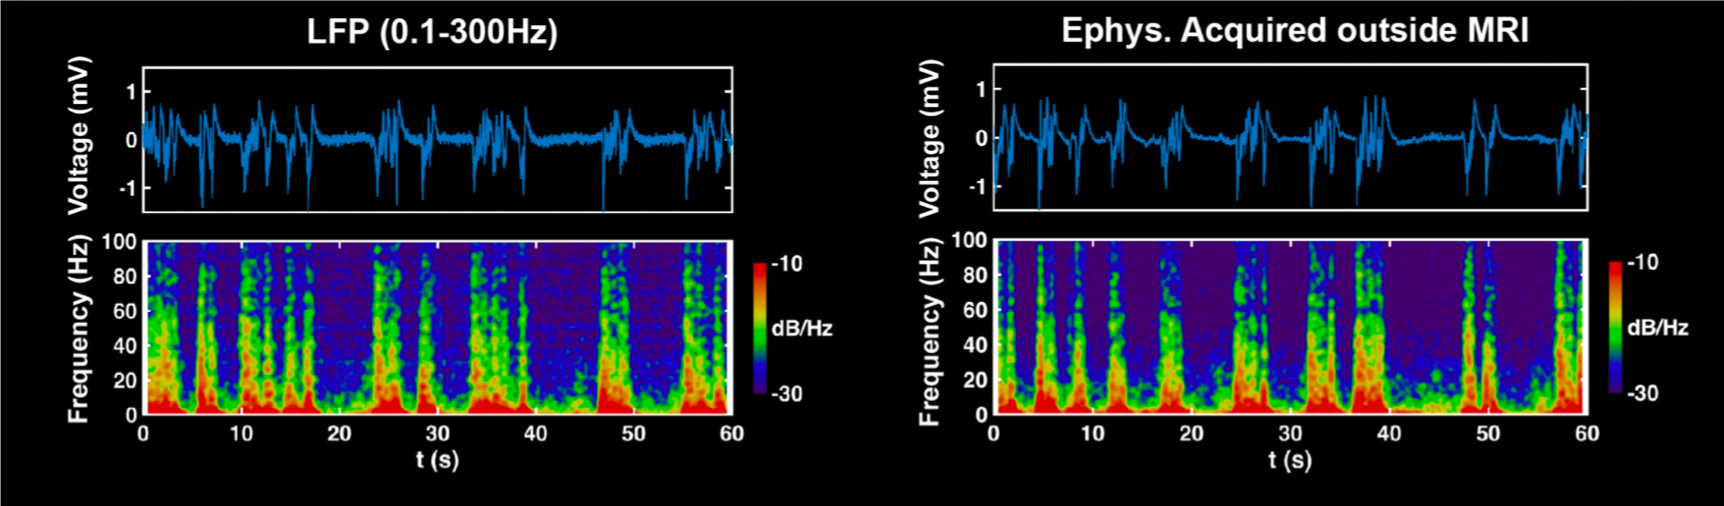
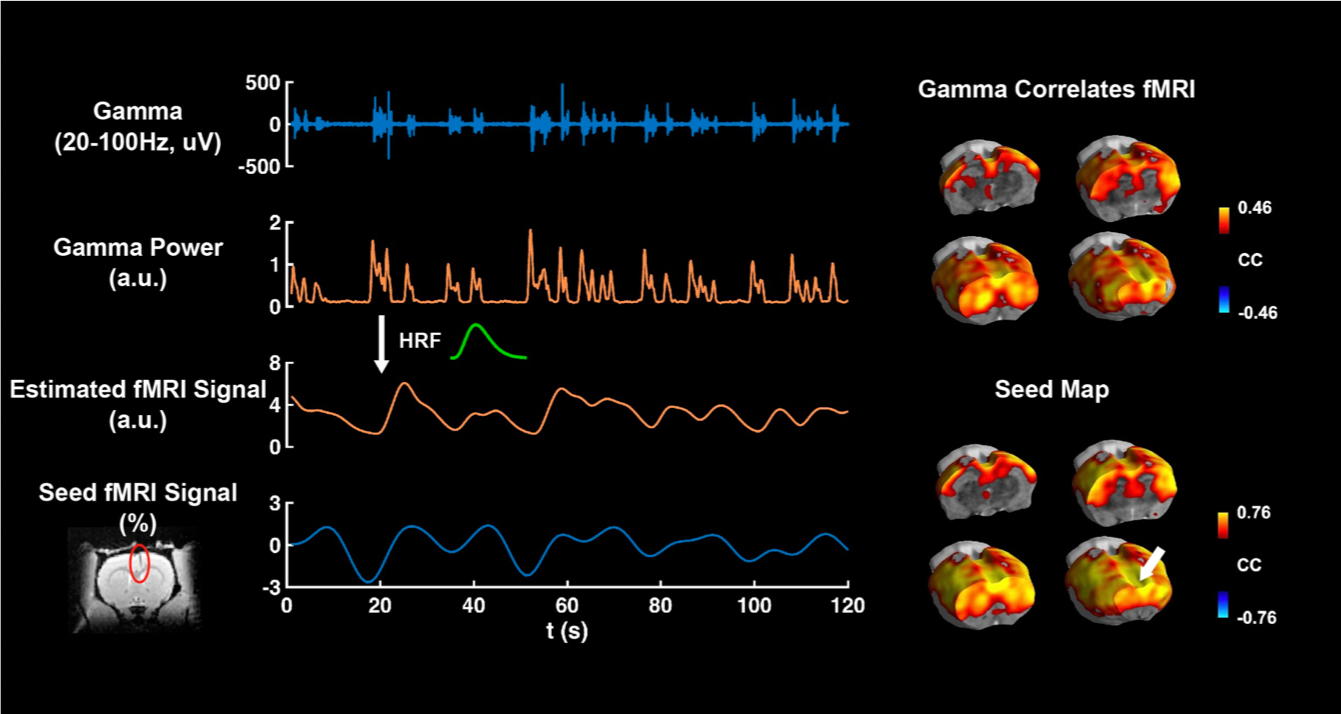
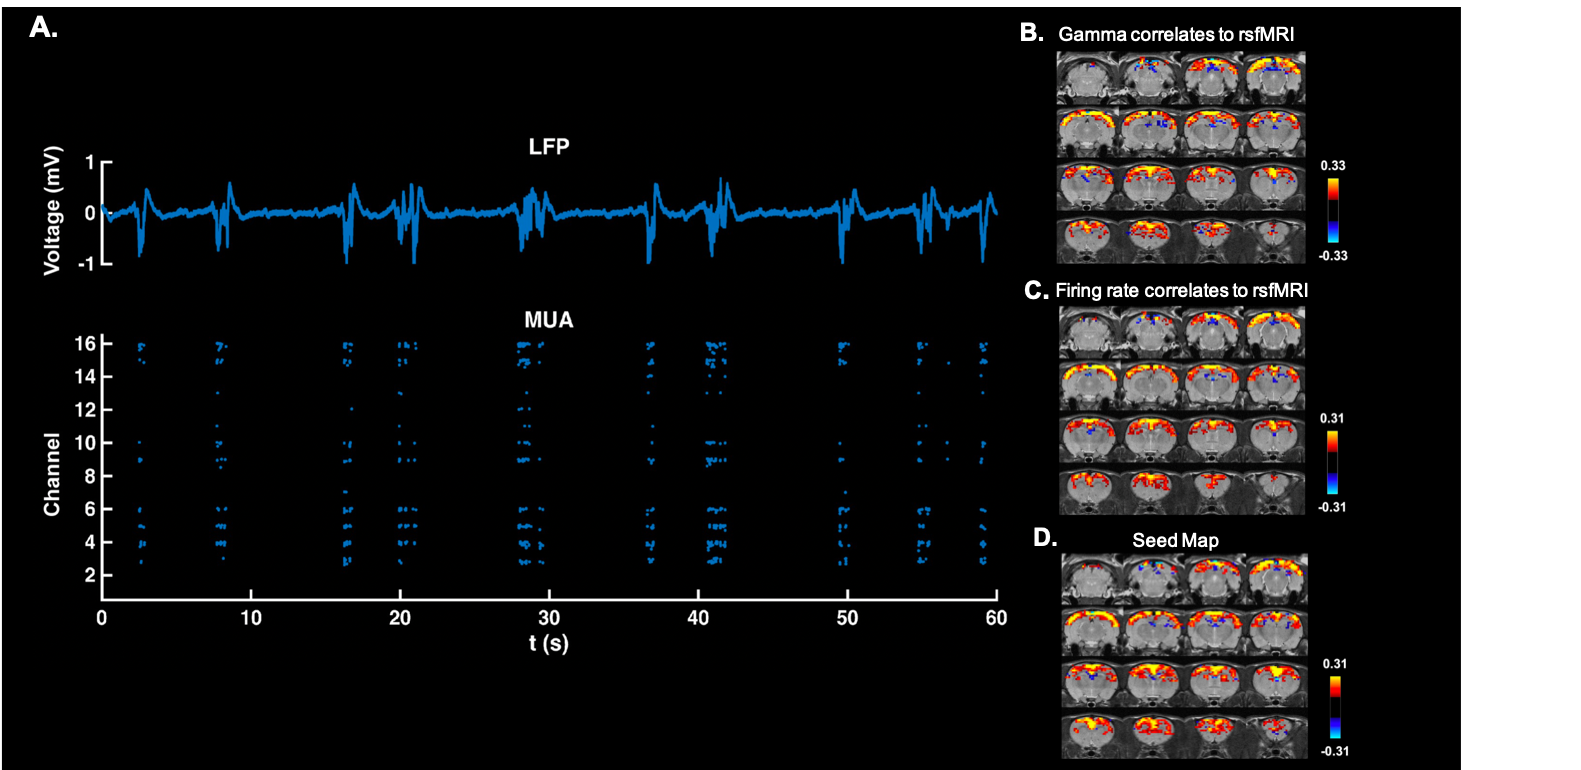
We successfully extracted continuous LFP during rsfMRI, which showed similar slow-wave pattern as the signal recorded outside the scanner on the same animal at the same anesthetized state (fig.2). The gamma band power in LFP was tightly coupled with the local fMRI signal, suggesting that the neuronal oscillations drove the BOLD signal. We calculated the voxel-wise correlations between gamma band power (convolved with the hemodynamic impulse function) and rsfMRI signals across the whole brain. The pattern of this correlation map was highly consistent to the ACC seedmap, derived merely from rsfMRI data (fig.3). This result confirms the neural basis of functional network involved during slow oscillations under deep anesthesia. In the 10-slice imaging paradigm, we obtained both LFP and spikes, demonstrating strong synchronization between the two signals under burst suppression. Consistent correlation maps were obtained using ACC rsfMRI signal, gamma band power, and firing rate (fig.4). This data further indicate that both LFP and MUA contributed to resting state functional connectivity under deep anesthesia.Discussion and conclusion
Our study established a platform to combine the multi-channel electrophysiology recording and rest state fMRI with the whole-brain coverage in rodents. We investigated the neural basis of local BOLD signal and resting state functional networks under deep anesthesia. This platform extended the ability to further understand brain organizations such as layer-specific contribution and neuron-type based networks.Acknowledgements
The present study was partially supported by National Institute of Neurological Disorders and Stroke Grant R01NS085200 (PI: Nanyin Zhang, PhD) and National Institute of Mental Health Grant R01MH098003 and RF1MH114224 (PI: Nanyin Zhang, PhD).References
1. Sejnowski, T. J. Summary: Cognition in 2014. Cold Spring Harb. Symp. Quant. Biol. 79, 237–241 (2014).
2. Biswal, B., Yetkin, F. Z., Haughton, V. M. & Hyde, J. S. Functional Connectivity in the Motor Cortex of Resting. Brain 34, 537–541 (1995).
3. Schölvinck, M. L., Maier, A., Ye, F. Q., Duyn, J. H. & Leopold, D. A. Neural basis of global resting-state fMRI activity. Proc. Natl. Acad. Sci. U. S. A. (2010). doi:10.1073/pnas.0913110107
4. Pan, W. ju et al. Simultaneous fMRI and electrophysiology in the rodent brain. J. Vis. Exp. (2010). doi:10.3791/1901
Figures