1339
Simultaneous fMRI and mesoscopic Ca2+ imaging indicates spontaneous excitatory neural activity accounts for 1/3rd of the variance in BOLD signal
Evelyn MR Lake1, Xinxin Ge2, Xilin Shen1, Peter Herman1, Fahmeed Hyder1, Jessica A Cardin3, Michael J Higley3, Dustin Scheinost1, Xenophon Papademetris1, Michael C Crair2, and R Todd Constable1
1Radiology and Biomedical Imaging, Yale University, New Haven, CT, United States, 2Department of Neurobiology, Yale University, New Haven, CT, United States, 3Department of Neuroscience, Yale University, New Haven, CT, United States
1Radiology and Biomedical Imaging, Yale University, New Haven, CT, United States, 2Department of Neurobiology, Yale University, New Haven, CT, United States, 3Department of Neuroscience, Yale University, New Haven, CT, United States
Synopsis
We demonstrate longitudinal simultaneous whole-cortex Ca2+ imaging and fMRI in mice expressing GCaMP in one of five different cell types (excitatory, inhibitory, two interneuron subtypes, and astrocytes). The high SNR of our dual-imaging approach is shown by the indistinguishable Ca2+ responses to hind-paw or visual stimulation measured inside and outside the scanner. We optimize a spatially variable, three-parameter gamma-variant to investigate the transfer function between the BOLD and Ca2+ signals throughout the cortex. This approach is applied in functionally and anatomically defined ROIs. Results show that 1/3rd of the variance in BOLD is accounted for from spontaneous excitatory Ca2+ activity.
INTRODUCTION
To study the organizational principles that govern brain function, a wide array of tools has been developed.1-6 Each tool has strengths that offer insight into specific aspects of brain function, but also experimental tradeoffs such as spatiotemporal resolution, coverage, specificity, or invasiveness. In pursuit of a more comprehensive understanding of brain function, we developed an approach for simultaneous mesoscopic Ca2+ imaging and fMRI in mice.Genetically encoded Ca2+ indicators enable imaging of cell-specific activity.7,8 However, this method is limited to optically accessible tissue, and the expression of Ca2+ indicators necessitates invasive manipulation of the nervous system. Thus, its application is restricted to animal models. In contrast, fMRI provides a non-invasive means of measuring activity in both humans and animals with whole-brain coverage. However, fMRI has low spatiotemporal resolution, and relies on an indiscriminate measure of activity through BOLD contrast.
Despite the considerable success of these methods individually, technical challenges have prohibited applying them in combination. We describe innovations that enable us to collect these data simultaneously and longitudinally in mice. We test our approach using five genotypes, each expressing GCaMP in a different cell type (Table 1 and Figure 1).9 We test the gamma-variate fit-based convolution model proposed by Ma et al. and show that 1/3rd of spontaneous BOLD activity is predictable from simultaneously recorded excitatory Ca2+ signal.10
METHODS
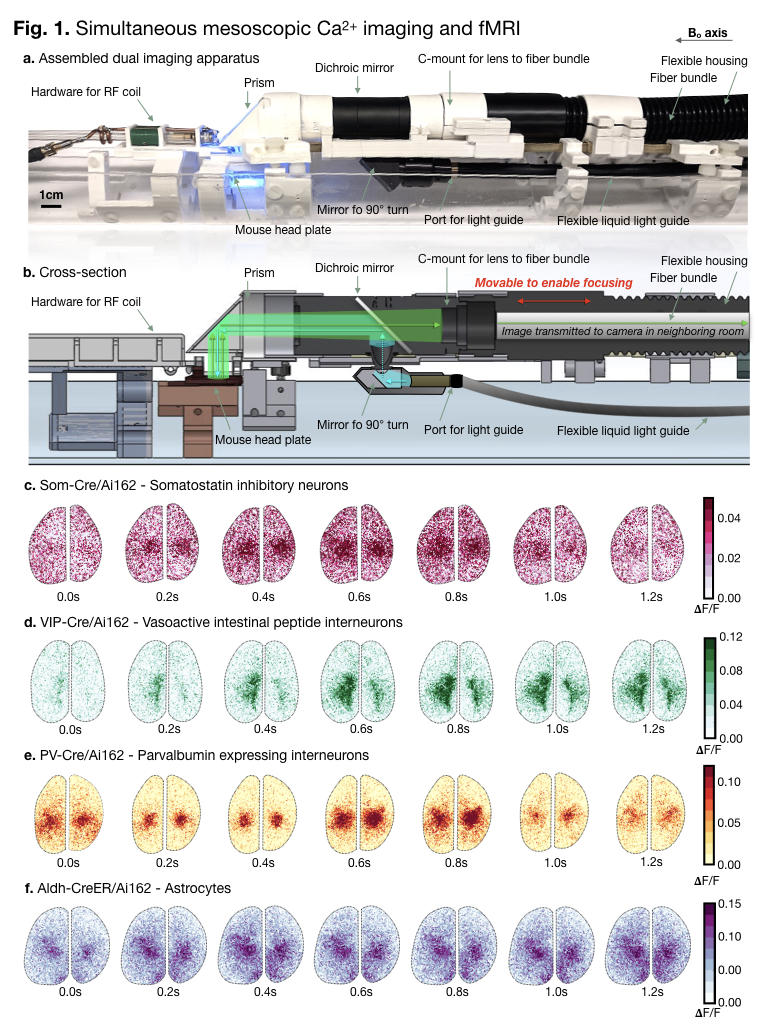
Optical imaging was performed inside an 11.7T Bruker magnet using a heavily modified telecentric lens (Figure 1). To compare SNR inside vs. outside the scanner, optical imaging outside the scanner was performed with a Zeiss Axiozoom V.16 coupled to a PlanNeoFluar Z 1x, 0.25 NA objective with 56mm working distance. Mice undergo an acute or chronic surgical preparation (N=77) (Figure 2).Each fMRI GE-EPI volume (TR/TE 1000/9ms, resolution 0.4x0.4x0.4mm3) triggers the capture of 20 optical frames (interleaved cyan/violet 470/395nm, for Ca2+ sensitive/insensitive measurements, FOV 14.5x14.5mm2, resolution 25x25μm2). Mice are lightly anesthetized (Isoflurane, 0.75%). During each experiment, we collect data during stimulation (unilateral hind-paw electrical, or visual, 625nm, both ON/OFF 5/55 seconds) and rest. Each functional scan is 10-minutes. Data are processed using standard procedures.5,11 A generalized linear model (GLM) is used to identify responding ROIs. Functional-MRI and Ca2+ data are registered using a time-of-flight MR-angiogram (FLASH, TR/TE 130/4ms, FOV 2.0x1.0x2.5cm3, resolution 0.05x0.05x0.05mm3) to match anatomical features present in both datasets using BioImageSuite (www.bioimagesuite.org). Data are registered to The Allen Brain Atlas (http://www.brain-map.org).
To investigate if BOLD $$$f(t)$$$ can be predicted from Ca2+ $$$g(t)$$$, by applying an approach adapted from Ma et al.10 Briefly, we optimize a three-parameter gamma-variate to approximate a spatially variable hemodynamic response function. We assume a linear relationship, $$$fu(t)=HRF*g(t)$$$, where $$$*$$$ denotes convolution, and $$$HRF(t)$$$ is defined as:
$$HRF(t)=A·[(t/T)^α]·e[-(t-T)/β]$$
where $$$α=(T/W)^2$$$, $$$β=W^2$$$, $$$A$$$ is amplitude, $$$T$$$ delay to peak, and $$$W$$$ width. The MATLAB optimization function fmincon was used to estimate $$${A,T,W}$$$, the loss function was defined as the L2 distance between estimated $$$fubar(t)$$$ and observed $$$fu(t)$$$. The model generates an HRF that, when convolved with measured Ca2+ signal, best-fits measured BOLD signal. Goodness of fit was estimated using Fisher’s Z transformed Pearson’s correlation.
RESULTS
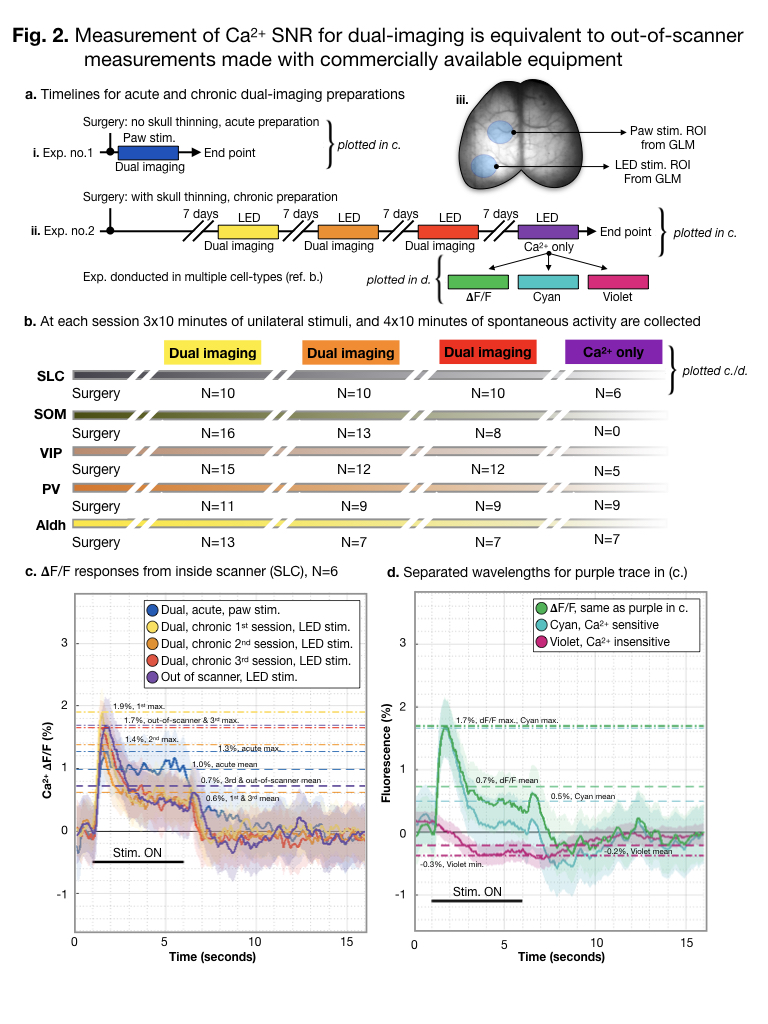
Ca2+ responses during dual-imaging are indistinguishable from those collected outside the scanner (Figure 2).11-14 Next, we evaluated the success of applying gamma-variant fitting to predict BOLD from Ca2+ signal. We applied this approach to the average signal from within ROIs that respond to stimulation (Figure 3). Across SLC mice, the mean correlation was z=0.48±0.19. Data were filtered [0.1-0.04Hz].10Mice were registered to a down-sampled Allen Atlas (Figure 4.b). Within each of n=18 anatomically defined ROIs, we applied the convolution kernel. Using filtered data [0.1-0.04Hz], we found that across ROIs, scans, and mice, the correlation between BOLD and Ca2+ convolved with the optimized HRF was z=0.53±0.23. Further, we found that this relationship was consistent for the duration of each scan, across frequency bands z=0.45-0.61, and spatially (Figure 4.d).10,15
DISCUSSION
Due to the complexity of the brain and the difficulty of controlling many factors that influence activity, including arousal and intrinsic biological variability, serial multi- modal experiments, even in the same model, are insufficient to establish definitive links between modalities. A method to circumvent this challenge has been to align evoked responses across experiments. However, this approach removes the vast majority of activity that occurs spontaneously. Here, we collect Ca2+ data from the whole-cortex with simultaneous whole-brain BOLD fMRI.Importantly, we demonstrate that dual-imaging does not compromise the SNR of the optical data. We predict BOLD activity from Ca2+ data to a similar degree that Ma et al. predicted hemodynamic activity. Notably, both the hemodynamic and neural signals reported by Ma et al. were measured optically.10 Specifically, we account for 30±9% of the variance in BOLD, while Ma et al. accounts for ~46%.10 We anticipate that different transfer functions will be observed for each cell population.
CONCLUSION
We report longitudinal data from (N=71) mice belonging to five different genotypes that each express Ca2+ fluorescence in a different cell type (Table 1). These data will reveal the relative contributions of different cell populations to the fMRI signal and provide a means for investigating the underlying cellular basis of BOLD.Acknowledgements
The authors would like to thank all members of the Multiscale Imaging and Spontaneous Activity in Cortex (MISAC) collaboration at Yale University for their valuable contributions to this project. We thank Peter Brown for valuable input on the design and building the RF saddle coil and the design and building of the telecentric lens holder. We thank Anthony DeSimone, Peter Brown, and the Yale School of Medicine electronics and machine shop for help with rebuilding the telecentric lens. We thank Cheryl Lacadie for help with data registration. This work was supported by funding from the NIH (U01 N2094358 and R01 MH111424)References
- Yang W, Yuste R. In vivo imaging of neural activity. Nat Methods. 2017;14(4):349-359.
- Jorgenson LA, Newsome WT, Anderson DJ, et al. The BRAIN Initiative: developing technology to catalyse neuroscience discovery. Philos Trans R Soc Lond B Biol Sci. 2015;370(1668).
- Bassett DS, Sporns O. Network neuroscience. Nat Neurosci. 2017;20(3):353-364.
- Raichle, ME. Functional brain imaging and human brain function. J Neurosci. 2003;23(10):3659-3962.
- Welselblatt JB, Flister ED, Piscopo DM, et al. Large-scale imaging of cortical dynamics during sensory perception and behavior. J Neurophysiol. 2016;115(6):2852-2866.
- Barson D, Hamodi AS, Shen X, et al. Simultaneous mesoscopic and two-photon imaging of neuronal activity in cortical circuits. Nature Methods, 2019.
- Ross WN. Understanding calcium waves and sparks in central neurons. Nat Rev Neurosci. 2012;13(3):157-168.
- Dana H, Chen TW, Hu A, et al. Thy1-GCaML6 transgenic mice for neuronal population imaging in vivo. PLoS One. 2014;9(9):e108697.
- Srinivasan R, Lu TY, Chai H, et al. New transgenic mouse lines for selectively targeting astrocytes and studying calcium signals in astrocytes processes in situ and in vivo. Neuron. 2016;92(6):1181-1195.
- Ma Y, Chaik MA, Kozberg MG, et al. Resting-state hemodynamics are spatiotemporally coupled to synchronized and symmetric neural activity in excitatory neurons. Proc Natl Acad Sci U S A. 2016;113(52):E8463-E8471.
- Allen WE, Kauver IV, Chen MZ, et al. Global representations of goal-directed behavior in distinct cell types of mouse neocortex. Neuron. 2017;94(4):891-907.
- Ma Y, Chaik MA, Kim SH, et al. Wide-field optical mapping of neural activity and brain haemodynamics: considerations and novel approaches. Philos Trans R Soc Lond B Biol Sci. 2016;371(1705).
- Shimaoka D, Steinmetz NA, Harris KD, et al. The impact of bilateral ongoing activity on evoked responses in mouse cortex. Elife. 2019;8:e43533.
- Mussal S, Kauffman MT, Juavinett AL, et al. Single-trial neural dynamics are dominated by richly varied movements. Nat Neurosci. 2019;22(10):1677-1686.
- Bauer AQ, Kraft AW, Wright PW, et al. Optical imaging of disrupted functional connectivity following ischemic stroke in mice. Neuroimage. 2014;99:388-401.
Figures
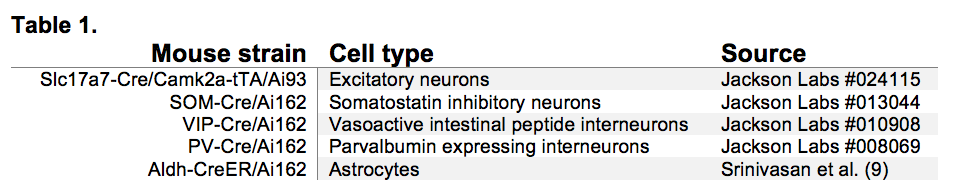
Data collected during longitudinal experiments
includes five genetically targeted cell-types. The mouse strains, targeted
cell-types, and sources from which mice were obtained are listed. Mice were
bred in-house and kept on
a 12-hour light/dark cycle. Food and water were available ad libitum. Mice were
adults, and weighed 25-30g, at the time of imaging.
To collect Ca2+ data within the
scanner necessitated redirecting both excitation and emission light to travel
along the 9cm bore. A photograph of the assembled dual-imaging
apparatus is shown in (a.). A diagram of the light path overlaid on a cartoon is shown (b.). Example Ca2+ data from four uncommon genotypes: SOM-Cre/Ai162
(c.), VIP-CreAi162 (d.), PV-Cre/Ai162 (e.), and Aldh-CreER/Ai162 (f.) are shown.
All data shown was collected during dual-imaging experiments. Time is indicated
beneath each frame. Every other 𝚫F/F frame in the acquired series
is shown to span 1.2 seconds.
A study overview is shown (a./b.).
Paw stimulation was used during acute experiments, while optical stimulation
was used during chronic experiments (iii.). ROIs were determined using GLM.
Responses to stimulation are averaged across experiments (n=4), stimuli (n=9
per experiment) and mice (N=6 per group) (b.). All mice are Slc17a7-Cre/Camk2a-tTA/Ai93. The maximum
response amplitude is indicated with a dot-dashed line. The mean response
amplitude is indicated with a dashed line. For data acquired out of the scanner,
purple (b.), separate wavelengths are plotted in (c.).
Responding ROIs were determined using GLM.
Example raw (unfiltered) responses for an SLC mouse are shown (a.). For
gamma-variant convolution, we consider 50s windows. Ca2+ data were
filtered [0.04-0.1Hz]. Example pre-/post- (green/blue) gamma-variant
convolution Ca2+ data are plotted with BOLD (orange) data (b.).
Results from N=6 SLC mice are summarized (c.). After gamma-variant convolution,
Ca2+ signal was significantly correlated (Fisher’s Z-transformed
Pearson’s correlation) with BOLD signal. An example responding ROI is shown in
Ca2+ and MRI space (c. iii.).
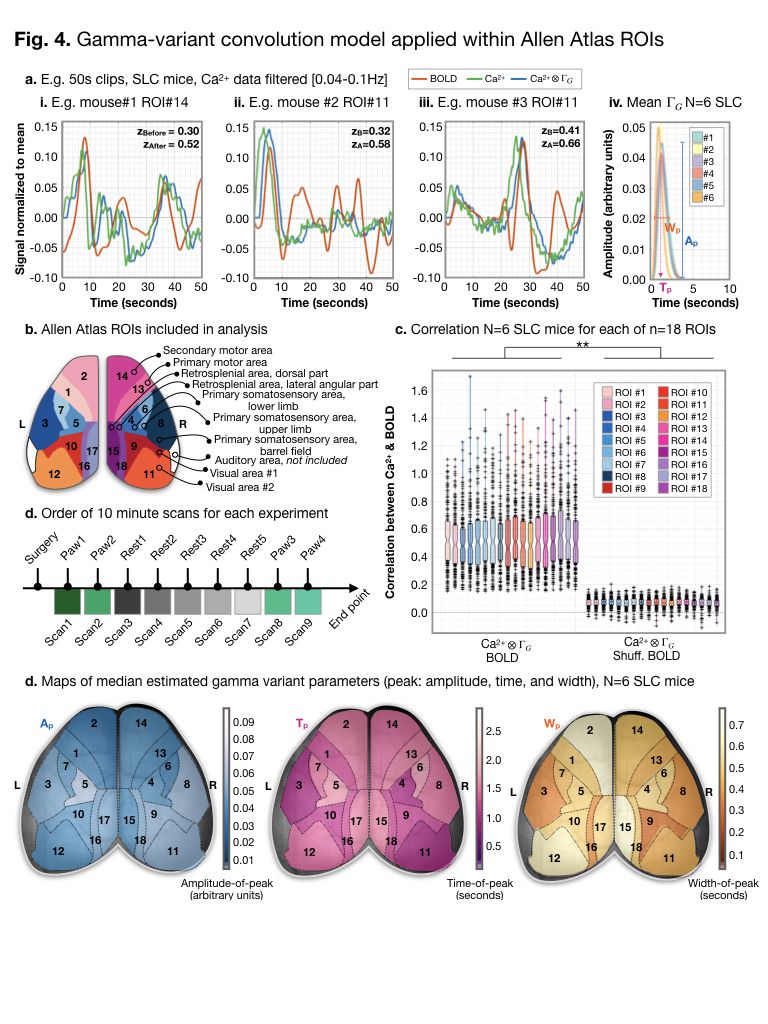
Example pre-/post- (green/blue) gamma-variant
convolution Ca2+ data are plotted with BOLD (orange) data for
anatomically defined ROIs from a down-sampled version of the Allen Atlas
(a./b.). Across ROIs (c.), scans (d.), frequency filters (data not show), and
windows (data not shown), after gamma-variant convolution, Ca2+
signal was significantly correlated (Fisher’s Z-transformed Pearson’s
correlation) with BOLD signal. We estimate three parameters (a.iv.). Across the
cortex, we did not observe significant differences between estimated parameters
(d.).