1336
Towards Coronary Flow Reserve Assessment with 4D Flow MRI1Radiology and Nuclear Medicine, Amsterdam UMC, Amsterdam, Netherlands, 2Biomedical Engineering, Amsterdam UMC, Amsterdam, Netherlands
Synopsis
Coronary flow reserve (CFR) is a clinical test that interrogates the function of the entire coronary vasculature, indicating the presence of coronary stenoses, microvascular disease or both in patients with ischemic heart disease. We used 15 times accelerated 4D flow MRI with compressed sensing reconstruction at an isotropic spatial resolution of 1.0 mm to measure diastolic flow in the left coronary artery of six healthy subjects. Mean diastolic flow was 1.15±0.18 ml/s with a mean scan-rescan difference of 0.06 ml/s. 4D flow MRI-based diastolic flow quantification in the LCA is feasible and could enable non-invasive CFR measurement.
Introduction
Ischemic heart disease (IHD) is a major cause of death in the Western world (1). Main underlying causes are coronary artery stenosis and microvascular dysfunction. For risk assessment of stenoses in the epicardial domain, current diagnostics rely on catheter-based coronary artery angiography (CAG) for visualization and fractional flow reserve (FFR) assessment to determine the pressure drop over the stenosis. However, neither CAG or FFR can detect microvascular dysfunction, as changes in microvascular resistance are not taken into account (2). Coronary flow reserve (CFR) is a clinical test that interrogates the function of the entire coronary vasculature by measuring the increase in coronary blood flow in maximal vasodilation compared to rest. An impaired CFR indicates the presence of stenoses, microvascular disease or both. Large-scale studies have shown that a CFR of <2.0 is an independent predictor of cardiac mortality and major adverse cardiac events (3–5). Coronary flow quantification using 4D flow MRI has never been reported, presumably because of the small size of the coronary arteries and cardiac motion, which necessitates high spatial and temporal resolutions, causing scans to be long. In the current study, we use an accelerated 4D flow MRI sequence with compressed sensing reconstruction (6,7) to enable high resolutions at reasonable scan times and investigate its feasibility and reproducibility for left coronary artery (LCA) flow quantification in healthy subjects at rest.Methods
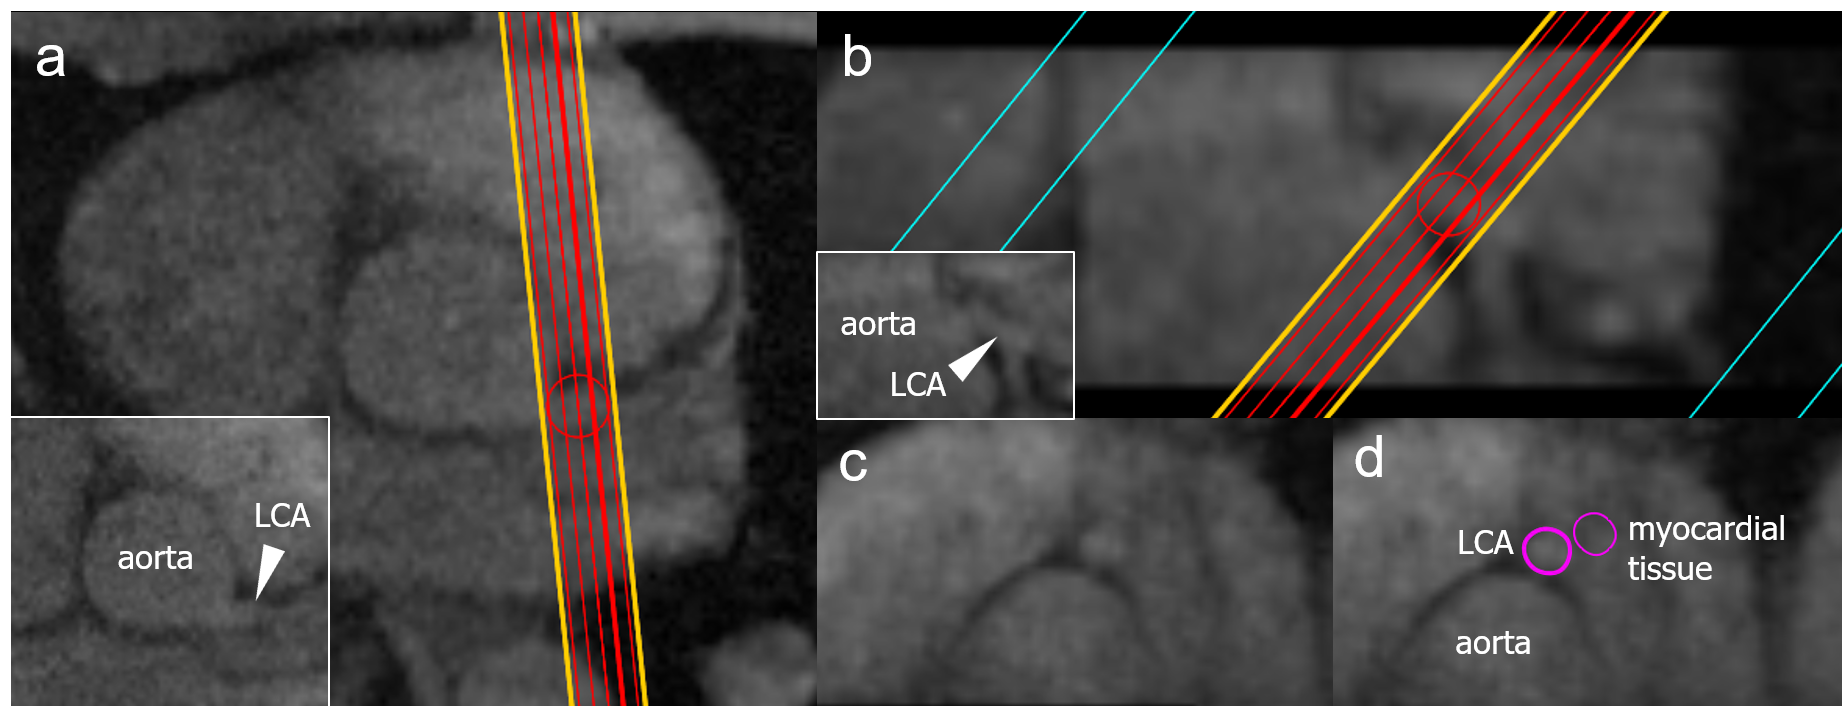
Eight healthy subjects (6 female, aged 28±3y) underwent cardiac MRI at 3T (Philips Ingenia MRI-scanner). A diastolic mDixon angiogram was acquired at an isotropic spatial resolution of 1.5 mm, followed by two subsequent 4D flow MRI acquisitions covering the proximal part of the LCA in a 30-mm thick transversal slab with an isotropic spatial resolution of 1.0 mm, see Figure 1. 4D flow MRI was acquired using pseudo-spiral undersampling with an acceleration factor of 15 and three-directional VENC of 50 cm/s, using respiratory navigator gating with a 5-mm gating window and ECG-gating for retrospective binning into 24 cardiac phases (6,7). Reconstruction was performed offline using ReconFrame (Gyrotools, Zürich, Switzerland) and the Berkeley Advanced Reconstruction Toolbox (BART) (8). A sparsifying total variation transform in time was used with a regularization parameter r = 0.001 and 20 iteration steps.Data analysis was performed in GTflow V3.2.4 (Gyrotools). 4D flow MRI magnitude images were used to localize the LCA branching off from the aorta in a diastolic time frame and make a longitudinal cross-section, see Figure 2. The longitudinal view was used to place 5 equidistant measurement planes perpendicular to the LCA, approximately 1.5 mm apart. Next, the artery was visually identified in each plane and measurement contours were drawn which were then copied to all diastolic time frames and projected onto the corresponding velocity images. Velocity information was only taken into account for diastolic time frames and ignored for other time frames in which the LCA could not be identified because of motion-induced blurring. Also, additional contours were drawn in the myocardial tissue to measure cardiac motion, see Figure 2. Diastolic flow curves were calculated for each contour, as well as streamlines for visualization. Mean flow curves were made by averaging over all contours and all subjects. Scan-rescan reproducibility of mean diastolic flow values was evaluated by means of Bland-Altman analysis. Flow values are presented as mean ± SD.
Results
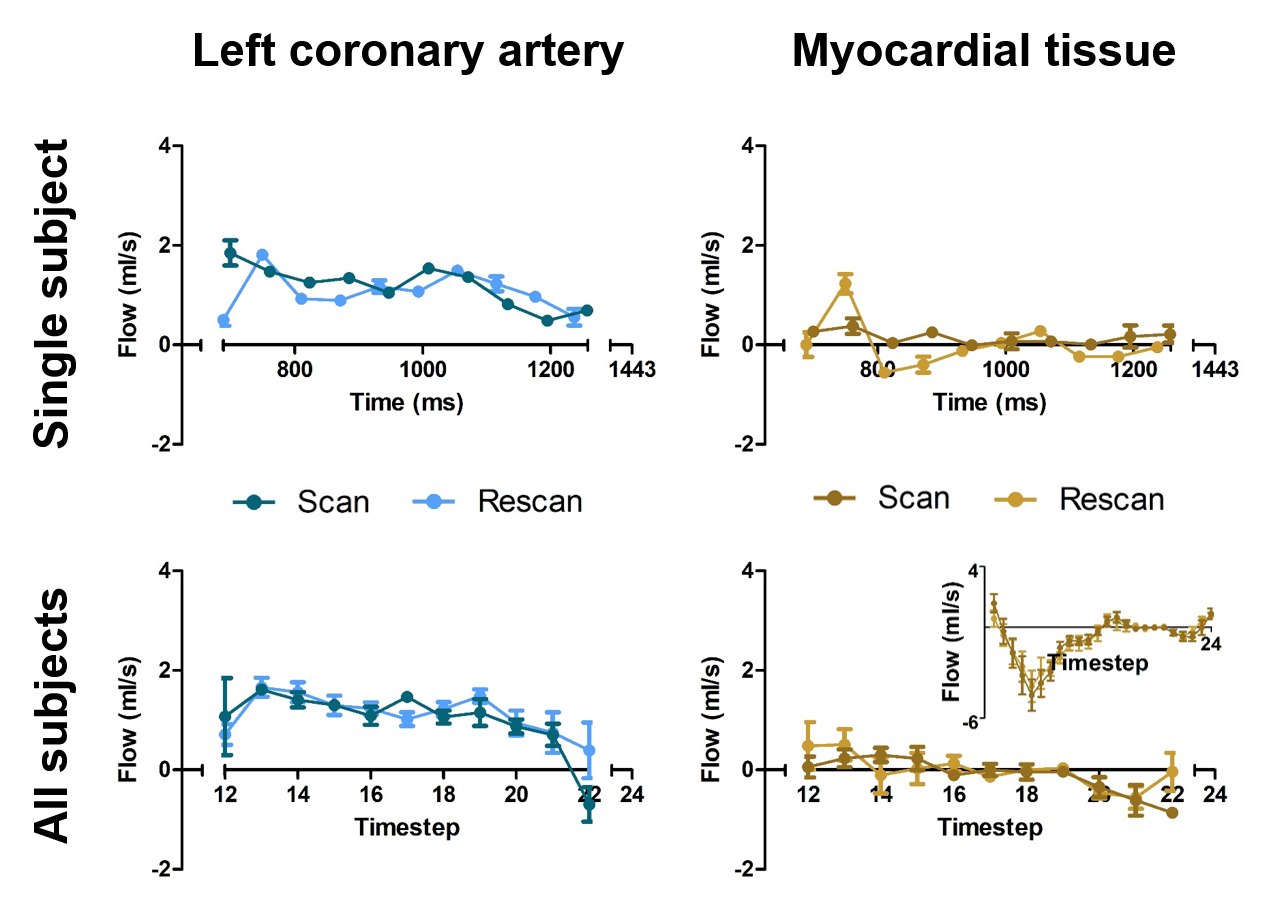
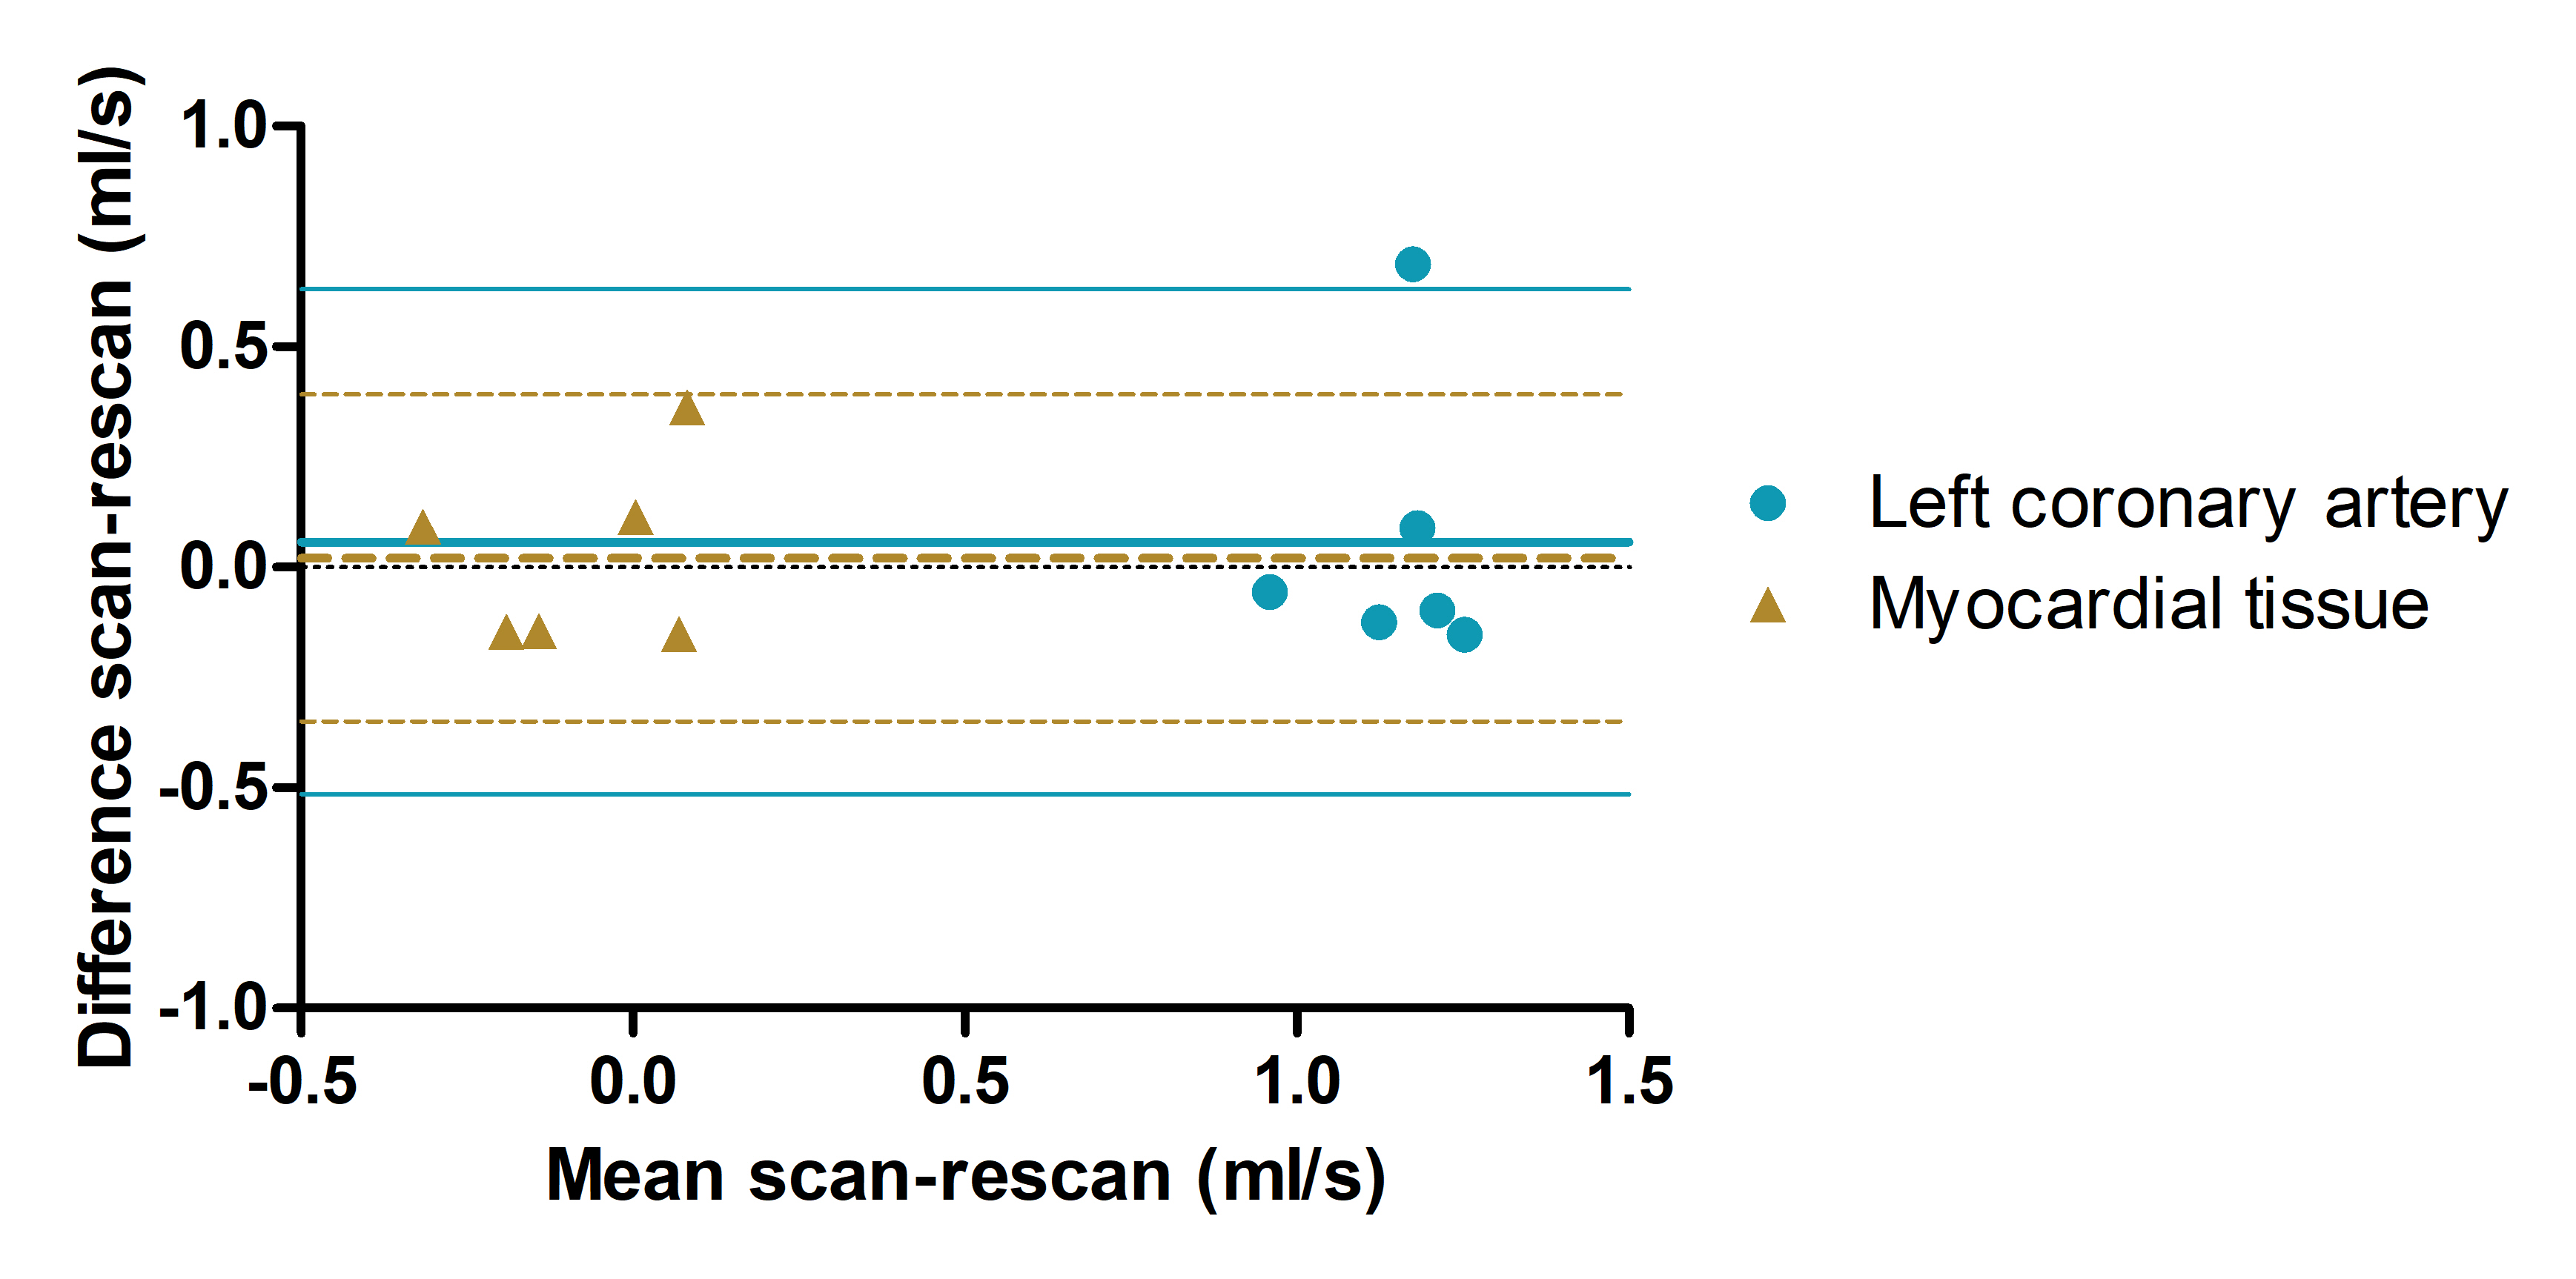
Scan time was 11±2 minutes per 4D flow MRI scan with a gating efficiency of 57±11%. Two subjects were excluded because of blurring due to a high breathing frequency. Figure 3 shows a representative example of reconstructed streamlines in the LCA. Flow curves from this acquisition are presented in Figure 4 (top). Ten out of 24 diastolic time frames could be examined. Averaged over all subjects, mean diastolic flow was 1.15±0.18 ml/s in the LCA and -0.08±0.17 ml/s in adjacent myocardial tissue, see Figure 4 (bottom). Figure 5 shows that Bland-Altman analysis revealed a mean scan-rescan difference of 0.06 ml/s in the LCA, with limits of agreement of -0.51 and 0.63 ml/s. Myocardial tissue measurements had a mean scan-rescan difference of 0.02 ml/s and limits of agreement of -0.35 and 0.39 ml/s.Discussion
In this study, we investigated the feasibility and reproducibility of flow quantification in the LCA using an accelerated 4D flow MRI sequence. Our measurements were in accordance with flow values reported in literature (9,10). Systolic time frames were not taken into account, as cardiac motion corrupted the image quality such that the LCA could not be identified during these time frames. A possible solution is the use of a more motion-robust 4D flow MRI sequence, e.g. with non-Cartesian sampling. However, for CFR assessment diastolic flow values may be sufficient as coronary blood flow mainly occurs during diastole. Considering the small inter-contour and inter-subject variations in measured flow combined with an expected coronary flow increase during vasodilatation of 4-5 in healthy subjects and around 2 in patients, application of the current MRI protocol to measure CFR seems reasonable. Thus far, measurements were only performed in the LCA but future work will focus on the RCA as well.Conclusion
4D flow MRI-based flow quantification in the LCA is feasible and reproducible and could enable non-invasive CFR measurement.Acknowledgements
No acknowledgement found.References
1. Global, regional, and national age-sex specific all-cause and cause-specific mortality for 240 causes of death, 1990-2013: a systematic analysis for the Global Burden of Disease Study 2013. Lancet (London, England). 2015 Jan;385(9963):117–71.
2. van de Hoef TP, Siebes M, Spaan JAE, Piek JJ. Fundamentals in clinical coronary physiology: why coronary flow is more important than coronary pressure. Eur Heart J. 2015 Dec;36(47):3312-9a.
3. van de Hoef TP, van Lavieren MA, Damman P, Delewi R, Piek MA, Chamuleau SAJ, et al. Physiological basis and long-term clinical outcome of discordance between fractional flow reserve and coronary flow velocity reserve in coronary stenoses of intermediate severity. Circ Cardiovasc Interv. 2014 Jun;7(3):301–11.
4. Murthy VL, Naya M, Foster CR, Hainer J, Gaber M, Di Carli G, et al. Improved cardiac risk assessment with noninvasive measures of coronary flow reserve. Circulation. 2011 Nov;124(20):2215–24.
5. Kato S, Saito N, Nakachi T, Fukui K, Iwasawa T, Taguri M, et al. Stress Perfusion Coronary Flow Reserve Versus Cardiac Magnetic Resonance for Known or Suspected CAD. J Am Coll Cardiol. 2017 Aug;70(7):869–79.
6. Peper ES, Gottwald LM, Zhang Q et al. 30 times accelerated 4D flow MRI in the carotids using a Pseudo Spiral Cartesian acquisition and a Total Variation constrained Compressed Sensing reconstruction. In: Proc 27rd Annu Meet ISMRM. Paris; 2018.
7. Gottwald LM, Peper ES, Zhang Q et al. Pseudo Spiral Compressed Sensing for Aortic 4D Flow MRI: a Comparison with k-t Principal Component Analysis. In: Proc 27rd Annu Meet ISMRM. Paris; 2018.
8. Uecker et al. M. Berkeley advanced reconstruction toolbox. In: Proc Intl Soc Mag Reson Med. 2015.
9. Johnson K, Sharma P, Oshinski J. Coronary artery flow measurement using navigator echo gated phase contrast magnetic resonance velocity mapping at 3.0 T. J Biomech. 2008;41(3):595–602.
10. Marcus JT, Smeenk HG, Kuijer JP, Van der Geest RJ, Heethaar RM, Van Rossum AC. Flow profiles in the left anterior descending and the right coronary artery assessed by MR velocity quantification: effects of through-plane and in-plane motion of the heart. J Comput Assist Tomogr. 1999;23(4):567–76.
Figures