1334
Evaluation of Vascular Reactivity of Maternal Cardiovascular Adaptations During Pregnancy with Quantitative MRI
Michael C Langham1, Felix W Wehrli1, Alessandra S Caporale1, and Nadav Schwartz2
1Radiology, University of Pennsylvania, Philadelphia, PA, United States, 2Maternal Fetal Medicine, University of Pennsylvania, Philadelphia, PA, United States
1Radiology, University of Pennsylvania, Philadelphia, PA, United States, 2Maternal Fetal Medicine, University of Pennsylvania, Philadelphia, PA, United States
Synopsis
Significant maternal cardiovascular adaptations take place during pregnancy. One such alteration is a decrease in peripheral vascular resistance to accommodate an increase in cardiac output. In this pilot study, we aimed to evaluate changes in vascular reactivity during normal pregnancy by quantifying MRI surrogate markers of endothelial function. A novel quantitative MRI protocol was performed on 14 healthy pregnant women to evaluate peripheral micro- and macrovascular reactivity and central arterial stiffness. Preliminary results indicate attenuated peripheral vascular reactivity consistent with previous studies of brachial artery reactivity using ultrasound in pregnant women.
INTRODUCTION
Preeclampsia (PE) is the most serious hypertensive pregnancy disorder and is responsible for considerable perinatal morbidity and mortality [1,2]. A central component of the PE disease process is maternal vascular endothelial dysfunction (EDF), which is initiated by antiangiogenic activators that are released into the maternal circulation by malperfused placenta [3,4]. Current in vivo assessment of endothelial function is limited to brachial artery flow-mediated dilation (FMD) and carotid-femoral artery pulse-wave velocity (PWV). However, both methods have several important limitations. The aim of this pilot study was to utilize a quantitative MRI (qMRI) protocol to better understand normal changes in vascular reactivity associated with maternal cardiovascular system adaptations during pregnancy, as relative to changes in vascular reactivity in healthy, non-pregnant women. This preliminary study is a first step toward better understanding the relationship between vascular dysfunction and development of PE.METHODS
Fourteen healthy pregnant women (n=10, 2nd trimester, GA=22.7±1.1 wks; n=4, 3rd trimester, GA=34.4±3.1 wks) were examined with qMRI to compare vascular reactivity metrics relative to healthy, non-pregnant women previously participating under a different study protocol [5], Table 1. The qMRI protocol evaluated the femoral bed with dynamic venous oximetry [6], time-resolved arterial velocimetry [7] and luminal FMD quantification with a single cuff paradigm. The pulse-wave velocity along the aortic arch was quantified by resolving velocity waveforms in real-time with an ungated acquisition [8].Assessment of peripheral micro- and macrovascular endothelial function
Dynamic oximetry, and velocimetry was acquired simultaneously to time-resolve femoral vein blood oxygenation and femoral artery blood flow velocity, respectively, during reactive hyperemia in response to a 5 min cuff-induced ischemia (Fig 1). Here, cuff occlusion suspends the arterial resupply, but oxygen extraction continues in the capillary bed. The desaturated blood in the capillary bed serves as an endogenous tracer upon restoration of arterial flow via cuff deflation. The subsequent replacement of desaturated capillary blood by normally oxygenated venous blood is then temporally resolved with dynamic oximetry at the imaging location every 2s (Fig 1a). Three metrics are extracted from the time-course of femoral artery blood flow velocity during the reactive hyperemia (See Fig 1b caption for detail).
Single-slice high-spatial resolution TOF (0.625 mm) is deployed at 60, 90, 120, 180 and 240 sec after cuff deflation to estimate the maximum luminal femoral artery FMD. In Fig 2 representative high-resolution bright-blood and binarized images after applying auto thresholding are shown.
Assessment of aortic arch stiffness
The established marker of central artery stiffness is pulse-wave velocity (PWV), which is defined as the rate at which the motion of blood is transmitted to downstream locations. In our method, the velocity waveform is time-resolved without gating via complex difference signal intensity computed with velocity-encoded projections (Fig 3). The errors associated with gating and low-pass filtering (from averaging over many cardiac cycles) in conventional MRI methods [9,10] are eliminated and velocity waveforms over multiple heartbeats can be acquired in real-time at high temporal resolution (~6 ms). The time-resolved velocity waveforms are plotted jointly to determine the transit time via the “foot-to-foot” method (representing high-frequency waveform information), as routinely performed in tonometry [11]. All MR procedures were performed on a 1.5T Siemens Avanto imager (Siemens Medical Solutions) using standard RF coils (a CP extremity coil for cuff paradigm studies was placed at the location of the femoral bed, a body matrix/spine coil for PWV was placed at the location of the aortic arch). The MRI examination of peripheral vascular reactivity in the femoral bed was followed by image-guided quantification of the aortic arch PWV.
RESULTS
The bar graphs of Table 2 represent the group averages for each MRI surrogate marker of EDF. Statistically significant differences in oximetric and velocimetric parameters indicate consistency in attenuated peripheral vascular reactivity in pregnant relative to non-pregnant women. Due to the limited sample size, no comparison was made between 2nd and 3rd trimester results.DISCUSSION
Aortic arch PWV was comparable between healthy pregnant and non-pregnant women. This may demonstrate how the increased wall tension and shear stress of pregnancy (due to increase stroke volume) are offset by the systemic vasodilatory state, delaying and attenuating peripheral wave reflections [12]. The latter implies decreased aortic stiffness [13, 14]. Regarding the femoral artery, our preliminary data indicate a trend toward increased femoral artery FMD (P=0.07) in pregnant women relative to non-pregnant women. This is consistent compare to the studies of brachial FMD [15,16]. However, interestingly, all three qMRI parameters of oxygenation dynamics following reactive hyperemia (TFF, PFR and HI) were significantly reduced in pregnant women relative to non-pregnant women. These results mirror the findings of Dorup et al [16] who found reduced hyperemic response in pregnancy, although their methods were limited to US-based flow measures.CONCLUSION
Overall, our preliminary data demonstrate the potential of qMRI in establishing a normal qMRI vascular profile during pregnancy in order to better understand the pathophysiology of PE in future studies.Acknowledgements
NIH R01 HL139358, NIH UL1 TR001878, NIH U01 HD087180.References
[1] Hutcheon et al, Best Pract Res Clin Obstet Gynaecol. 2011; [2] Lisonkova et al, Obstet Gynecol. 2014; [3] Roberts JM. Semin Reprod Endocrinol. 1998; [4] Roberts et al, Am J Obstet Gynecol. 1989; [5] Caporale et al, Radiology 2019; [6] Langham et al, JACC 2010; [7] Langham et al, JCMR 2011; [8] Langham et al, MRM 2011; [9] Mohiaddin et al, J Appl Physiol. 1993; [10] Rogers et al, JACC 2001; [11] Van Bortel et al. Am J Hypertens. 2002; [12] Poppas et al, Circ 1997; [13] Laurent et al, Eur Heart J. 2006; [14] Wilenius et al, BMC Cardiovasc Disord. 2016; [15] Torrado et al, Int J Reprod Med 2015; [16] Dorup et al, Am J Physiol 1999.Figures
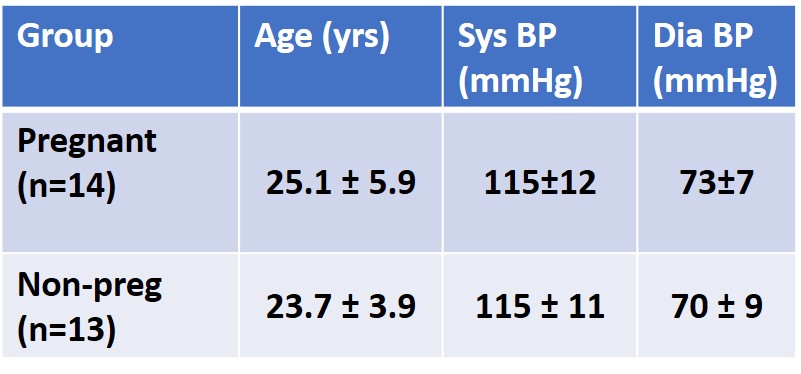
Table 1 Subject profile.
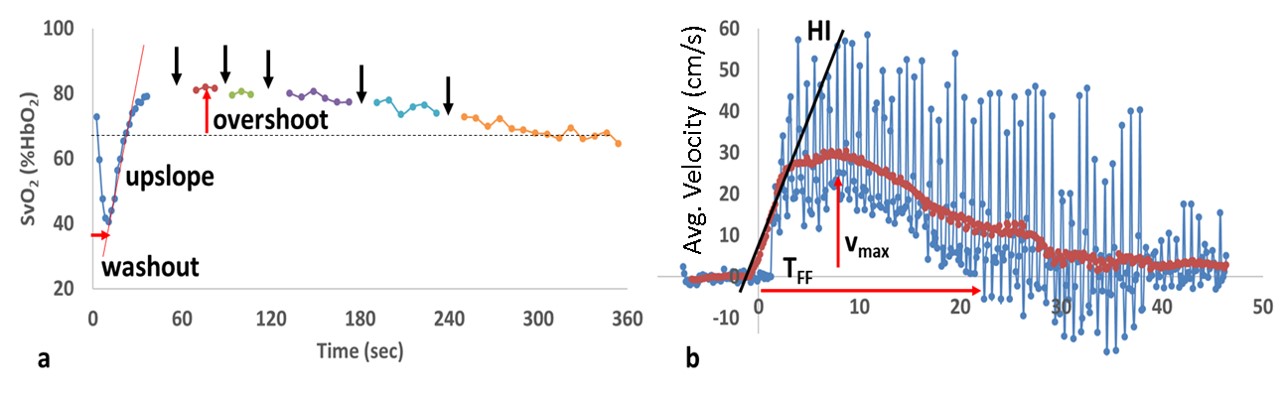
Fig 1 Quantification of peripheral vascular reactivity with
dynamic oximetry and velocimetry. a) Temporally resolved SvO2
following cuff deflation at t=0. Dashed horizontal line indicate basal SvO2.
Black arrows indicate suspension of dynamic oximetry to acquire high resolution
TOF for estimating femoral artery FMD. b) The arterial velocity time-course
(blue) where individual spikes represent systolic peaks, burgundy line
represents 3s sliding-window average of velocity. See text for detail.
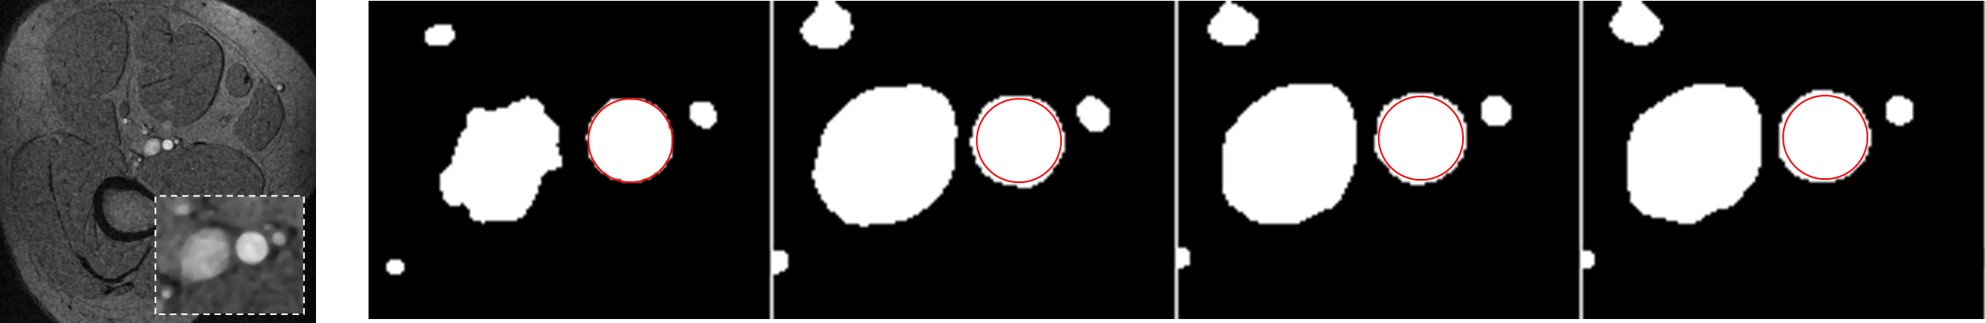
Fig 2 Femoral artery luminal FMD
using high-resolution bright blood imaging. a) Sample magnitude image.
Inset show magnified view of superficial femoral vessels at rest. b)
Binarized images for quantifying luminal area. First image is acquired prior to
cuff occlusion and the last two images were acquired at 60 and 90s after the
cuff deflation. Red circle is overlaid to help visualize dilation relative to
baseline (first image). In this pregnant subject the maxim FMD (18%) occurred
at 60s after cuff deflation.
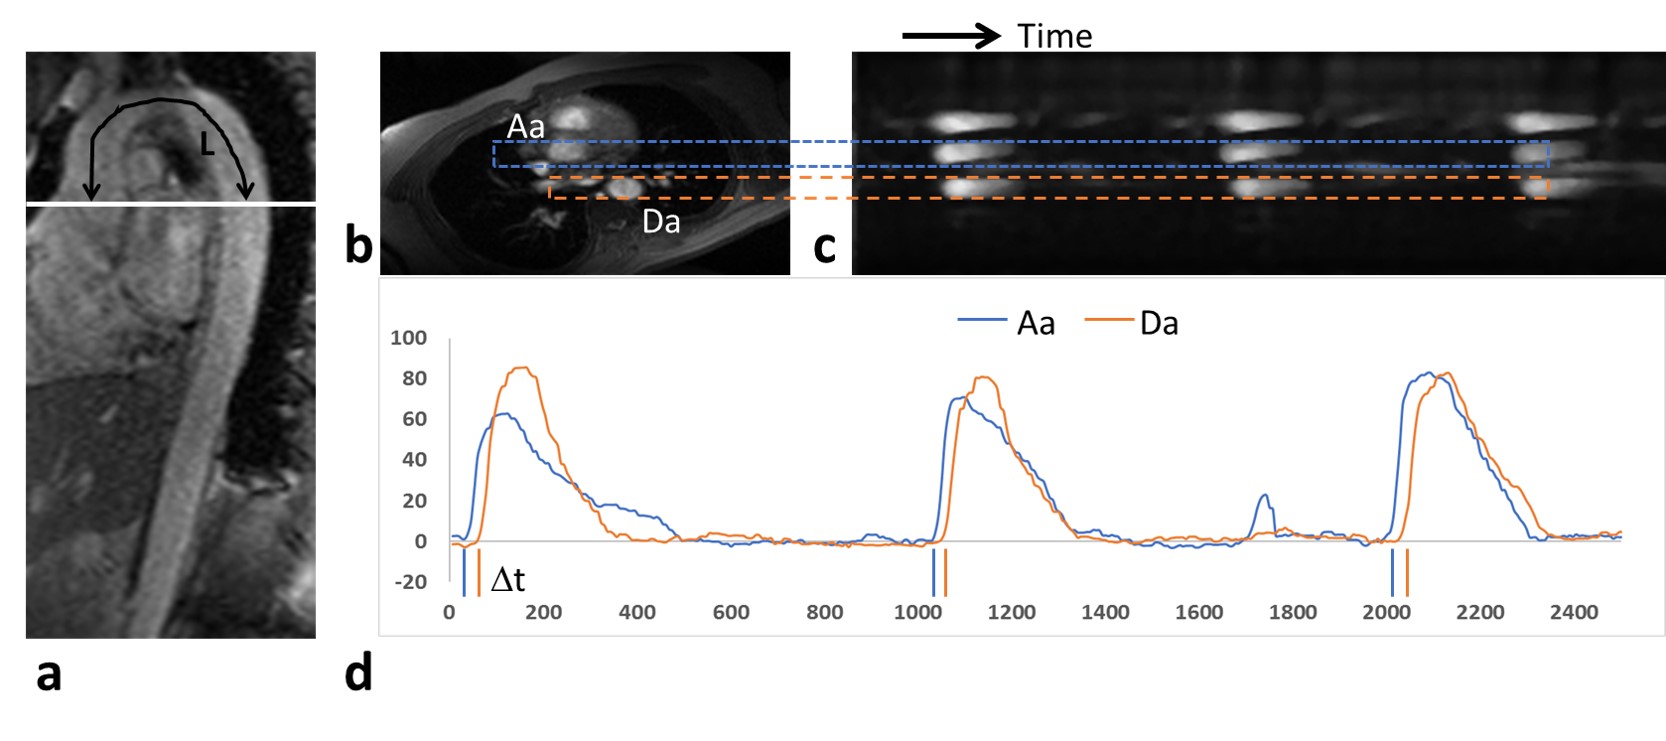
Fig 3 Non-cardiac
triggered aortic PWV quantification. a) Oblique sagittal
image of the aorta. Black line represents the path length L of the velocity
wave. While line is the position of the b) reference axial
image, where ascending (Aa) and descending (Da) aorta are identified. The
readout direction is oriented vertically to help identify Aa and Da on complex
difference intensity |CD| image of c) as denoted by the
dashed rectangles. d) |CD| time-course
from c) show delay of
velocity wave at Da relative to Aa. Δt is the transit time of the velocity wave
from Aa to Da. PWV is computed as L/Δt.
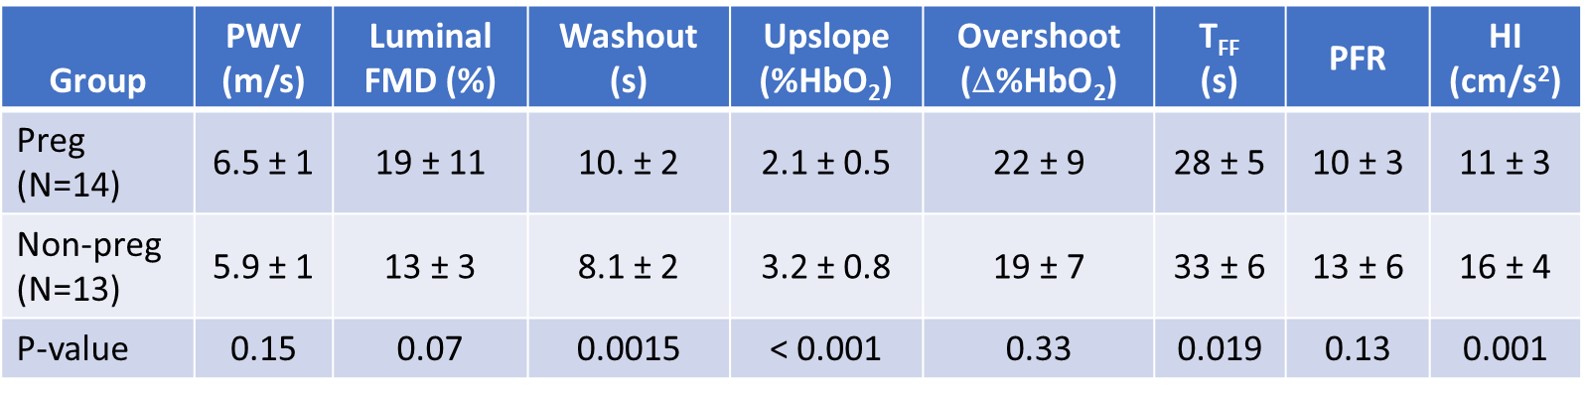
Table 2 Differences in the vascular reactivity
between healthy pregnant and non-pregnant women. See Discussion for more detail.