1333
Longitudinal study of 4D flow MRI derived aortic hemodynamics in bicuspid aortic valve patients with repaired coarctation.1Department of Radiology, Feinberg School of Medicine, Northwestern University, Chicago, IL, United States, 2Department of Medical Imaging, Ann & Robert H. Lurie Children’s Hospital of Chicago,, Chicago, IL, United States, 3Department of Radiology, Feinberg School of Medicine, and Department of Biomedical Engineering, McCormick School of Engineering; Northwestern University, Chicago, IL, United States
Synopsis
Bicuspid aortic valve (BAV) patients with history of aortic coarctation are considered higher risk for aortic complications. We evaluated 4D flow aortic metrics in 15 BAV adults with coarctation repair (mean age 35y) retrospectively reviewed at baseline and follow-up (3.98y [2.10 to 4.96y ]). Areas of higher wall shear stress were mainly located in the arch, and 4D flow metrics remained stable at follow-up. Aortic growth was slow, with a significant increase in the anterior arch (0.25mm/y) and diaphragmatic aorta (0.27mm/y). At baseline, peak velocity at the coarctation repair site was inversely correlated to mid arch and diaphragmatic aortic growth.
INTRODUCTION
Aortic coarctation is frequently associated with bicuspid aortic valve (BAV). History of coarctation is considered a risk factor for BAV-related aortopathy leading to a lower threshold for prophylactic ascending aorta replacement(1). Recently 4D flow derived metrics have changed our understanding of the mechanism of arterial wall damage in BAV aortopathy, showing alteration of tissue wall components in areas of high wall shear stress (2). However, 4D flow data in BAV patient with an history of repaired coarctation are confined to cross sectional studies, and a limited number of metrics have been evaluated(3,4). The goal of this study was to evaluate 4D flow derived hemodynamic metrics at baseline and during a multiyear follow-up in BAV patients with repaired coarctation and evaluate the relationships of these parameters with aortic growth.METHODS
We retrospectively reviewed BAV patients with a previous coarctation repair who had at least 2 MRIs including a 4D flow acquisition. One patient with coarctation stenting and two patients with history of repaired complex congenital heart disease (Arterial switch operation and double outlet right ventricle) were excluded. Two patients with history of aortic valve replacement with a bioprosthetic valve were included, but the proximal aorta was not included in the analysis due to artifacts. None of the patients underwent an aortic intervention during the follow-up. Aortic diameters were evaluated perpendicular to centerline using multiplanar reformatting at 9 locations along the aorta by the same observer blinded tothe 4D flow results(Figure 1A). After in-house preprocessing (eddy current correction, denoising and aliasing correction), aorta was segmented using a fully automated algorithm and eventually corrected manually (5). Peak velocity maps, wall shear stress (WSS) maps, heats maps and PWV were calculated using an in-house software. WSS was averaged for 5 systolic time frames. Heats maps were calculated from an atlas of age/gender matched controls (N=10 subjects per atlas),, showing area of WSS > or < to 95% of normal values(6). Four regions of interest (ROI) were drawn for peak velocity maps: Ascending aorta (AAo); Aortic Arch (AArch); descending aorta (DA) and coarctation zone. For WSS maps, 10 ROIs were used for both the inner and outer aorta at the proximal AA, Distal AA, AArch, proximal DA, and distal DA (Figure 1).RESULTS
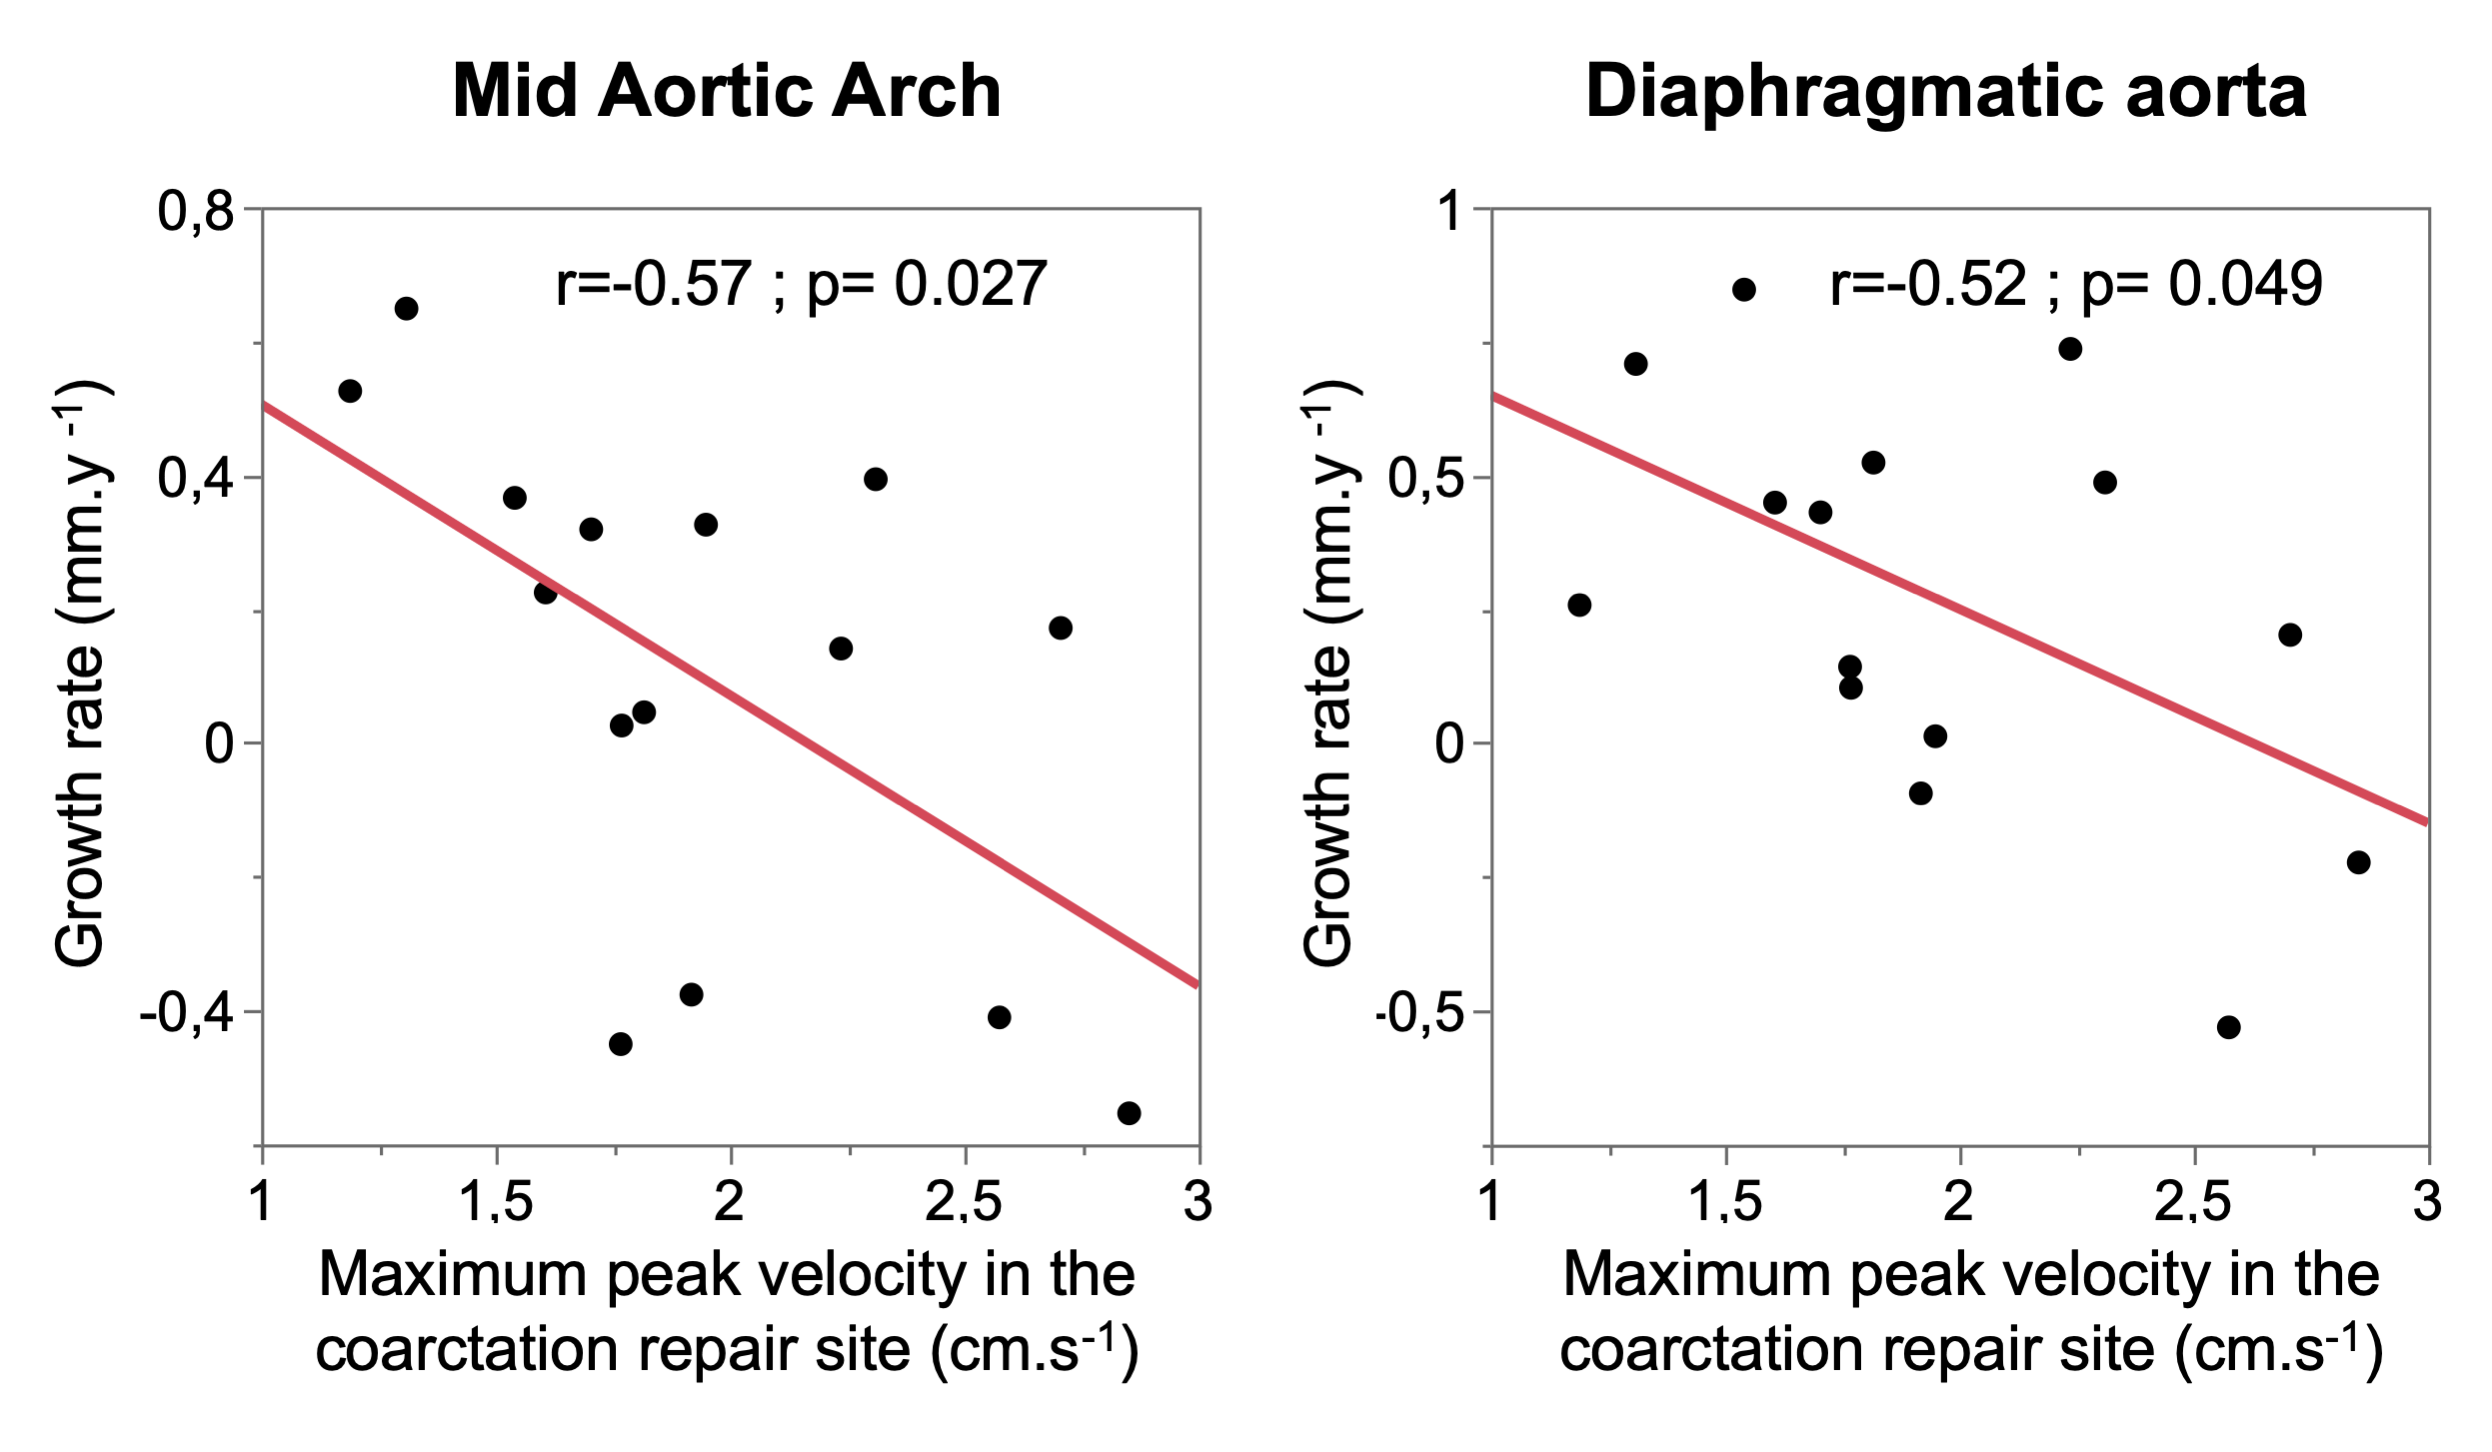
The final cohort included 15 patients (mean age 35 ± 8y, 9 males) with a median follow-up of 3.98 y [2.10 – 4.96 ]. Baseline patient characteristics are summarized in figure 2. Compared to baseline, significant aortic diameter increases were observed only in the anterior AArch (growth rate 0.26 ± 0.41 mm/y), isthmus (0.25 ± 0.38 mm/y), and diaphragmatic aorta ( 0.27 ±0.38 mm/y) ( Figure 3). At baseline, areas of high WSS (> 95% age matched controls) were predominant in outer AArch ( 30.1% [2.3 – 62.2]), inner AArch (33.5% [16.2 – 71.9] ), outer distal AAo ( 21.9 % [0.6 – 43.0]), outer proximal DAo (15.0% [6.2 – 41.8]) ( Figure 4). There were no significant differences in mean WSS, peak velocities, and PWV at follow-up. Of possible 4D flow baseline determinants of aortic growth rate, only peak maximal velocity was significant, higher peak velocities in the coarctation were associated with narrowing in the mid AArch (r=-0.57, p=0.027) and diaphragmatic aorta(r=-0.52; p= 0.049). ( Figure 5).DISCUSSION
Aortic hemodynamics metrics derived from 4D flow MRI in BAV patient with repaired aortic coarctation were stable at follow-up of. Compared to an atlas of age/gender controls; areas of high wall shear stress were located in the outer part of the aortic arch differing from previous results in BAV without coarctation(7). Aortic growth was small, which could be expected in this cohort with mainly non-dilated aortas, and ranged between normal growth rate (0.1mm/y)(8) and growth rate in dilated BAV (0.4mm/y)(9), limiting the analysis of the determinant of aortic growth. However, we found that peak velocity at baseline was negatively correlated with diameter changes of the mid aortic arch and diaphragmatic aorta, likely due to a decreasing of aortic diameter in patients with higher peak velocities, potentially evolving to a re-coarctation.CONCLUSION
Aortic hemodynamics were stable in the follow-up of BAV patients with coarctation repair, who experienced a slow growth rate of their aortic diameters. Among the 4D flow metrics, peak velocity at baseline was inversely correlated with aortic growth in mid arch and diaphragmatic aorta.Acknowledgements
Funding was provided by National Institutes of Health (Grant Nos. R01HL115828 and R01HL133504 and F30HL145995). Gilles Soulat received grant support from the French College of Radiology Teachers ( CERF) and French Radiology Society (SFR).References
1. Erbel R, Aboyans V, Boileau C, et al. 2014 ESC Guidelines on the diagnosis and treatment of aortic diseases: Document covering acute and chronic aortic diseases of the thoracic and abdominal aorta of the adult. The Task Force for the Diagnosis and Treatment of Aortic Diseases of the European Society of Cardiology (ESC). Eur Heart J 2014;35(41):2873-2926.
2. Guzzardi DG, Barker AJ, van Ooij P, et al. Valve-Related Hemodynamics Mediate Human Bicuspid Aortopathy: Insights From Wall Shear Stress Mapping. J Am Coll Cardiol 2015;66(8):892-900.
3. Frydrychowicz A, Markl M, Hirtler D, et al. Aortic Hemodynamics in Patients With and Without Repair of Aortic Coarctation: In Vivo Analysis by 4D Flow-Sensitive Magnetic Resonance Imaging. Investigative Radiology 2011;46(5):317-325.
4. Riesenkampff E, Fernandes JF, Meier S, et al. Pressure fields by flow-sensitive, 4D, velocity-encoded CMR in patients with aortic coarctation. JACC Cardiovasc Imaging 2014;7(9):920-926.
5. Berhane H, Scott M, Robinson JD, Rigsby CK, Markl M. 3D U-Net for Automated Segmentation of the Thoracic Aorta in 4D-Flow derived 3D PC-MRA. ISMRM2019 2019
6. van Ooij P, Potters WV, Nederveen AJ, et al. A methodology to detect abnormal relative wall shear stress on the full surface of the thoracic aorta using four-dimensional flow MRI. Magn Reson Med 2015;73(3):1216-1227.
7. van Ooij P, Potters WV, Collins J, et al. Characterization of abnormal wall shear stress using 4D flow MRI in human bicuspid aortopathy. Ann Biomed Eng 2015;43(6):1385-1397.
8. Turkbey EB, Jain A, Johnson C, et al. Determinants and normal values of ascending aortic diameter by age, gender, and race/ethnicity in the Multi-Ethnic Study of Atherosclerosis (MESA). J Magn Reson Imaging 2014;39(2):360-368.
9. Detaint D, Michelena HI, Nkomo VT, Vahanian A, Jondeau G, Sarano ME. Aortic dilatation patterns and rates in adults with bicuspid aortic valves: a comparative study with Marfan syndrome and degenerative aortopathy. Heart 2014;100(2):126-134.
Figures
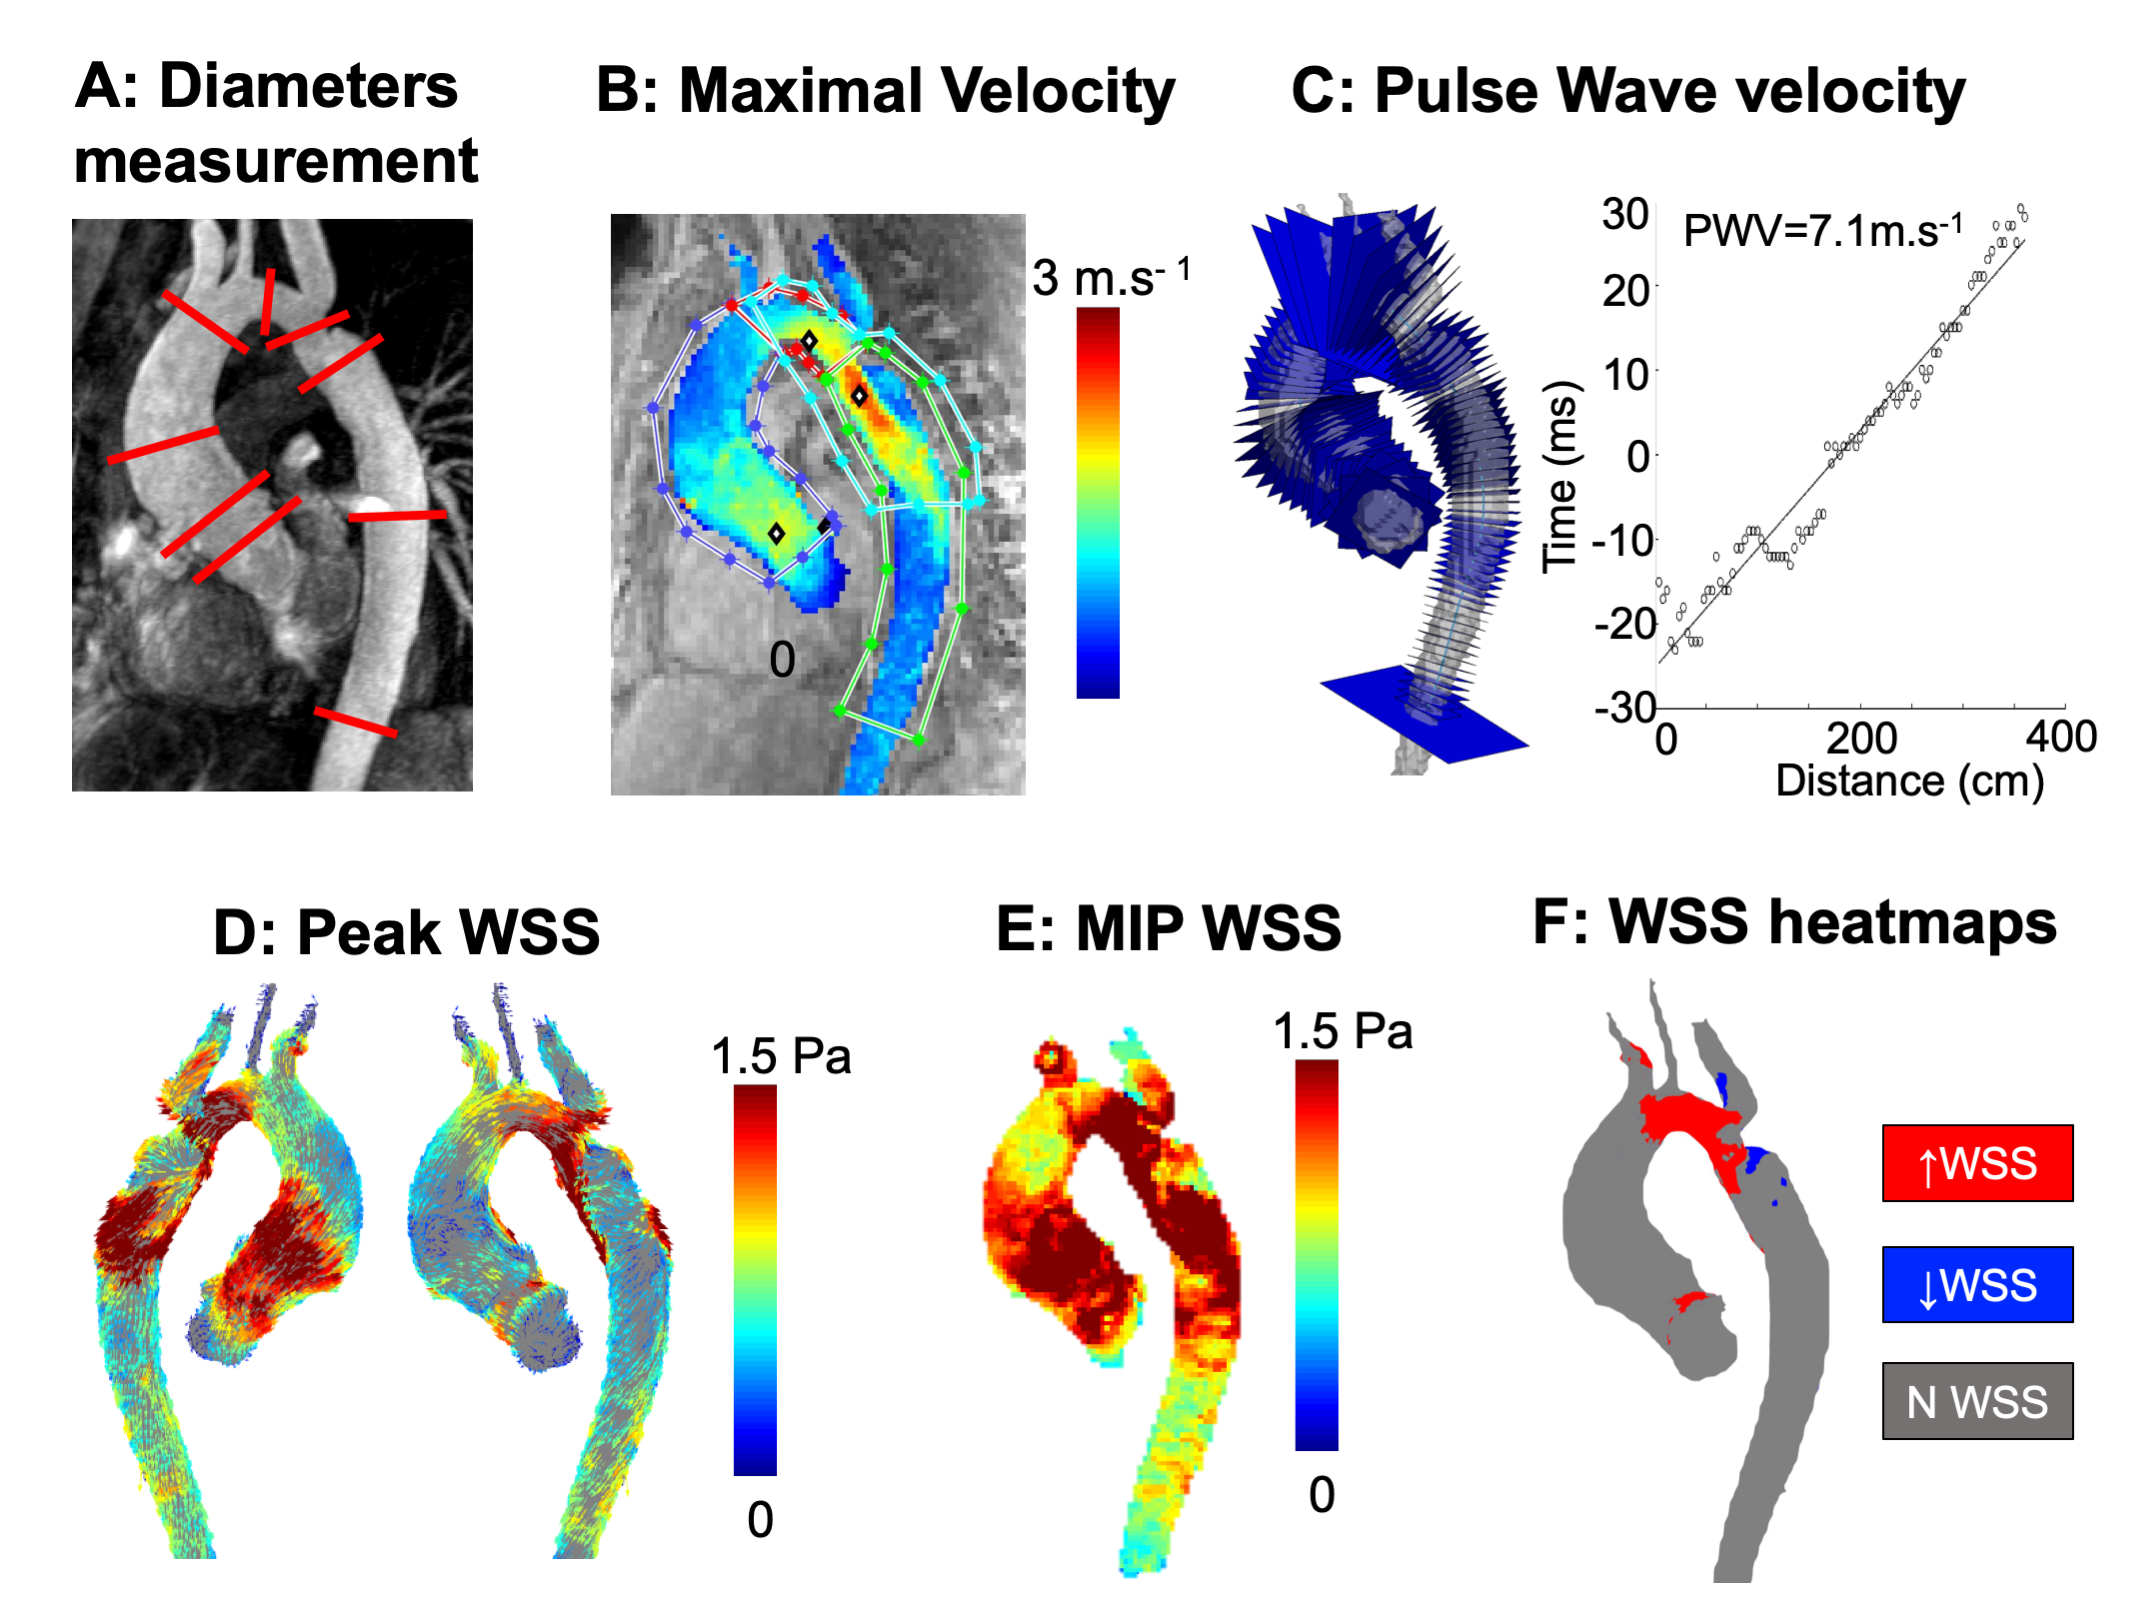
Figure 1: MRI analysis.
A: Representation of diameters measurement location along the aorta. B: Peak velocity map with ROI in AAo (dark blue), AArch (red) DAo (green) and coarctation zone (bright blue). C: PWV calculated from linear regression between distance and time shift obtained using XCorrelation between flow curves extracted from planes perpendicular to the centerline. D: WSS at peak systole. E: WSS MIP averaged from 5 time frames around peak systole. F: WSS heatmaps calculated from an age/gender matched atlas showing area of abnormal high WSS in red and low WSS in blue.

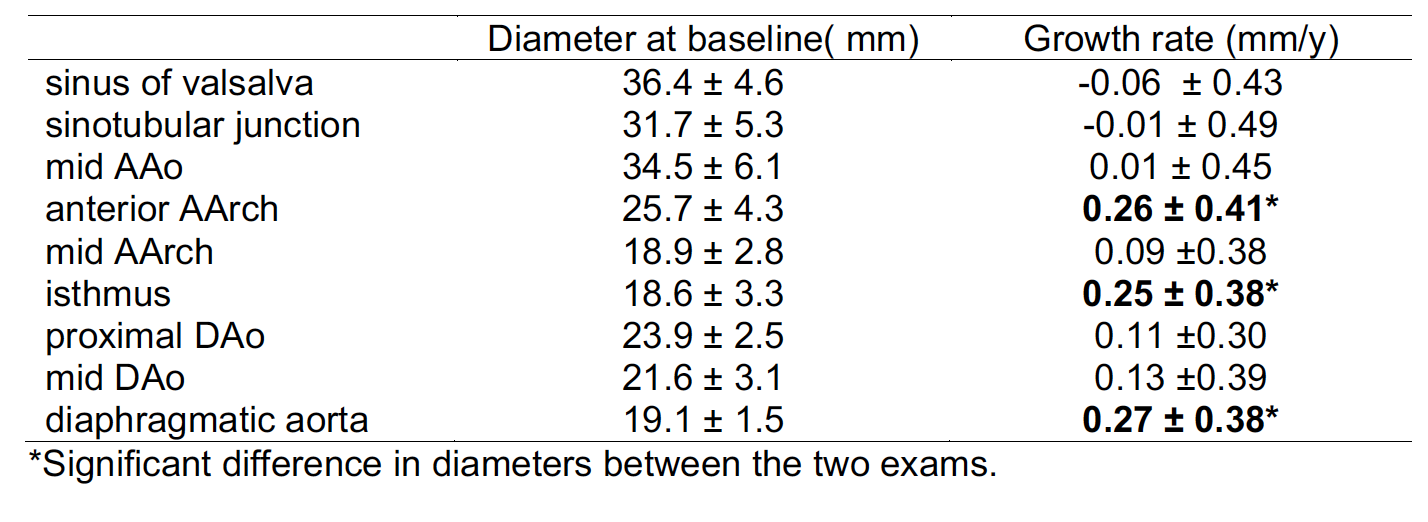
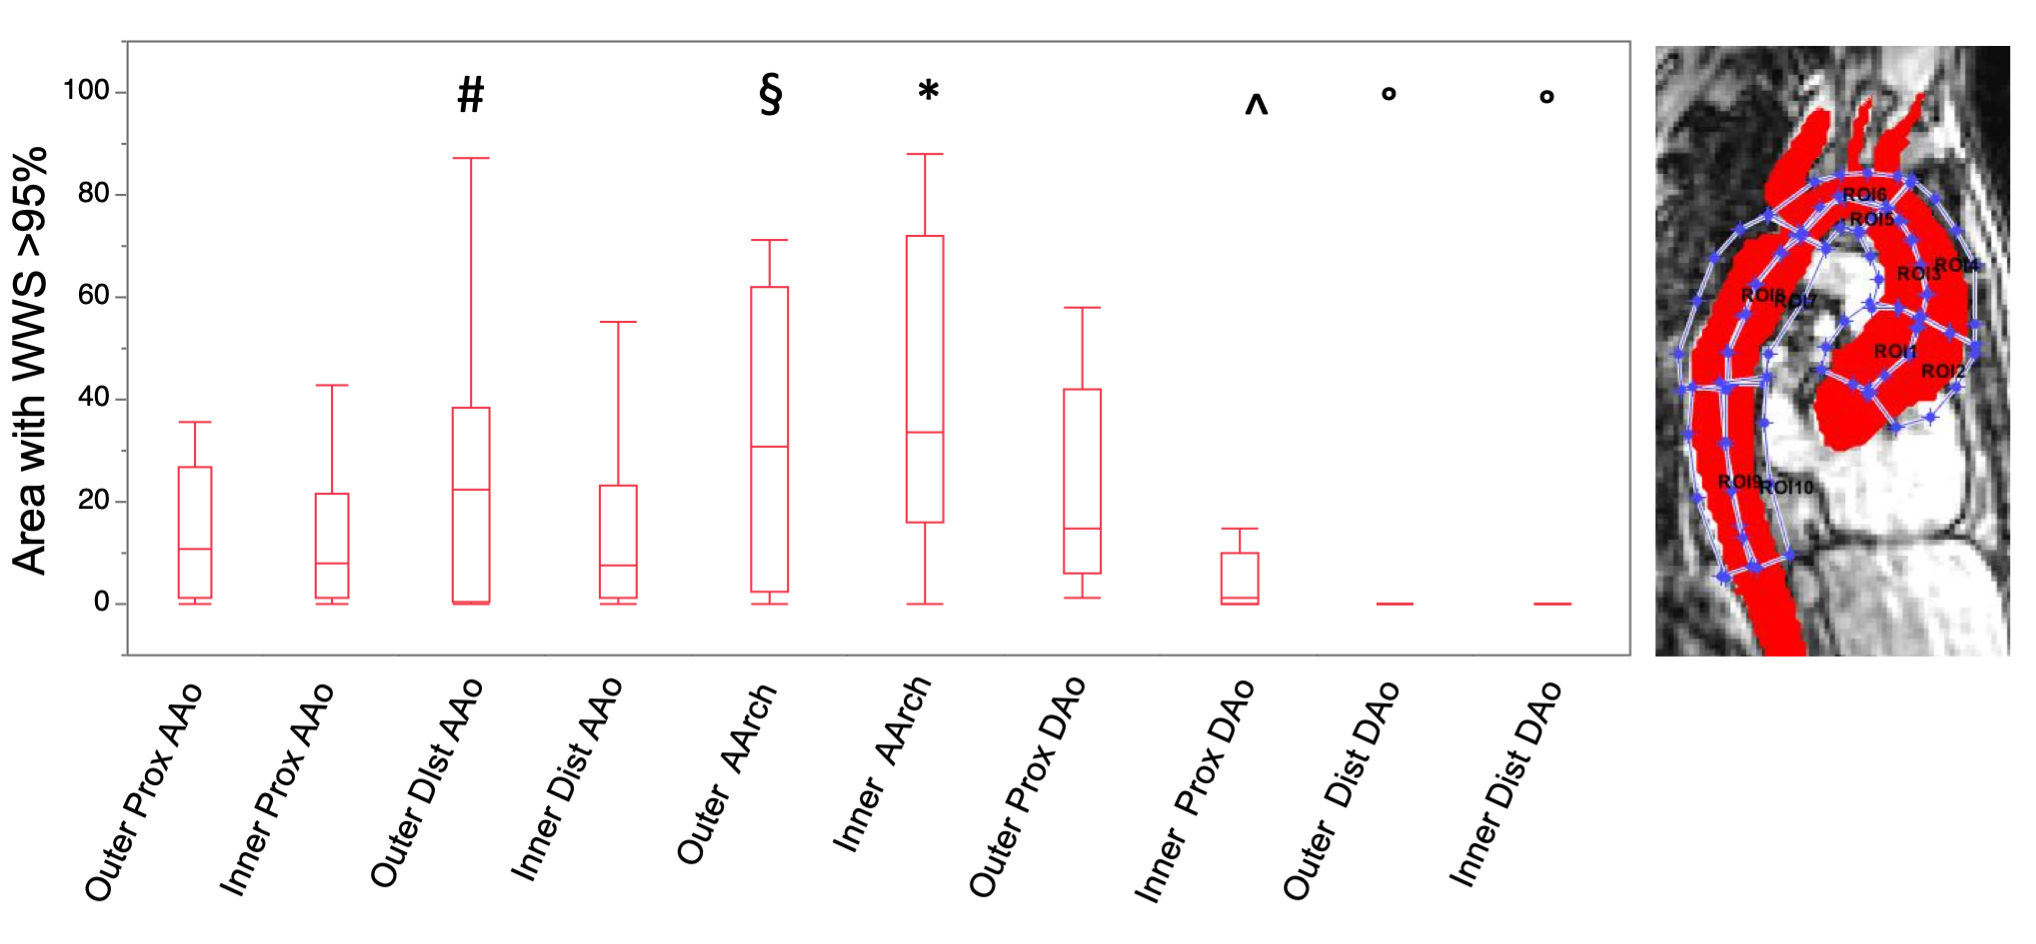
Figure 4: % aortic area with WSS>95% of normal value from age/gender matched aortic atlas.
*: p<0.05 against all, except outer distal AAo and outer proximal DAo
#: p<0.05 against inner distal AAo, inner proximal DAo
§: p<0.05 against inner distal AAo and inner distal proximal DAo
^: p<0.05 against outer proximal AAo and outer proximal DAo
°: p<0.05 against all except outer and inner distal Dao respectively