1327
Outcome of Catheter-direct Thrombolysis for Deep Vein Thrombosis using T1-weighted Magnetic Resonance Black-blood Thrombus Imaging1Guangzhou panyu central hospital, Guangzhou, China, 2Guangzhou medical university, Guangzhou, China, 3Shenzhen Institutes of Advanced Technology, Shenzhen, China, 4Cedars-Sinai Medical Center, Los Angeles, CA, United States
Synopsis
The present study aims to evaluate the outcome of thrombolysis for acute DVT using the thrombus signal characteristics generated by a T1-weighted MR black-blood thrombus imaging (BTI) technique.The patients were divided into iso- or hyper-intense thrombus groups according to the BTI images and the additional CDT were performed .The thrombolysis ratio of patients with iso-intense signals was significantly higher than hyper-intense ones .However, the patients with iso-intense thrombus had a lower incidence rate of PTS at 6 and 12 months.So,the thrombus signal characteristics on BTI images maybe used to predict the outcome of DVT treated with the lytic therapy.
BACKGROUND
Deep venous thrombosis (DVT) occurs when blood clots form in one or more leg veins, leading to venous obstruction and adversely impacting the venous return 1. It is the main cause of fatal pulmonary embolism (PE) and leads to post-thrombotic syndrome (PTS) 2. PTS develops in 20-50% of DVT patients within 2 years, even though the patients are under standard treatment 2-4. Although extensive efforts have been made in the past years, the risk factors for PTS are still incompletely understood, and which type of DVT patients are more likely to develop PTS remains undetermined. 5, 6The present study aims to evaluate the outcome of thrombolysis for acute DVT using the thrombus signal characteristics generated by a T1-weighted MR black-blood thrombus imaging (BTI) technique.METHODS
A total of 54 eligible acute DVT patients were consecutively enrolled and underwent a BTI scan. All patients were scanned in a supine position using a combination of a 6-channel body coil, an 8-channel peripheral vascular coil, and an integrated spine array coil. A BTI technique, employing T1-weighted variable flip angle three dimensional (3D) fast-spin-echo for data readout and a delay alternating with nutation for tailored excitation (DANTE) module for blood flow signal suppression, was used for data acquisition due to its superior performance for blood flow suppression and thrombus visualization.7 Scan parameters of BTI were: TR/TE = 650/11 ms, field of view = 352 mm × 352 mm, spatial resolution = 1.4 mm × 1.4 mm × 1.4 mm reconstructed to 0.7 mm × 0.7 mm × 0.7 mm, number of partitions = 208-256, bandwidth = 698 Hz/pixel, DANTE pulse train length = 125, and DANTE flip angle = 15°. The scan time of the three-station BTI scan was 10-15 min.8 The patients were divided into iso- or hyper-intense thrombus groups according to the thrombus signal characteristics on the BTI images. The procedures of the thrombolytic therapy with additional CDT were performed according to the standard guidelines. 9-12Thrombolytic ratio was assessed for the patients with additional CDT treatment and post-thrombotic syndrome (PTS) was diagnosed with the Villalta score for all patients. Clinical visits at 1, 6, and 12 months after the treatment were done for evaluating the primary outcome of the lytic therapy. Statistical analyses were performed to evaluate whether the primary outcome was different between the patients with iso- and hyper-intense thrombus.RESULTS
46 patients were included in the per-protocol analysis. For the patients with additional CDT, the thrombolysis ratio was independent of the duration of symptoms. The thrombolysis ratio of patients with iso-intense signals was significantly higher than that of the patient with hyper-intense ones (73.8 ± 21.4 % vs. 58.1 ± 21.0 %, p = 0.029). There was no significant difference in PTS between the patients with iso- and hyper-intense thrombus at the 1 month follow-up. However, the patients with iso-intense thrombus had a significantly lower incidence rate of PTS than those with hyper-intense one at 6 (0.0% vs. 53.8%, p < 0.001) and 12 months (3.0% vs. 38.5%, p = 0.005).CONCLUSIONS
The thrombus signal characteristics on BTI images maybe used to predict the outcome of acute DVT treated with the lytic therapy.Acknowledgements
None.References
1.Kyrle PA ,Eichinger S. Deep vein thrombosis. Lancet. 2005;365:1163-74.
2.Heit JA. The epidemiology of venous thromboembolism in the community. Arterioscler Thromb Vasc Biol. 2008;28:370-2.
3.Rabinovich A, Kahn SR. How I treat the postthrombotic syndrome. Blood. 2018;131:2215-2222. 4.Guanella R ,Kahn SR. Post-thrombotic syndrome: current prevention and management strategies. Expert Rev Cardiovasc Ther. 2012;10:1555-66.
5.Kahn SR, Galanaud JP, Vedantham S,et al. Guidance for the prevention and treatment of the post-thrombotic syndrome. J Thromb Thrombolysis. 2016;41:144-53.
6.Vedantham S. Treating infrainguinal deep venous thrombosis. Tech Vasc Interv Radiol. 2014;17:103-8. 7.Xie G, Chen H, He X,et al. Black-blood thrombus imaging (BTI): a contrast-free cardiovascular magnetic resonance approach for the diagnosis of non-acute deep vein thrombosis. J Cardiovasc Magn Reson. 2017;19:4.
8.Chen H,He X,Xie G,et al.Cardiovascular magnetic resonance black blood thrombus imaging for the diagnosisof acute deep vein thrombosis at 1.5 Tesla. J Cardiovasc Magn Reson. 2018;20:42.
9.Kearon C, Kahn SR, Agnelli G,et al. Antithrombotic therapy for venous thromboembolic disease: American College of Chest Physicians Evidence-Based Clinical Practice Guidelines (8th Edition). Chest. 2008;133:454S-545S.
10.Vedantham S, Goldhaber SZ, Kahn SR, et al. Rationale and design of the ATTRACT Study: a multicenter randomized trial to evaluate pharmacomechanical catheterdirected thrombolysis for the prevention of postthrombotic syndrome in patients with proximal deep vein thrombosis. Am Heart J 2013;165(4):523-530.e3
11.Vedantham S, Thorpe PE, Cardella JF, et al. Quality improvement guidelines for the treatment of lower extremity deep vein thrombosis with use of endovascular thrombus removal. J Vasc Interv Radiol 2006;17:435-47.
12.Vedantham S, Sista AK, Klein SJ, et al. Quality improvement guidelines for the treatment of lower-extremity deep vein thrombosis with use of endovascular thrombus removal. J Vasc Interv Radiol 2014;25:1317-25
Figures
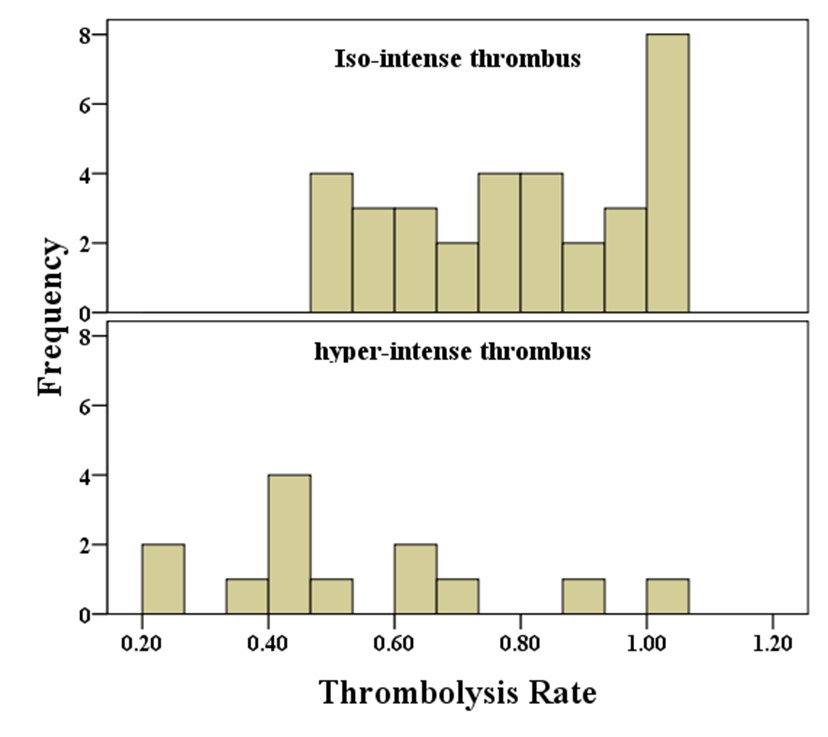
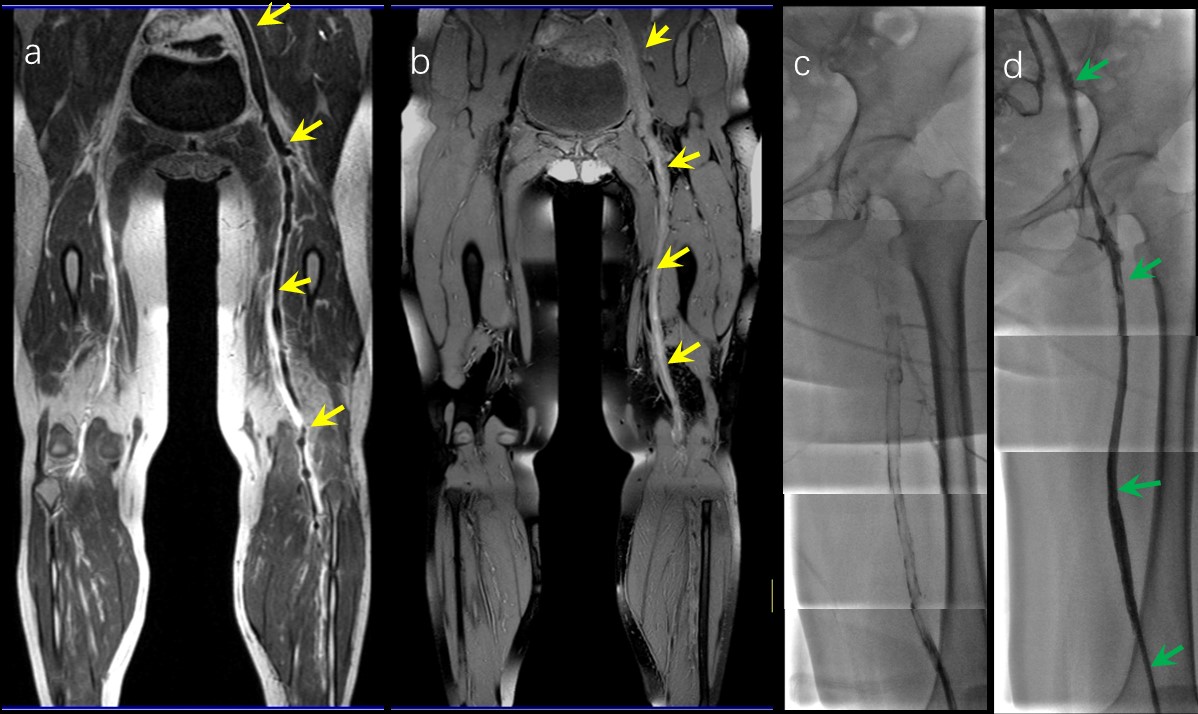
Figure 3.Representative images obtained by contrast-enhanced cardiovascular magnetic resonance (CE-CMRV) and black blood thrombus imaging (BBTI) from a 28-year-old woman with deep venous thrombosis (DVT) symptom and additional CDT by Digital Subtraction Angiography (DSA)
a. Image obtained by CE-CMRV, the thrombi (yellow arrows) were shown. b. The iso-intense thrombus signals detected by BBTI ,the thrombi (yellow arrows) were shown.
c. Image obtained by DSA before CDT.
d. Image obtained by DSA after CDT,occlusion of the vein completely recanalized were shown. (green arrows).
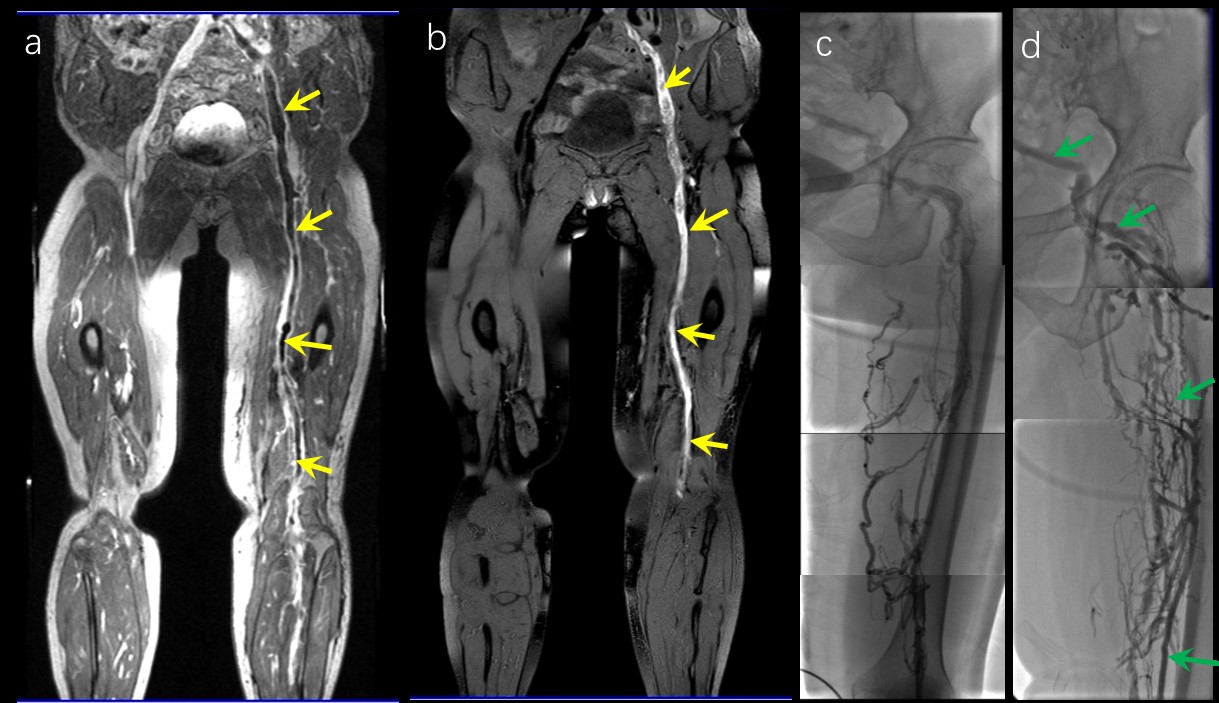
Figure 4 Representative images obtained by contrast-enhanced cardiovascular magnetic resonance (CE-CMRV) and black blood thrombus imaging (BBTI) from a 66-year-old woman with deep venous thrombosis (DVT) symptom and additional CDT by Digital Subtraction Angiography (DSA)
a. Image obtained by CE-CMRV, the thrombi (yellow arrows) were shown. b. The hyper-intense thrombus signals detected by BBTI ,the thrombi (yellow arrows) were shown.
c. Image obtained by DSA before CDT.
d. Image obtained by DSA after CDT. Occlusion of the vein still blocked were shown. (green arrows).