1324
Highly Accelerated Subtractive NCE-MRA using Advanced k-space Subtraction and Magnitude Subtraction Reconstruction Methods1Department of Radiology, University of Cambridge, Cambridge, United Kingdom, 2Department of Radiology, Addenbrooke’s Hospital, Cambridge, United Kingdom
Synopsis
We implemented two advanced reconstruction methods for highly accelerated subtractive NCE-MRA, which can exploit the sparsity of subtracted angiograms. One method is based on k-space subtraction of complex raw data with phase and intensity correction (KSPIC). Another method is to reconstruct bright- and dark-blood data with an additional magnitude subtraction term in the cost function to exploit the sparsity. The performance of the two methods was evaluated in both retrospective and prospective accelerated datasets using quantitative metrics and qualitative scoring. Compared with conventional methods, they both showed improved image reconstruction quality, while KSPIC had the best performance.
Introduction
Subtractive non-contrast-enhanced MR angiography (NCE-MRA) techniques, such as fresh-blood-imaging (FBI)1, display vasculature by subtracting dark-blood images from bright-blood images. Different acceleration techniques can be used to reduce their long acquisition times, including compressed sensing (CS), parallel imaging (PI)2 and partial Fourier sampling (PF)1.Different reconstruction strategies can be used for accelerated subtractive NCE-MRA. A common method is to perform reconstruction on bright- and dark-blood datasets separately followed by magnitude subtraction (MS), however this does not take advantage of sparsity in the subtracted angiogram. Rapacchi et al. proposed an improved method that combines bright- and dark-blood reconstruction together and adds a magnitude subtraction term in the cost function to exploit the sparsity3 (here called ‘combined magnitude subtraction’, CMS). Complex subtraction in k-space (KS) prior to reconstruction is an alternative approach to promote sparsity. However, the signal of some tissues becomes negative after subtraction and appears as background artefacts due to the reversed polarity4,5.
In this study, k-space Subtraction with Phase and Intensity Correction (KSPIC), is implemented in 3D femoral FBI. It uses a phase correction procedure to recover the polarity of negative values and an intensity correction (IC) procedure6 that uses a weighted subtraction to suppress residual background signal. CMS was also implemented for comparison, with IC applied as a post-processing procedure to further improve background suppression (CMS-IC). Their performance is compared with conventional KS and MS in both retrospective and prospective acceleration studies.
Methods
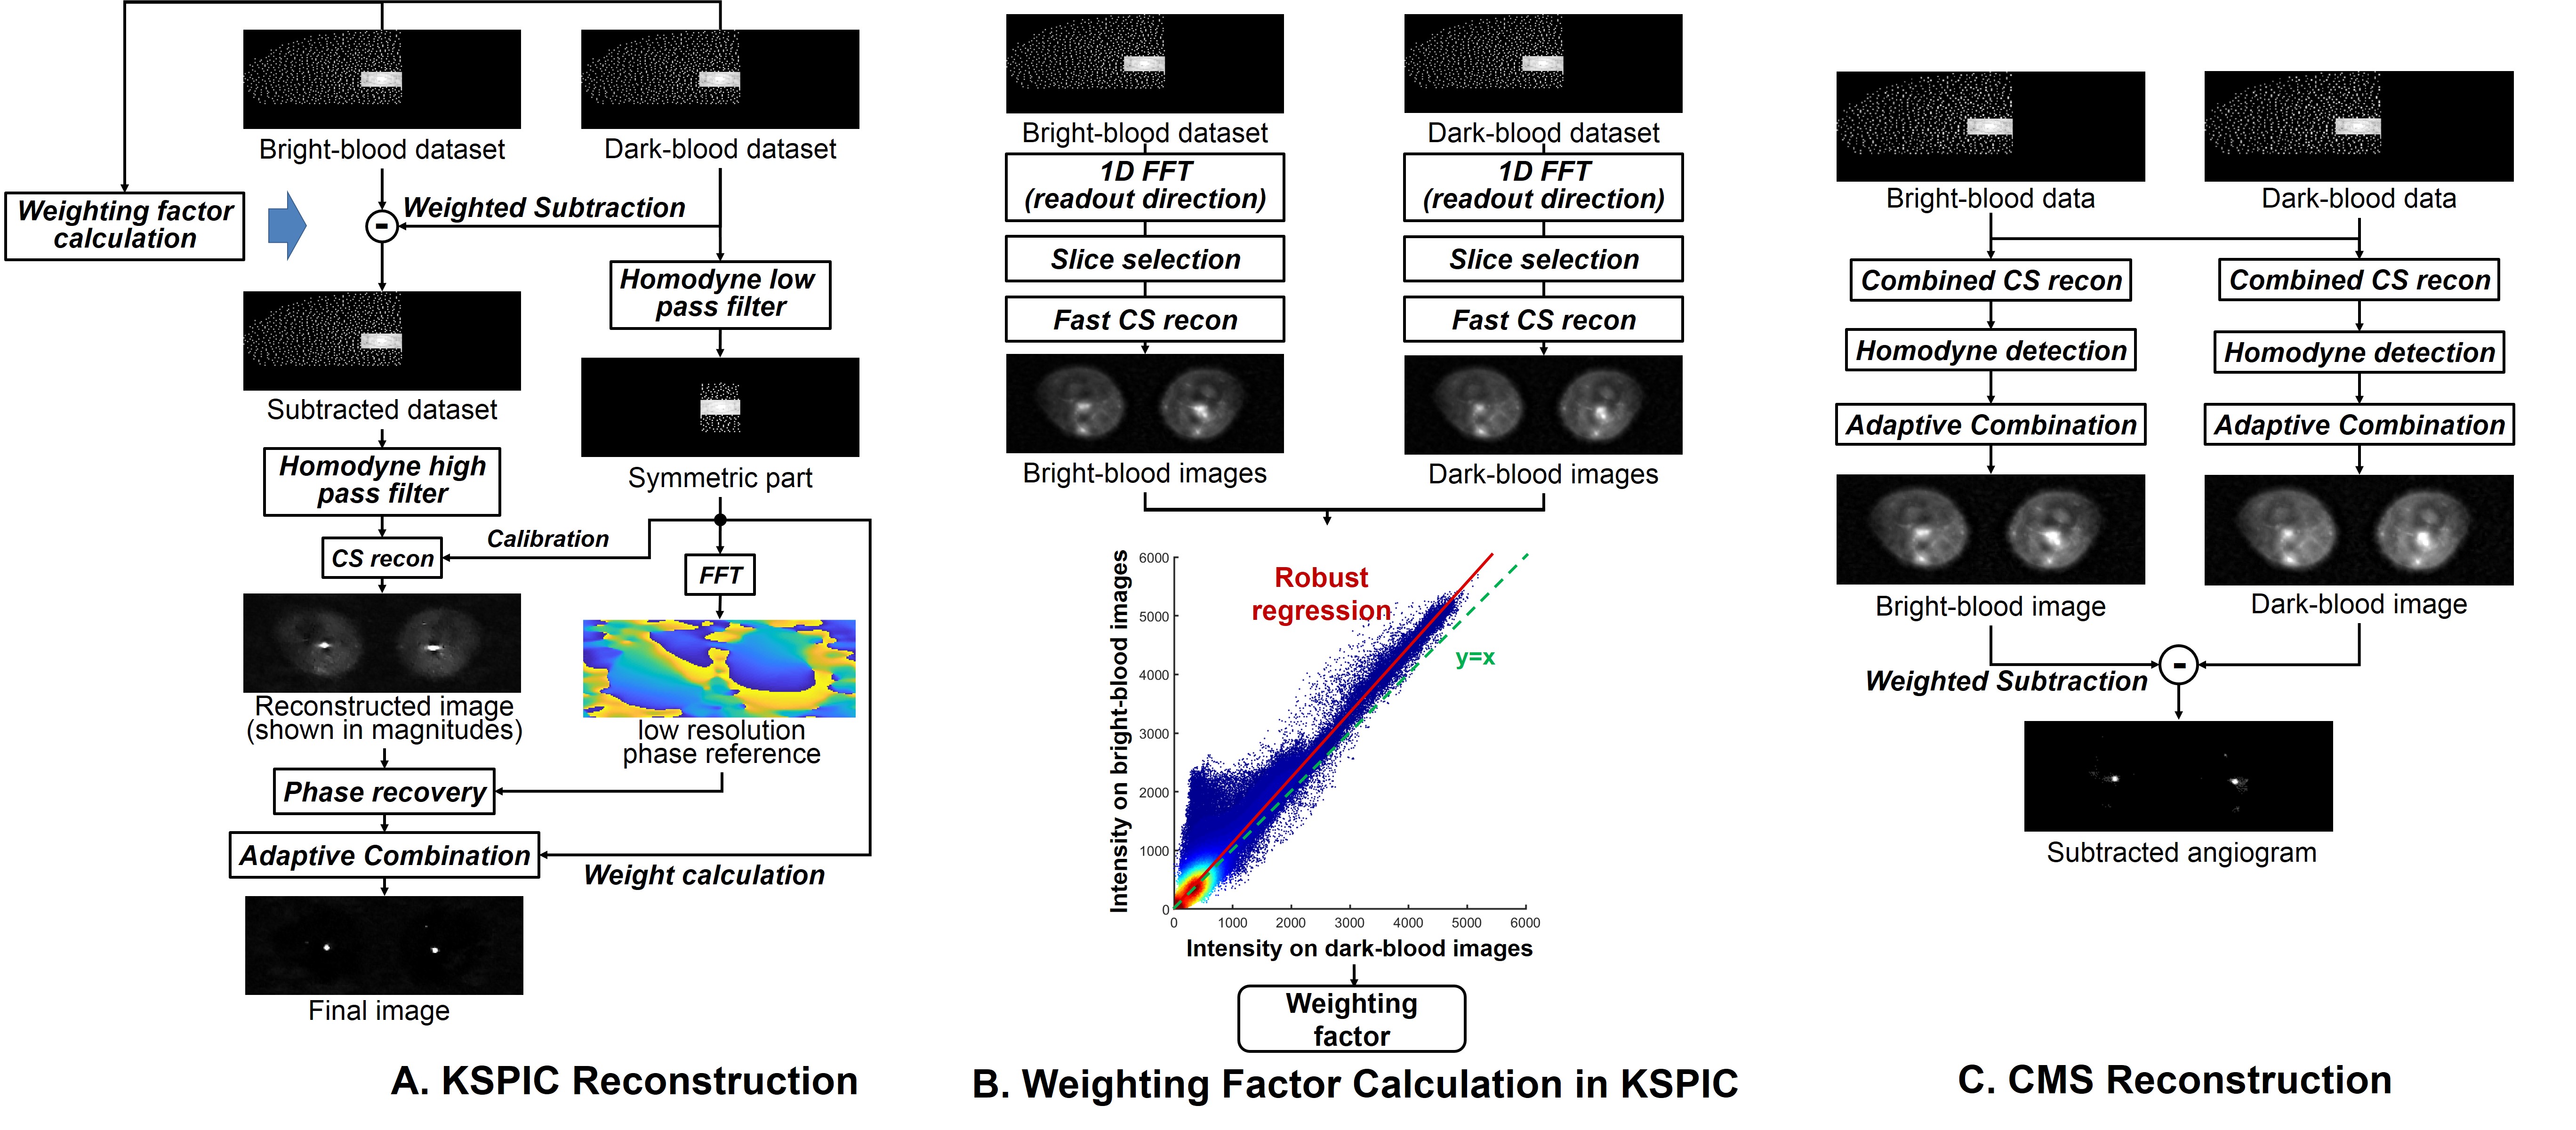
KSPIC is based on the k-space data after weighted subtraction (Fig.1A). A background phase reference is acquired from the symmetric central region of the dark-blood data to recover the polarity of negative values in the subtracted images. The central region is also used for calibration in a SPIRiT reconstruction7 and weight calculation for adaptive combination8 of different channels. PF is applied in both ky and kz directions.The weighting factor in subtraction is calculated by a robust linear regression model6. For KSPIC, regression is performed on partial images reconstructed by a fast CS reconstruction prior to the full reconstruction (Fig.1B), while for CMS, regression is performed on the fully reconstructed images (Fig.1C).
The split-Bregman algorithm9 with total variation minimisation is used for CS reconstruction. Due to its rapid convergence, only one and ten iterations are used for the fast and full CS reconstruction respectively.
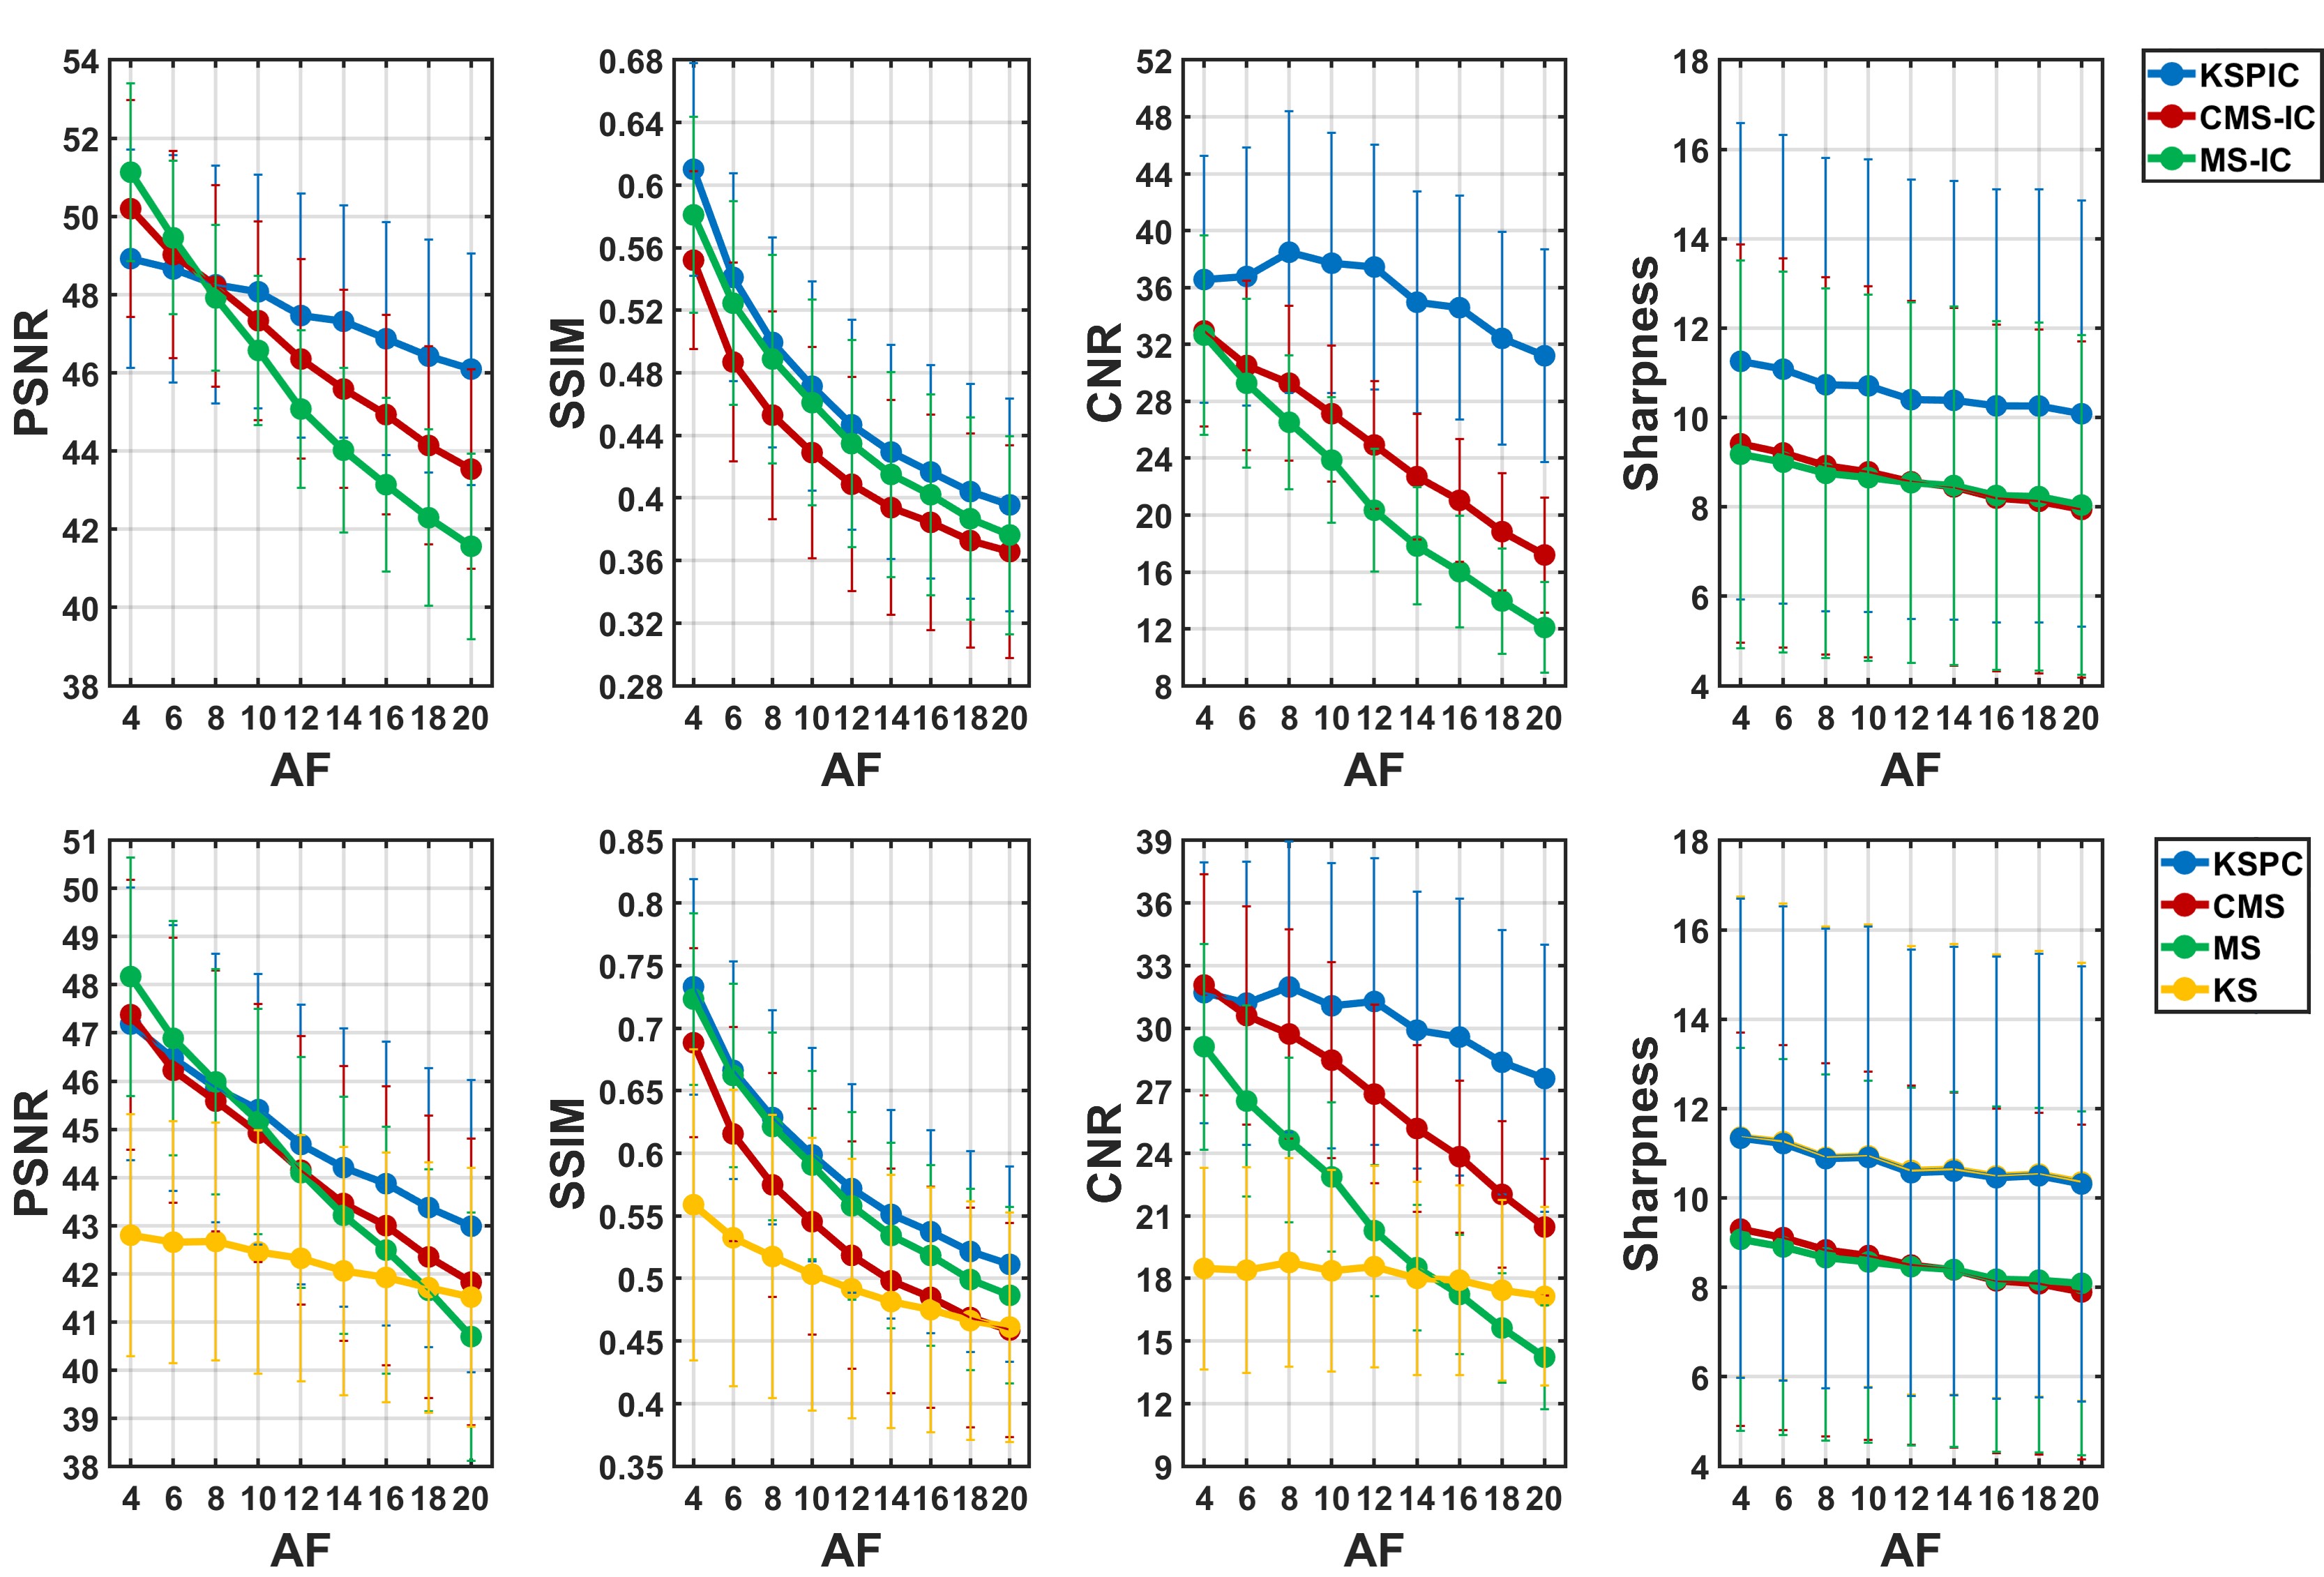
Twelve healthy subjects were imaged using a 1.5 T MR450 system (GE Healthcare, Waukesha, WI). Parameters included ETL 60-90, FOV 40-44 cm, slice thickness 2 mm, TE 45-60ms, TR 2 or 3 heartbeats. For retrospective simulated reconstruction, ten fully sampled femoral FBI datasets (224×224×80, 360 TRs) were acquired and accelerated using acceleration factors (AFs) from 4 to 20. Peak signal-to-noise-ratio (PSNR) and structural similarity index measure (SSIM) were calculated using the fully sampled images as reference7. Contrast-to-noise ratio (CNR) of artery-to-background10 and sharpness evaluation11 were also used as no-reference quality metrics.
Ten volunteers were imaged in the prospective study, each with four datasets accelerated by 10× (84 TRs), 15× (58 TRs), 20× (44 TRs) and 25× (36 TRs) respectively. Images reconstructed by four different methods were assessed by two experienced radiologists, blinded to reconstruction methods and AFs and in a randomised order.
Results and discussion
Fig. 2 shows MIPs of prospective acceleration using KS, MS, CMS-IC and KSPIC. Residual background tissues, such as veins, can be observed on the MS images. CMS-IC has improved background suppression by employing IC, while KSPIC has the best suppression. All the four methods achieved good image quality at 10× acceleration, but image blurring and artefacts appear on MS and CMS-IC at 25× acceleration. KS shows impaired delineation of small branches.Fig. 3 shows the quantitative evaluation of seven different methods in simulated acceleration. KS with phase correction has the best performance in terms of SSIM, CNR and sharpness both with IC (KSPIC) and without IC (KSPC). CMS/CMS-IC and MS/MS-IC have a higher PSNR when the AF is smaller than eight. KS has the worst performance.
Subjective scores are summarised in Fig. 4. KSPIC has the highest score at all AFs in terms of vessel delineation, images noise and artefact, and background and venous contamination. CMS-IC shows improved performance compared with MS, but does not outperform KS in terms of noise, artefact and background suppression.
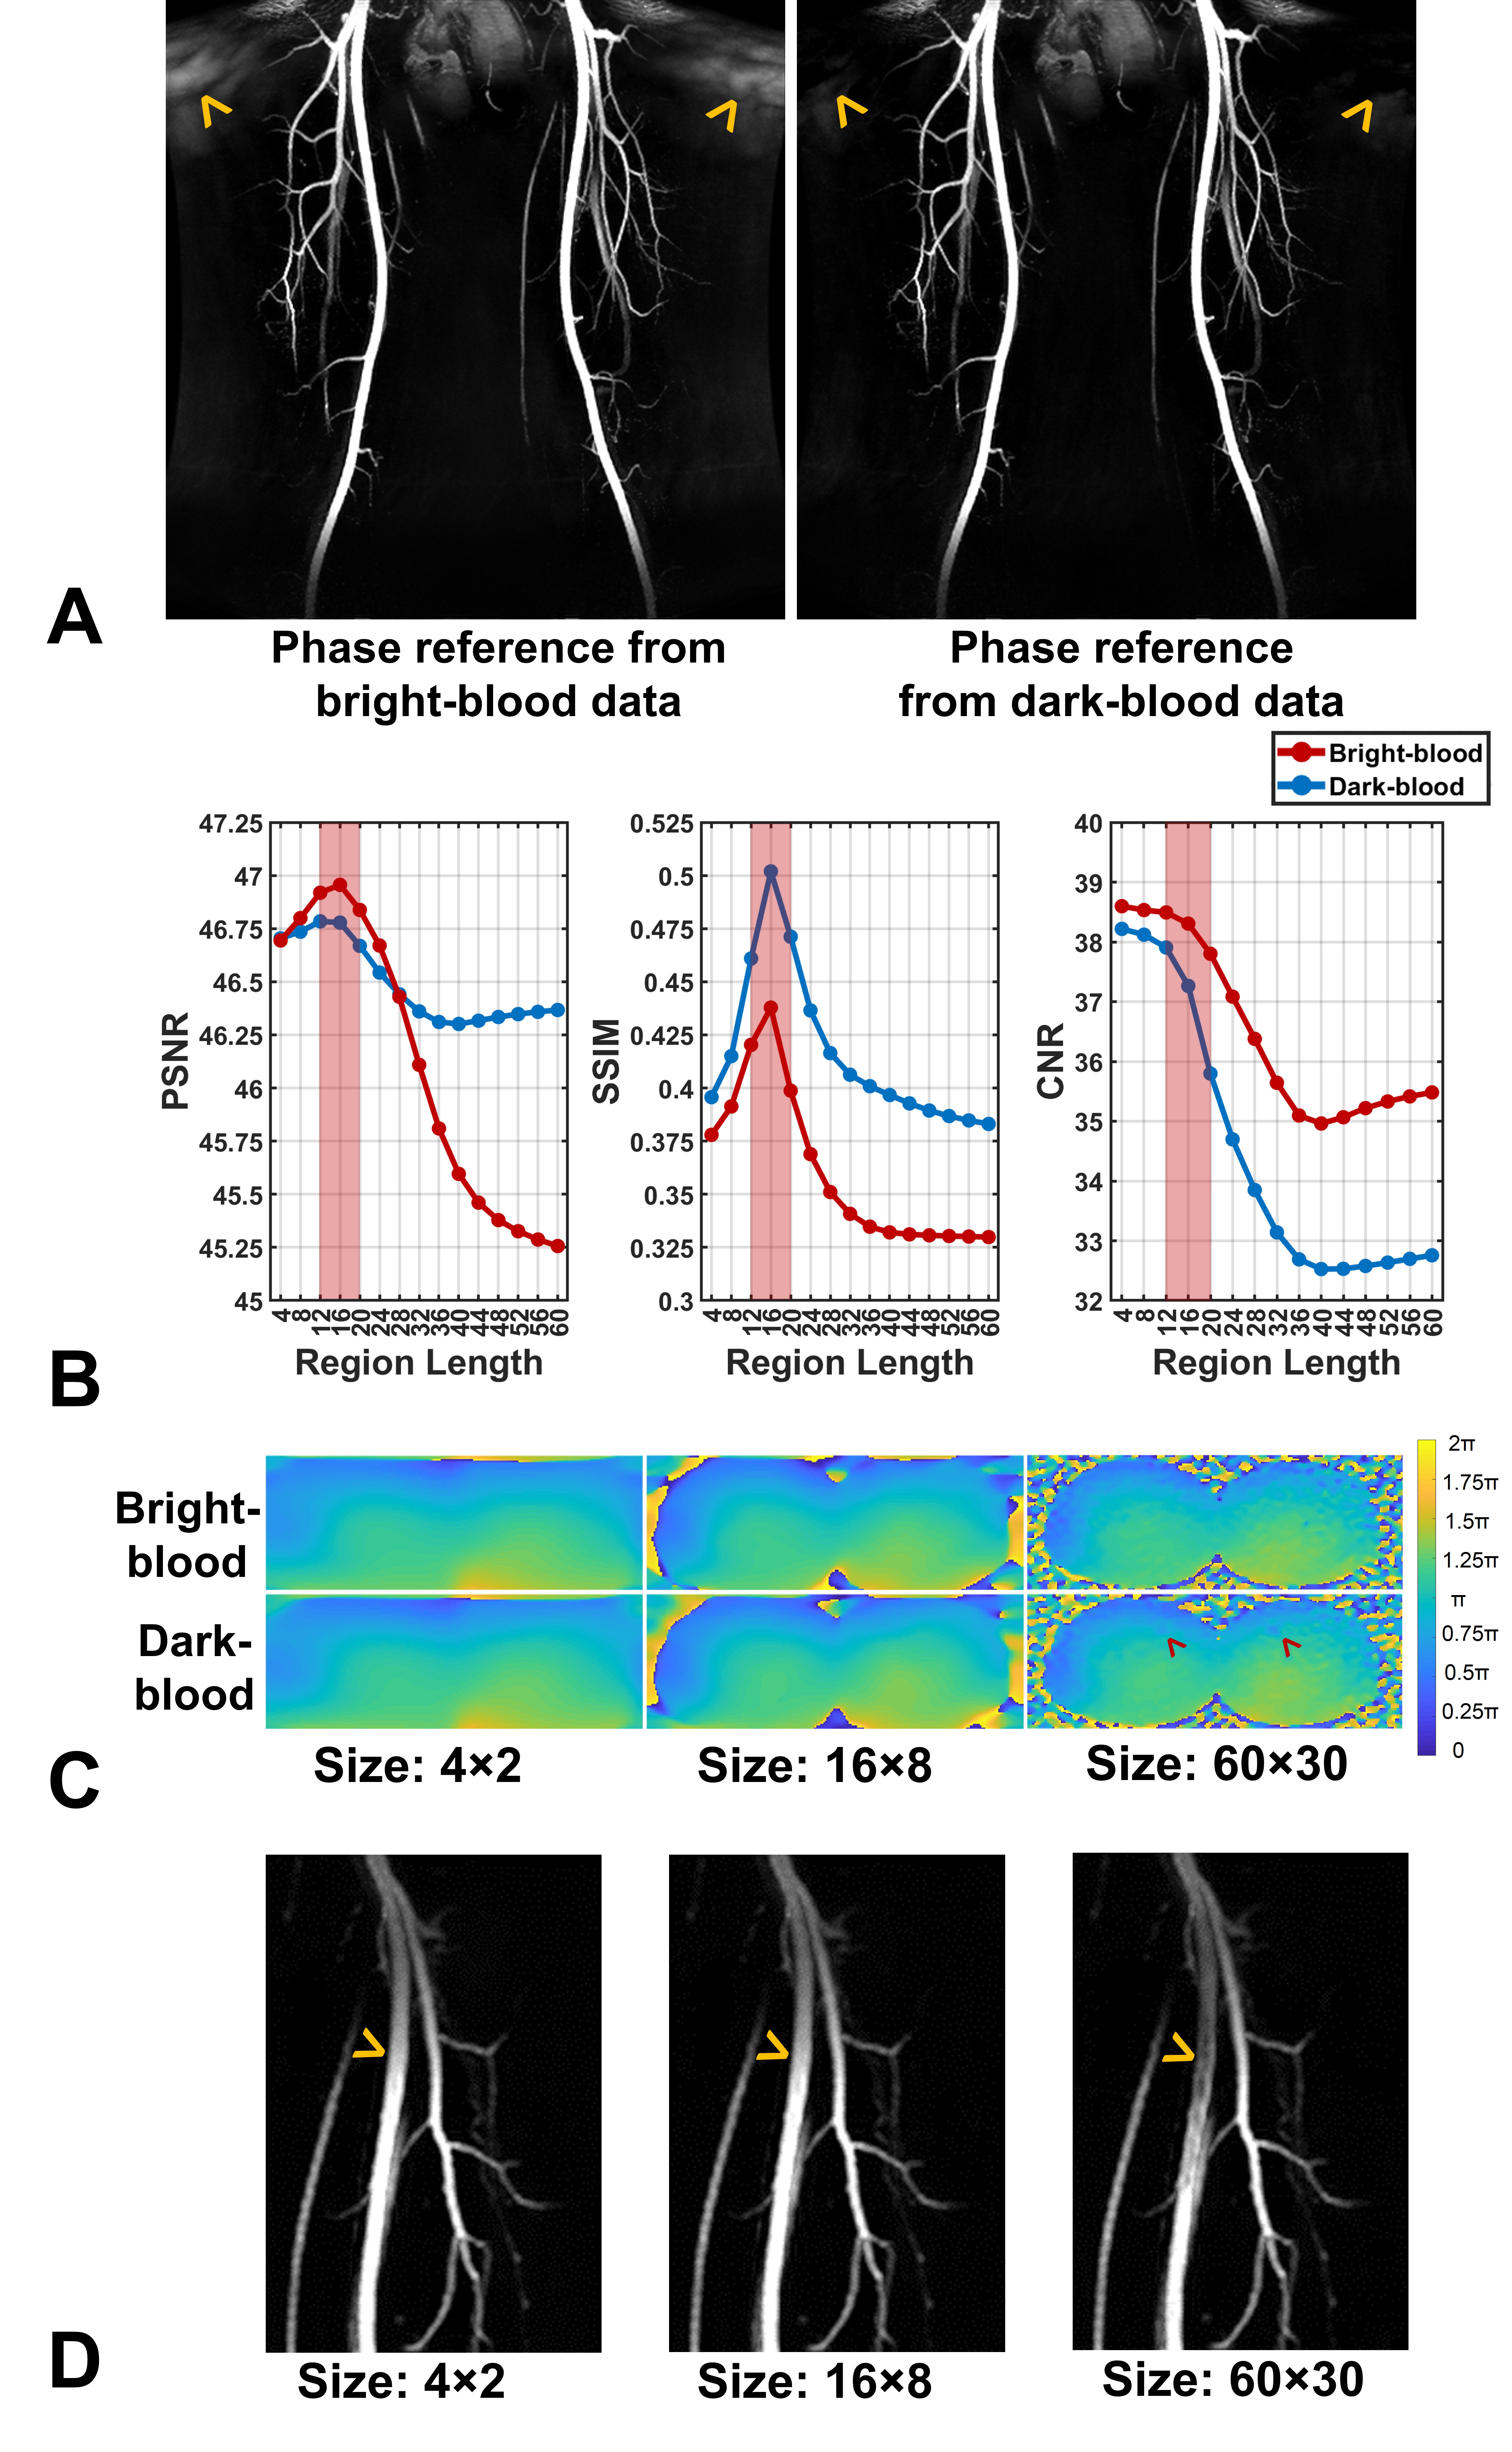
The phase reference correction can be performed based on either bright- or dark-blood data, but in many cases dark-blood data led to reduced artefacts (Fig. 5A). The size of the centre region used for phase correction is also important. In this study, 12-20 was the optimal range of the region length (width=1/2 length) (Fig. 5B). Using a larger size results in arterial phase change in the dark-blood images (systolic acquisition) (Fig. 5C), leading to central signal loss in the arteries (Fig. 5D).
Conclusion
Compared with CMS and conventional MS and KS reconstruction methods, KSPIC has the best reconstruction performance in all the quantitative and qualitative measurements, permitting good image quality to be maintained up to higher AFs. In conjunction with a post-processing IC procedure, CMS can also improve background suppression and vessel delineation.Acknowledgements
The authors acknowledge the support of the Addenbrooke’s Charitable Trust and the NIHR Cambridge Biomedical Research Centre. Hao Li acknowledges the China Scholarship Council and Cambridge Trust for fellowship support.References
1. Miyazaki M, Sugiura S, Tateishi F, Wada H, Kassai Y, Abe H. Non-contrast-enhanced MR angiography using 3D ECG-synchronized half-Fourier fast spin echo. J. Magn. Reson. Imaging 2000;12:776–783.
2. Storey P, Otazo R, Lim RP, Kim S, Fleysher L, Oesingmann N, Lee VS, Sodickson DK. Exploiting sparsity to accelerate noncontrast MR angiography in the context of parallel imaging. Magn. Reson. Med. 2012;67:1391–1400.
3. Rapacchi S, Han F, Natsuaki Y, Kroeker R, Plotnik A, Lehrman E, Sayre J, Laub G, Finn JP, Hu P. High spatial and temporal resolution dynamic contrast-enhanced magnetic resonance angiography using compressed sensing with magnitude image subtraction. Magn. Reson. Med. 2014;71:1771–1783.
4. Li H, Priest AN, Graves MJ, Lomas DJ. Highly accelerated NCE-MRA: Phase correction to remove background artefacts for complex subtraction. In: Proceedings of the 27th Annual Meeting of ISMRM, Montreal, Canada. ; 2019. p. 3534.
5. Li H, Priest AN, Graves MJ, Lomas DJ. Highly Accelerated NCE-MRA Using Complex Subtraction with Intensity Correction: Improved Reconstruction Accuracy and Background Tissue Suppression. In: Proceedings of the 27th Annual Meeting of ISMRM, Montreal, Canada. ; 2019. p. 834.
6. Li H, Shuo W, Priest AN, Graves MJ, Lomas DJ. Background tissue suppression for subtractive NCE-MRA techniques based on robust regression using the deviation angle. In: Proceedings of the 27th Annual Meeting of ISMRM, Montreal, Canada. ; 2019. p. 7231.
7. Lustig M, Pauly JM. SPIRiT: Iterative self-consistent parallel imaging reconstruction from arbitrary k-space. Magn. Reson. Med. 2010;64:457–471.
8. Walsh DO, Gmitro AF, Marcellin MW. Adaptive reconstruction of phased array MR imagery. Magn. Reson. Med. 2000;43:682–690.
9. Goldstein T, Osher S. The Split Bregman Method for L1-Regularized Problems. SIAM J. Imaging Sci. 2009;2:323–343.
10. Horé A, Ziou D. Image quality metrics: PSNR vs. SSIM. In: Proceedings - International Conference on Pattern Recognition. ; 2010. pp. 2366–2369. doi: 10.1109/ICPR.2010.579.
11. Akasaka T, Fujimoto K, Yamamoto T, Okada T, Fushumi Y, Yamamoto A, Tanaka T, Togashi K. Optimization of regularization parameters in compressed sensing of magnetic resonance angiography: Can statistical image metrics mimic radiologists’ perception? PLoS One 2016;11:1–14.
12. Ahmad R, Ding Y, Simonetti OP. Edge sharpness assessment by parametric modeling: Application to magnetic resonance imaging. Concepts Magn. Reson. Part A 2015;44:138–149.
Figures