1317
Rapid Dealiasing of Undersampled, Radial First-Pass Cardiac Perfusion MR Images using 3D Residual U-Net1Department of Radiology, Northwestern University Feinberg School of Medicine, Chicago, IL, United States, 2Department of Biomedical Engineering, Northwestern University, Evanston, IL, United States, 3Department of Medicine (Cardiovascular Division), Beth Israel Deaconess Medical Center & Harvard Medical School, Boston, MA, United States, 4Department of Radiology, University of Colorado Denver, Denver, CO, United States, 5Division of Cardiology, Internal Medicine, Northwestern University Feinberg School of Medicine, Chicago, IL, United States
Synopsis
Compressed sensing (CS) is capable of accelerating cardiac perfusion MRI for achieving high spatial resolution (1.6 mm x 1.6 mm x 8 mm) and extensive spatial coverage (6+ slices per heartbeat), but the lengthy image reconstruction time (~8 min per slice with 64 frames using GPU) hinders its clinical translation. In this study, we sought to, for the first time, rapidly reconstruct accelerated cardiac perfusion data using a 3D residual U-net for clinical translation.
Introduction
Compressed sensing1 can be used to accelerate 2D cardiac perfusion MRI and achieve clinically acceptable image quality with high spatial resolution (1.6mm x 1.6mm x 8mm) and extensive myocardial coverage (6-8 2D slices per heartbeat), as previously described2. While CS is a promising method from an imaging perspective, its relatively lengthy image reconstruction (e.g. ~8min per slice with 64 frames using GPU) hinders its clinical translation. In this study, we sought to implement an image reconstruction pipeline including a 3D residual U-Net and test whether it is capable of reconstructing undersampled, non-Cartesian 2D cardiac perfusion k-space data at least 10 times faster than GPU-accelerated CS reconstruction, without significant loss in data fidelity or image quality.Methods
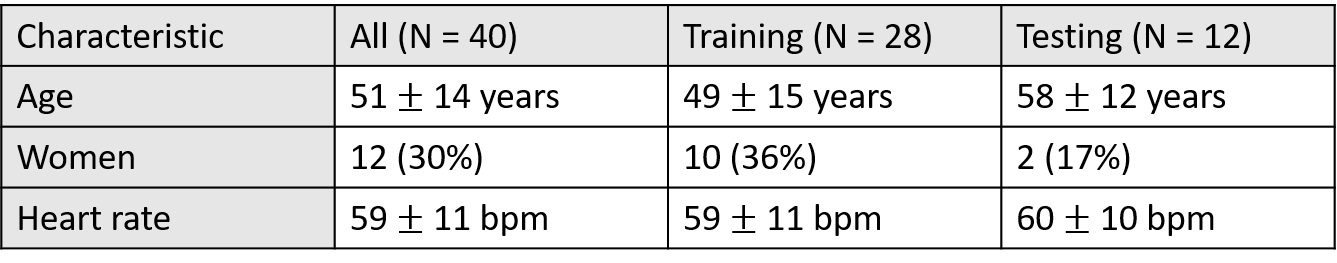
Human Subjects & Pulse Sequence: We prospectively enrolled 27 patients and combined the results together with existing raw data of 13 patients (in total 28 men and 12 women, mean age = 51 ± 14 years, see Table1 for details). Relevant image parameters included: field of view (FOV) = 300 mm x 300 mm, acquisition matrix = 192 x 192, spatial resolution = 1.6 mm x 1.6 mm, slice thickness =8 mm, TE/TR =1.5/2.6 ms, flip angle = 12°, receiver bandwidth =700 Hz/pixel, 30 rays per frame with the 7th Fibonacci sequence of golden angles (=23.628°)3, single-shot readout duration per frame = 78 ms, 75 repetitions, electrocardiogram triggering every heartbeat, and 6-8 slices per heartbeat, depending on heart rate. For more details on the pulse sequence, please see reference2.Image reconstruction: Our proposed image reconstruction pipeline includes three sequential steps: In step 1 (pre-processing), GPU-accelerated NUFFT4 was used to grid the radial k-space data onto the Cartesian space and SENSE5 was used to combine multi-coil zero-filled images, where coil sensitivities were self-calibrated by processing the time average image, as previously described6. In step 2 (dealiasing), the trained U-Net was used to dealiase coil-combined, zero-filled image. In step 3, residual aliasing artifacts were filtered using block-wise low rank (BWLR) with a single iteration with image block size = 8 x 8 and normalization threshold value = 10% of the absolute maximum value.
U-Net training and testing: We implemented a 3D residual U-net architecture (Figure 1) on a GPU workstation (P100 Tesla 12 GB memory, NVIDIA; Xeon E5-2650 v4 128 GB memory, Intel); GPU-accelerated CS reconstruction was performed on the same hardware. The detail of our 3D U-Net architecture included: 3 hidden layers, 16 channels, 3x3x3 (x-y-time) convolutional kernels size, and 2x2x2 max-pooling size. For training, we used 132 2D+time datasets with 64 frames per slice (or 8448 2D images in total) from 28 randomly selected patients, where the coil-combined, zero-filled images were used as input and the corresponding CS reconstructed images without BWLR filtering were used as output. For testing, we used 56 2D+time datasets with 64 frames per slice (i.e. 3584 2D images in total) from 12 remaining patients as input to our trained U-Net.
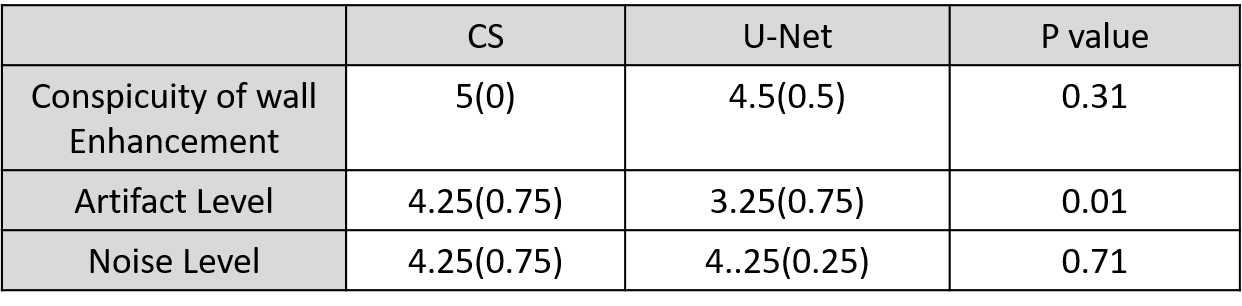
Image quality analysis: Images were graded using quantitative metrics of image quality (SSIM, NRMSE, and edge sharpness assessment). Two clinical readers independently graded the following 3 categories on a 5-point (1: worst, 3: clinically acceptable, 5: best) Likert scale: conspicuity of wall enhancement, noise, and artifact. For statistical analysis, we used the two-tailed, paired t-test for quantitative metrics, and the Wicoxon signed rank test for visual scores, where p < 0.05 was considered significant.
Results
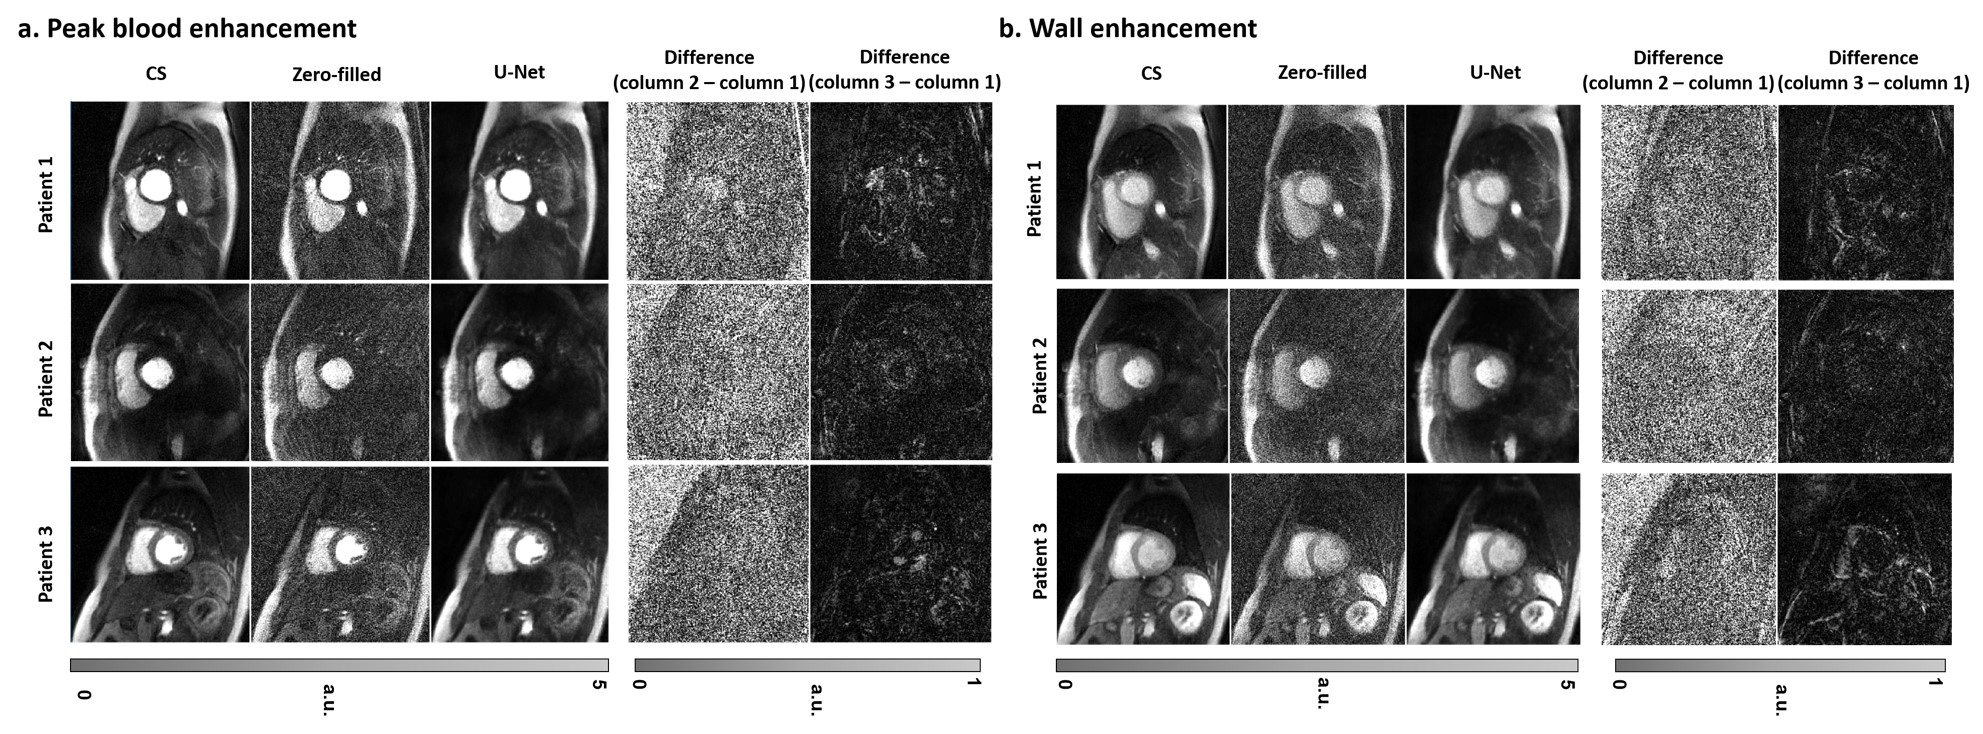
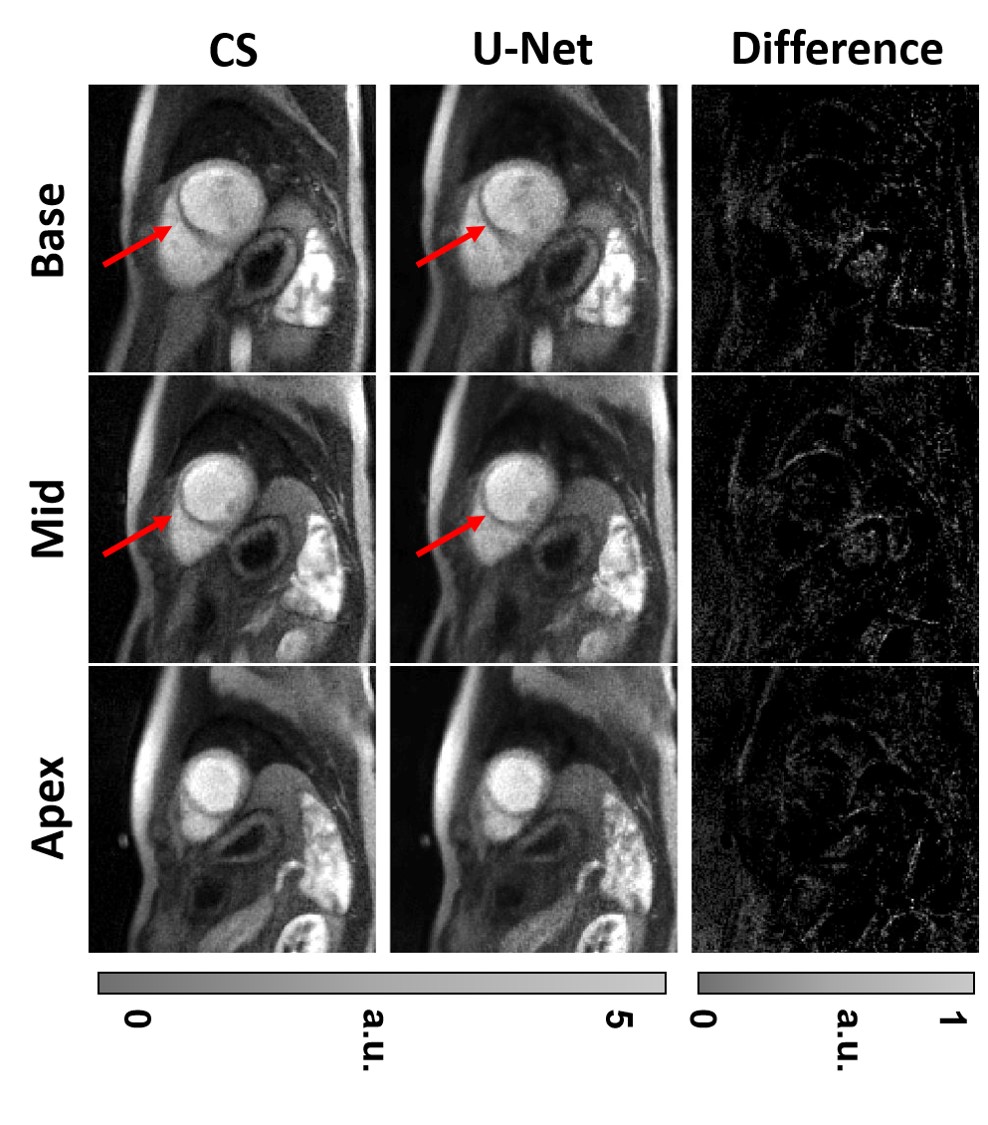
The mean processing time per slice with 64 frames along the proposed pipeline was 30.8 ± 1.4 s for pre-processing (step 1), 0.7 ± 0.1 s for dealiasing (step 2), and 0.6 ± 0.1 s for post-processing (step 3). The mean processing time per slice with 64 frames along the GPU-accelerated CS pipeline was 30.8 ± 1.4 s for pre-processing (step 1), 429.2 ± 16.4 s for dealiasing (step 2), and 1.3 ± 0.1 s for post-processing (step 3). Including all three steps, the mean reconstruction time per slice was on average was 14.4 times shorter for U-Net (32.1 ± 1.4 s) than CS (461.3 ± 16.9 s)(p<0.001). Excluding the pre- and post-processing steps, the mean dealiasing time per slice was on average was 613.1 times shorter for U-Net (0.7 ± 0.1 s) than CS (429.2 ± 16.4 s)(p<0.001). Figure 2 shows representative images of three different patients reconstructed with zero-filling, CS, and U-Net, as well as difference images with respect to CS. Figure 3 shows 3 short-axis images of a patient with a perfusion defect in the septal wall reconstructed with CS and U-Net, as well as difference images with respect to CS. Compared with CS, our proposed method maintained high data fidelity (structural similarity index =0.914±0.023, normalized root mean square error=1.7±0.3%, identical mean edge sharpness of 1.2 mm). As summarized in Table 2, the median conspicuity and noise scores were not significantly different, whereas the artifact score was significantly different. Nonetheless, all scores were above the clinically acceptable (3.0) cut point.Conclusion
This study demonstrates a reconstruction pipeline including a U-Net that is capable of reconstructing 6.4-fold accelerated, non-Cartesian cardiac perfusion k-space data 14.4 times faster than CS, without significant loss in data fidelity (SSIM>0.90, NRMSE<5%) or image quality.Acknowledgements
This work is supported by National Institutes of Health (R01HL116895, R01HL138578, R21EB024315, R21AG055954) and the American Heart Association (19IPLOI34760317).References
1. Lustig M, Donoho D, Pauly JM. Sparse MRI: The application of compressed sensing for rapid MR imaging. Magn Reson Med 2007;58(6):1182-1195.
2. Naresh NK, Haji-Valizadeh H, Aouad PJ, Barrett MJ, Chow K, Ragin AB, Collins JD, Carr JC, Lee DC, Kim D. Accelerated, first-pass cardiac perfusion pulse sequence with radial k-space sampling, compressed sensing, and k-space weighted image contrast reconstruction tailored for visual analysis and quantification of myocardial blood flow. Magn Reson Med 2019;81(4):2632-2643.
3. Wundrak S, Paul J, Ulrici J, Hell E, Geibel MA, Bernhardt P, Rottbauer W, Rasche V. Golden ratio sparse MRI using tiny golden angles. Magn Reson Med 2016;75(6):2372-2378.
4. Knoll F, Schwarzl A, Diwoky C, Sodickson DK. gpuNUFFT-an open source GPU library for 3D regridding with direct Matlab interface. In: Proceedings of the 22rd Annual Meeting of ISMRM, Melbourne, Australia 2014. Abstract No. 4297.
5. Pruessmann KP, Weiger M, Scheidegger MB, Boesiger P. SENSE: sensitivity encoding for fast MRI. Magn Reson Med 1999;42(5):952-962.
6. Walsh DO, Gmitro AF, Marcellin MW. Adaptive reconstruction of phased array MR imagery. Magn Reson Med 2000;43(5):682-690.
Figures