1316
Analysis of Location-dependent Errors of Myocardial Blood Flow (MBF) Estimates using Computational Fluid Dynamics (CFD)-Simulations1Chair of Cellular and Molecular Imaging, Comprehensive Heart Failure Center (CHFC), University Hospital Würzburg, Würzburg, Germany, 2Dept. of Biomedial Engineering & Physics - Translational Physiology, Amsterdam UMC, University of Amsterdam, Amsterdam Cardiovascular Sciences, Amsterdam, Netherlands, 3Dept. of Clinical Chemistry and Hematology, Diakenessenhuis, Utrecht, Netherlands
Synopsis
To analyze systematic errors and regional variability of the myocardial blood flow (∆MBF) and myocardial perfusion reserve (∆MPR) estimates in dynamic contrast-enhanced perfusion MRI, computational fluid dynamic (CFD)-simulations were performed in a realistic 3D coronary vasculature model of an ex-vivo porcine heart. Simulations were performed down to the pre-arteriolar level for the myocardial segments. The simulations show a strong spatial variance in the resulting ∆MBF and ∆MPR values of up to 60%. The errors are increasing with distance from the model inlet as well as with lower flow velocities. Errors are more pronounced in the right coronary artery.
INTRODUCTION
In dynamic contrast-enhanced perfusion MRI the passage of an intravenously injected contrast agent (CA) bolus through the tissue is observed to evaluate and quantify myocardial blood flow (MBF) and myocardial perfusion reserve (MPR = MBFStress/MBFRest). Therefore, knowledge of the shape of the CA inflow, presented as the arterial input function (AIF) through the upstream vessels is required. Because of technical limitations, measurement of the AIF cannot be performed in the supplying vessels near the myocardial region of interest but is generally measured upstream in the left ventricle1. This introduces the risk of systematic errors in quantification (∆MBF) due to bolus dispersion during passage of the coronary vessels2,3. This influence has been addressed before in several studies using computational fluid dynamics (CFD)‑simulations indicating a systematic underestimation of MBF4-6. In this project, CFD-simulations of CA transport through a realistic porcine coronary vasculature down to the pre‑arteriolar level in rest as well as stressed condition were performed to analyze regional variability in ∆MBF and ∆MPR.METHODS
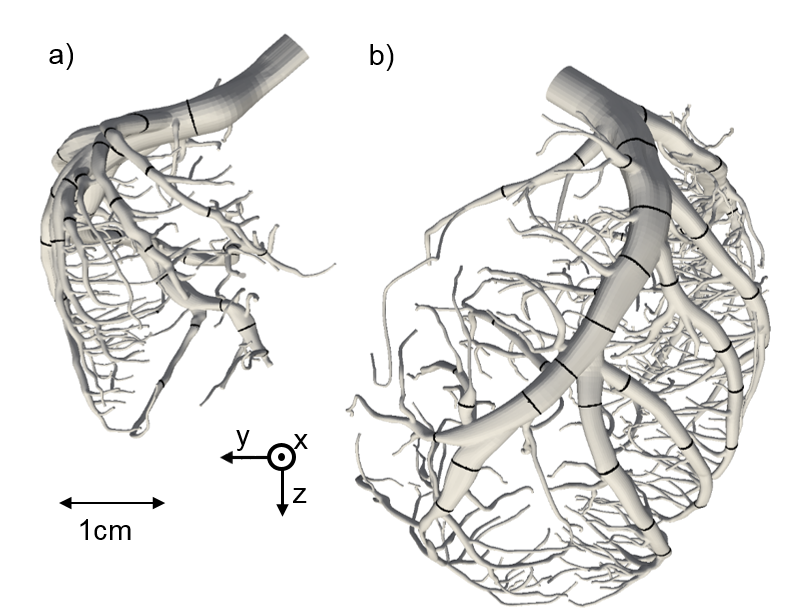
With dedicated software (SimVascular, VMTK), highly detailed and realistic 3D-models of the left and right coronary artery (LCA, RCA) with 364 (LCA) and 104 (RCA) outlets with an average diameter of 383 ± 85 µm were extracted from an imaging cryomicrotome dataset of an ex-vivo porcine heart (Fig.1). For the meshing process the semiautomatic software cfMesh was used creating computational grids of predominantly hexahedral type. Subsequent CFD‑simulations were performed with OpenFOAM v.1812 on a HPC-Linux-Cluster with a parallelization to 140 processors and a computing time of roughly 5 days. The simulations were performed in a two-step procedure. First, the Navier-Stokes equations for blood-flow were solved and stored for one cardiac circle. To best reflect the physiological behavior of the coronary blood flow, an adapted boundary condition was used, which utilizes an analogy of the cardiac and electric circuit first proposed by Westerhof et al7,8. With respect to rheologic turbulences the Smagorinsky turbulence model was implemented in the solver9. In a second step, the transport of the CA is computed by repeatedly reading in the previously calculated data and solving the advection-diffusion equation. As start condition, a gamma variate function was used to represent the CA bolus. By applying the Multiple path, Multiple tracer, Indicator Dilution, 4 region model (MMID410) the generated outlet CA time curves were used to estimate ∆MBF for rest and stress conditions as well as the estimation of ∆MPR. To analyze regional differences the model outlets were assigned to specific myocardial segments11. The segmental averages were then compared with regard to the distance to the inlet calculated by VMTK.RESULTS AND DISCUSSION
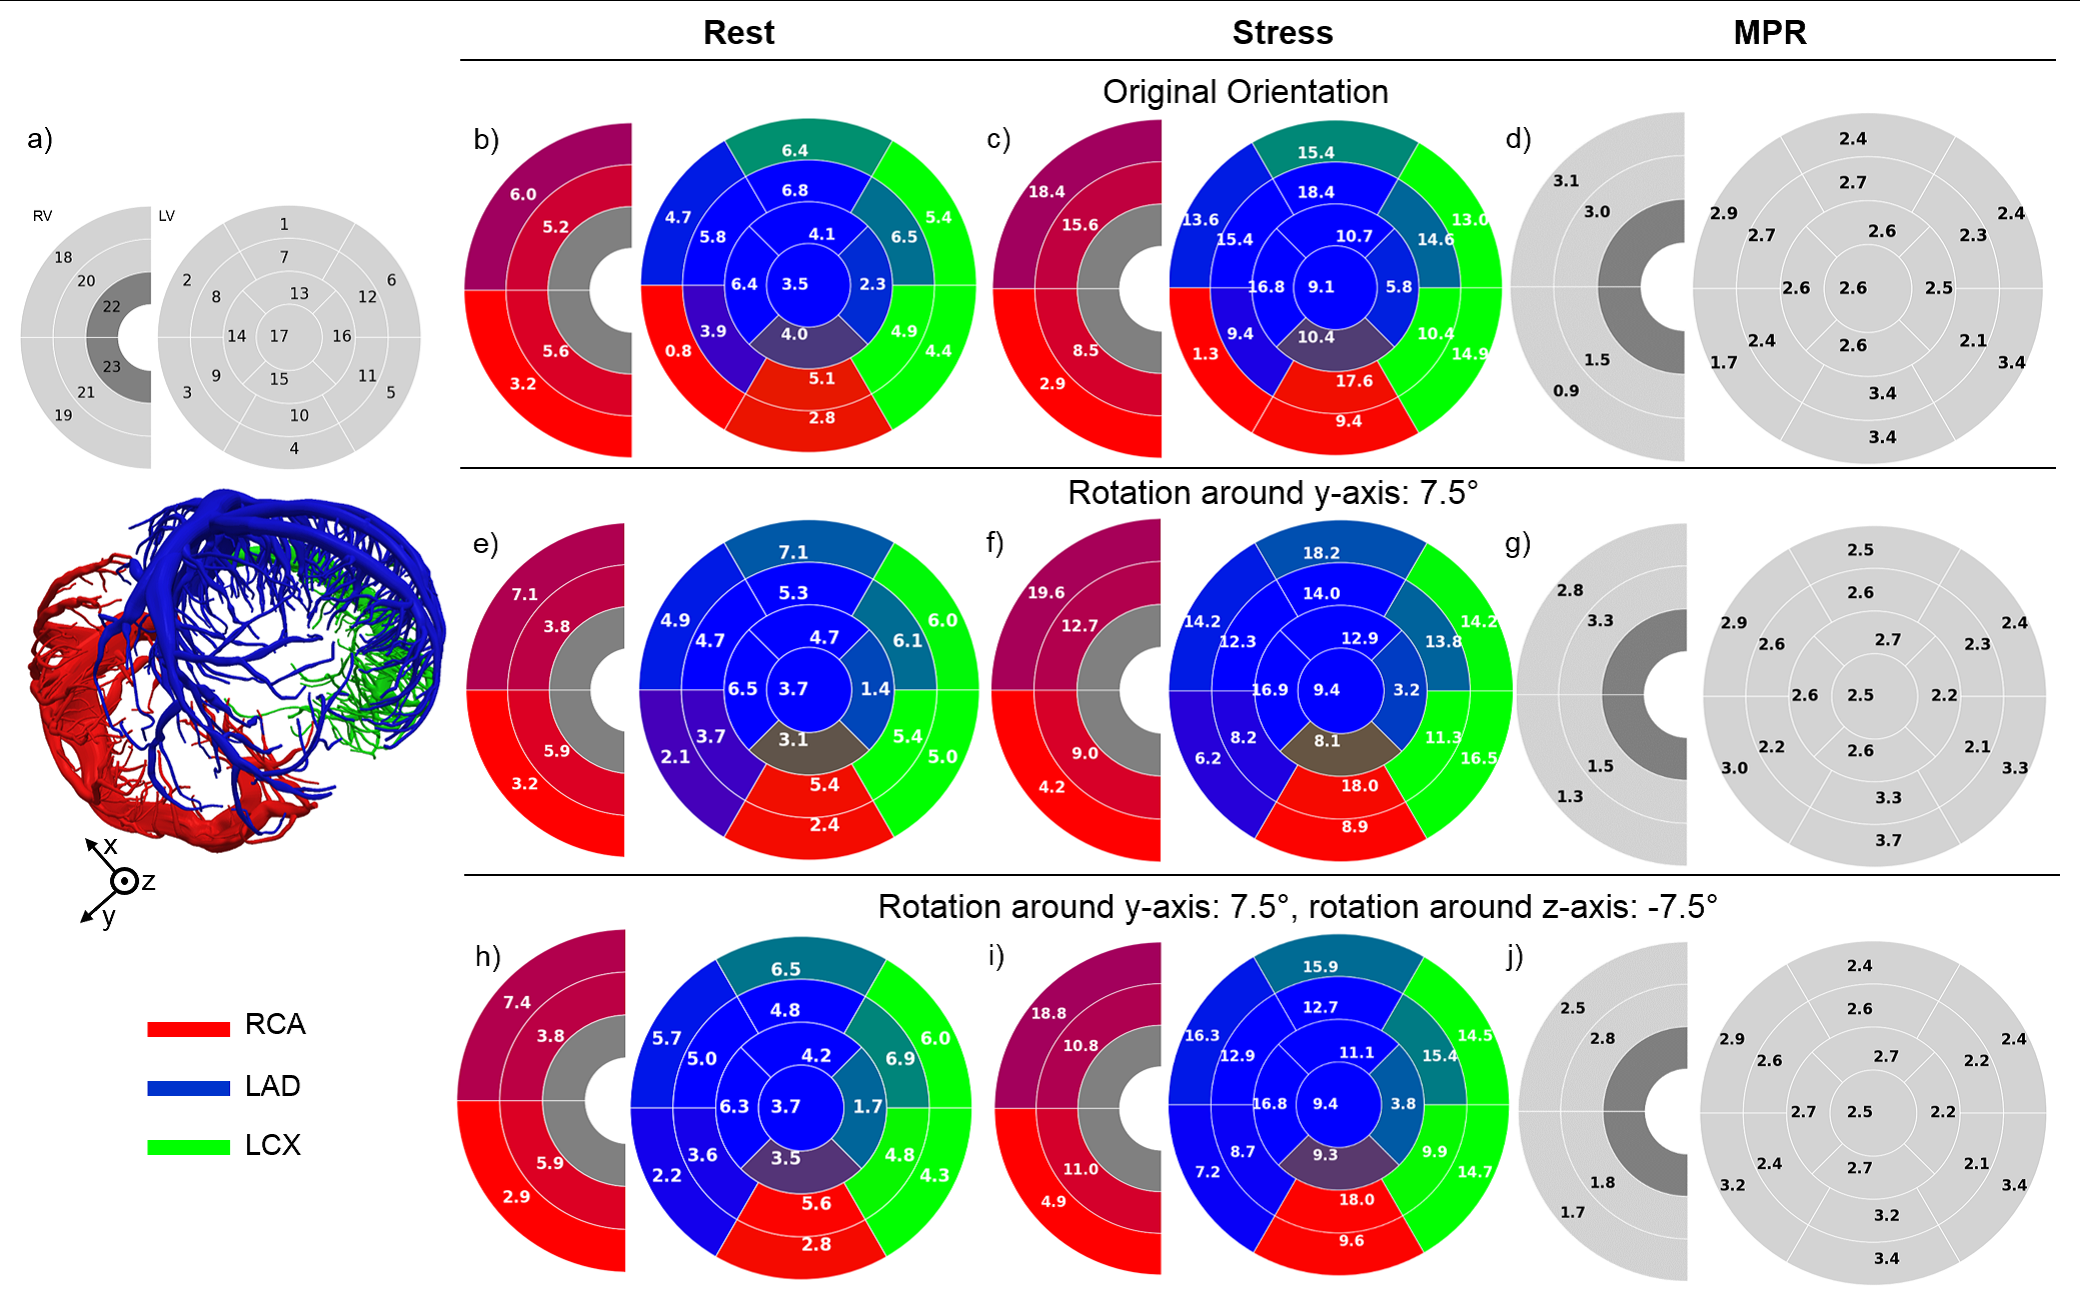
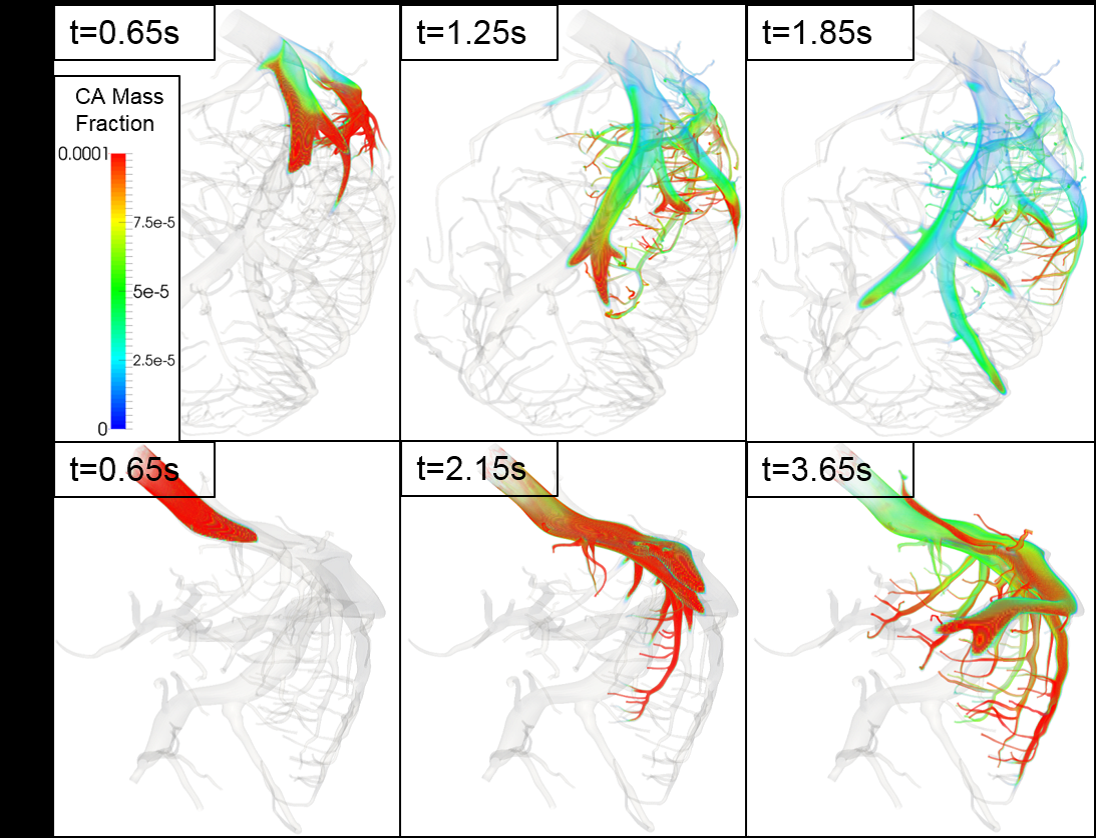
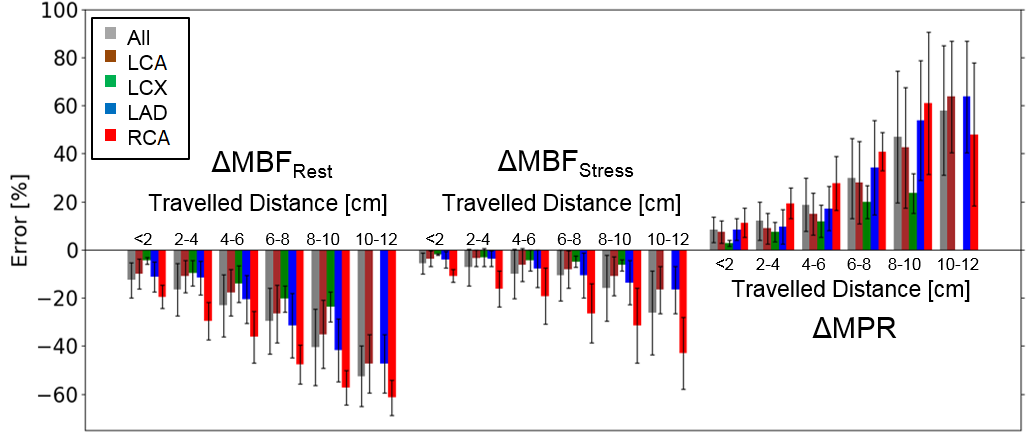
Fig. 2 shows the volume blood flow (VBF) for each myocardial segment in rest and stress conditions in three different orientations. To achieve physiologically realistic values, the whole model was rotated by 7.5° around the y-axis and by -7.5° around the z-axis. This rotation has an enormous impact on the resulting segmental VBF. Strong heterogeneity in the VBF along the segments are visible. A clear difference between the VBF in segments supplied by the LCA and RCA is visible. Not only is the VBF in the segments supplied by the RCA smaller but also is the contribution of the RCA to the perfusion of the left ventricle with only 2 segments surprisingly small due to the lower flow velocities in this artery (Fig. 3). However, even in segments supplied by the same artery, a strong regional variation in the resulting VBF is shown. This is the case for resting as well as stressed state. In general, the distribution of the VBF agrees with literature according to MBF measurements in pigs12,13. Fig. 4 shows the computed errors ∆MBF for rest and stress conditions as well as ∆MPR in dependence of the travelled distances for the different arteries. With increasing distance to the inlet, a clear tendency to higher errors due to bolus dispersion in the vessels is visible for stress as well as rest conditions. This leads to a systematic underestimation of the MBF and overestimation of the MPR up to 60%, respectively. The errors are generally higher in resting state and in the vessels of the RCA, which indicates higher CA‑dispersion effects with lower flow velocities.CONCLUSION
The analysis indicates systematic bolus-dispersion-induced underestimation of the MBF and an overestimation of MPR of up to 60% in contrast-enhanced MRI perfusion measurements. This systematic error appears to demonstrate spatial variance. ∆MBF is increasing with distance from the coronary artery inlet at the aorta as well as more pronounced in myocardial segments supplied by the RCA. Future work needs to address the influence of interindividual variations of the geometry of the coronary tree on the amount of systematic error. Moreover, a future validation study in-vivo will be performed. Currently, individual predictions of errors of estimation MBF are not feasible due to the time-consuming simulations. This, however, does not diminish the relevance of these effects in the understanding of clinical quantitative myocardial perfusion MRI.Acknowledgements
This project is funded by the German Ministry of Education and Research (BMBF) with grant # 01EO1004 & 01EO1504. We acknowledge the Leibniz Rechenzentrum Munich (LRZ) for access to Linux-Cluster CoolMUC-2.References
1. A.R. Patel, Assessment of advance coronary artery disease: Advantages of quantitative cardiac magnetic resonance perfusion analysis. J. Am. Coll. Cardiol, 56(7):561-569, 2010.
2. F. Calamante, Arterial input function in perfusion MRI: a comprehensive review. Prog Nucl Magn Reson Spectrosc, 74:1-32, 2013.
3. M. Schmitt et al., Quantification of myocardial blood flow and blood flow reserve in the presence of arterial dispersion: a simulation study, Magnetic Resonance in Medicine, 47(4):787-793, 2002.
4. D. Graafen et al., Quantitative myocardial perfusion magnetic resonance imaging: the impact of pulsatile flow on contrast agent bolus dispersion, Physics in Medicine and Biology, 56:5167-5185, 2011.
5. R. Schmidt et al., Computational Fluid Dynamics Simulations of Contrast Agent Bolus Dispersion in Coronary Bifurcation: Impact on MRI-Based Quantifications of Myocardial Perfusion, Computational and Mathematical Methods in Medicine, 2013.
6. K. Sommer et al., Resting myocardial blood flow quantification using contrast-enhanced magnetic resonance imaging in the presence of stenosis: A computational fluid dynamics study, Medical Physics, 42(7):4375-4384, 2015.
7. N. Westerhof et al., Analog studies of the human systemic arterial tree, Journal of Biomechanics, 2(2):121-143, 1969.
8. H.J. Kim et al., Patient-specific modeling of blood flow and pressure in human coronary arteries, Ann Biomed Eng, 38(10):3195-2019, 2010.
9. M. Lesieur et al., Large-Eddy Simulations of Turbulence, Cambridge University Press, New York, 2005. ISBN 978-0521781244.
10. MMID4 Manual, National Simulation Resource for Mass Transport and Exchange, Department of Bioengineering, University of Washington, 1998.
11. M.D. Cerqueira et al., Standardized Myocardial Segmentation and Nomenclature for Tomographic Imaging of the Heart, Circulation, 105:539-542, 2002.
12. A. Rossi et al., Quantification of myocardial blood flow by adenosine-stress CT perfusion imaging in pigs during various degrees of stenosis correlates well with coronary artery blood flow and fractional flow reserve, Eur Heart J Cardiovasc Imaging, 14(4):331-8, 2013.
13. R. Fahmi et al., Quantitative myocardial perfusion imaging in a porcine ischemia model using a prototype spectral detector CT system.
Figures