1311
Investigation of the dynamic fingerprint of the BOLD fMRI signal based on a novel statistical 3D cortical vascular network of the human brain1Department of Radiology, Center for Image Sciences, UMC Utrecht, Utrecht, Netherlands, 2Spinoza Centre for Neuroimaging Amsterdam, Royal Netherlands Academy of Arts and Sciences, Amsterdam, Netherlands
Synopsis
In order to quantify the hemodynamic contributions to the BOLD fMRI signal in humans, it is necessary to adopt a computational model that resembles the cortical vasculature and mimics hemodynamic changes triggered by neurovascular coupling. Moreover, simulation of the local magnetic disturbance induced by the geometry, hemodynamic changes, and the biophysical properties of the tissues can provide accurate insights on the physiological fingerprint of the BOLD fMRI signal. In this work, based on a realistic 3D computational approach of the human cortical vasculature, we simulate the biophysical effects produced by hemodynamic changes to compute a dynamic BOLD fMRI signal response.
INTRODUCTION
Blood oxygenation level-dependent functional magnetic resonance imaging (BOLD fMRI) is a powerful noninvasive tool to study in-vivo brain function. However, the BOLD fMRI signal is only an indirect measurement of brain function that results from the hemodynamic fluctuations triggered by neurovascular coupling and the biophysical properties of the tissues1. In order to investigate the BOLD fMRI signal formation, computational modeling gives a comprehensive perspective on the relation between the brain’s vasculature and associated hemodynamics. Furthermore, computational approaches can provide fundamental insights on the complexity of the biophysical interactions at mesoscopic level2. Numerical simulations of the BOLD fMRI signal based on non-realistic representations of the vasculature3, such as spheres or cylinders, and on realistic 3D vascular models4,5, obtained from the parietal cortex of mice with two-photon microscopy, have so far only described some static properties of the BOLD signal dependent on specific parameters of blood and tissue in active/resting states. Here, using a realistic 3D computational model of the human vascular network, we have performed numerical simulations to investigate the effect of the biophysical interaction produced by realistic hemodynamic changes and the properties of the tissues and, therefore, the impact of these changes on the time-course of the BOLD fMRI signal.METHODS
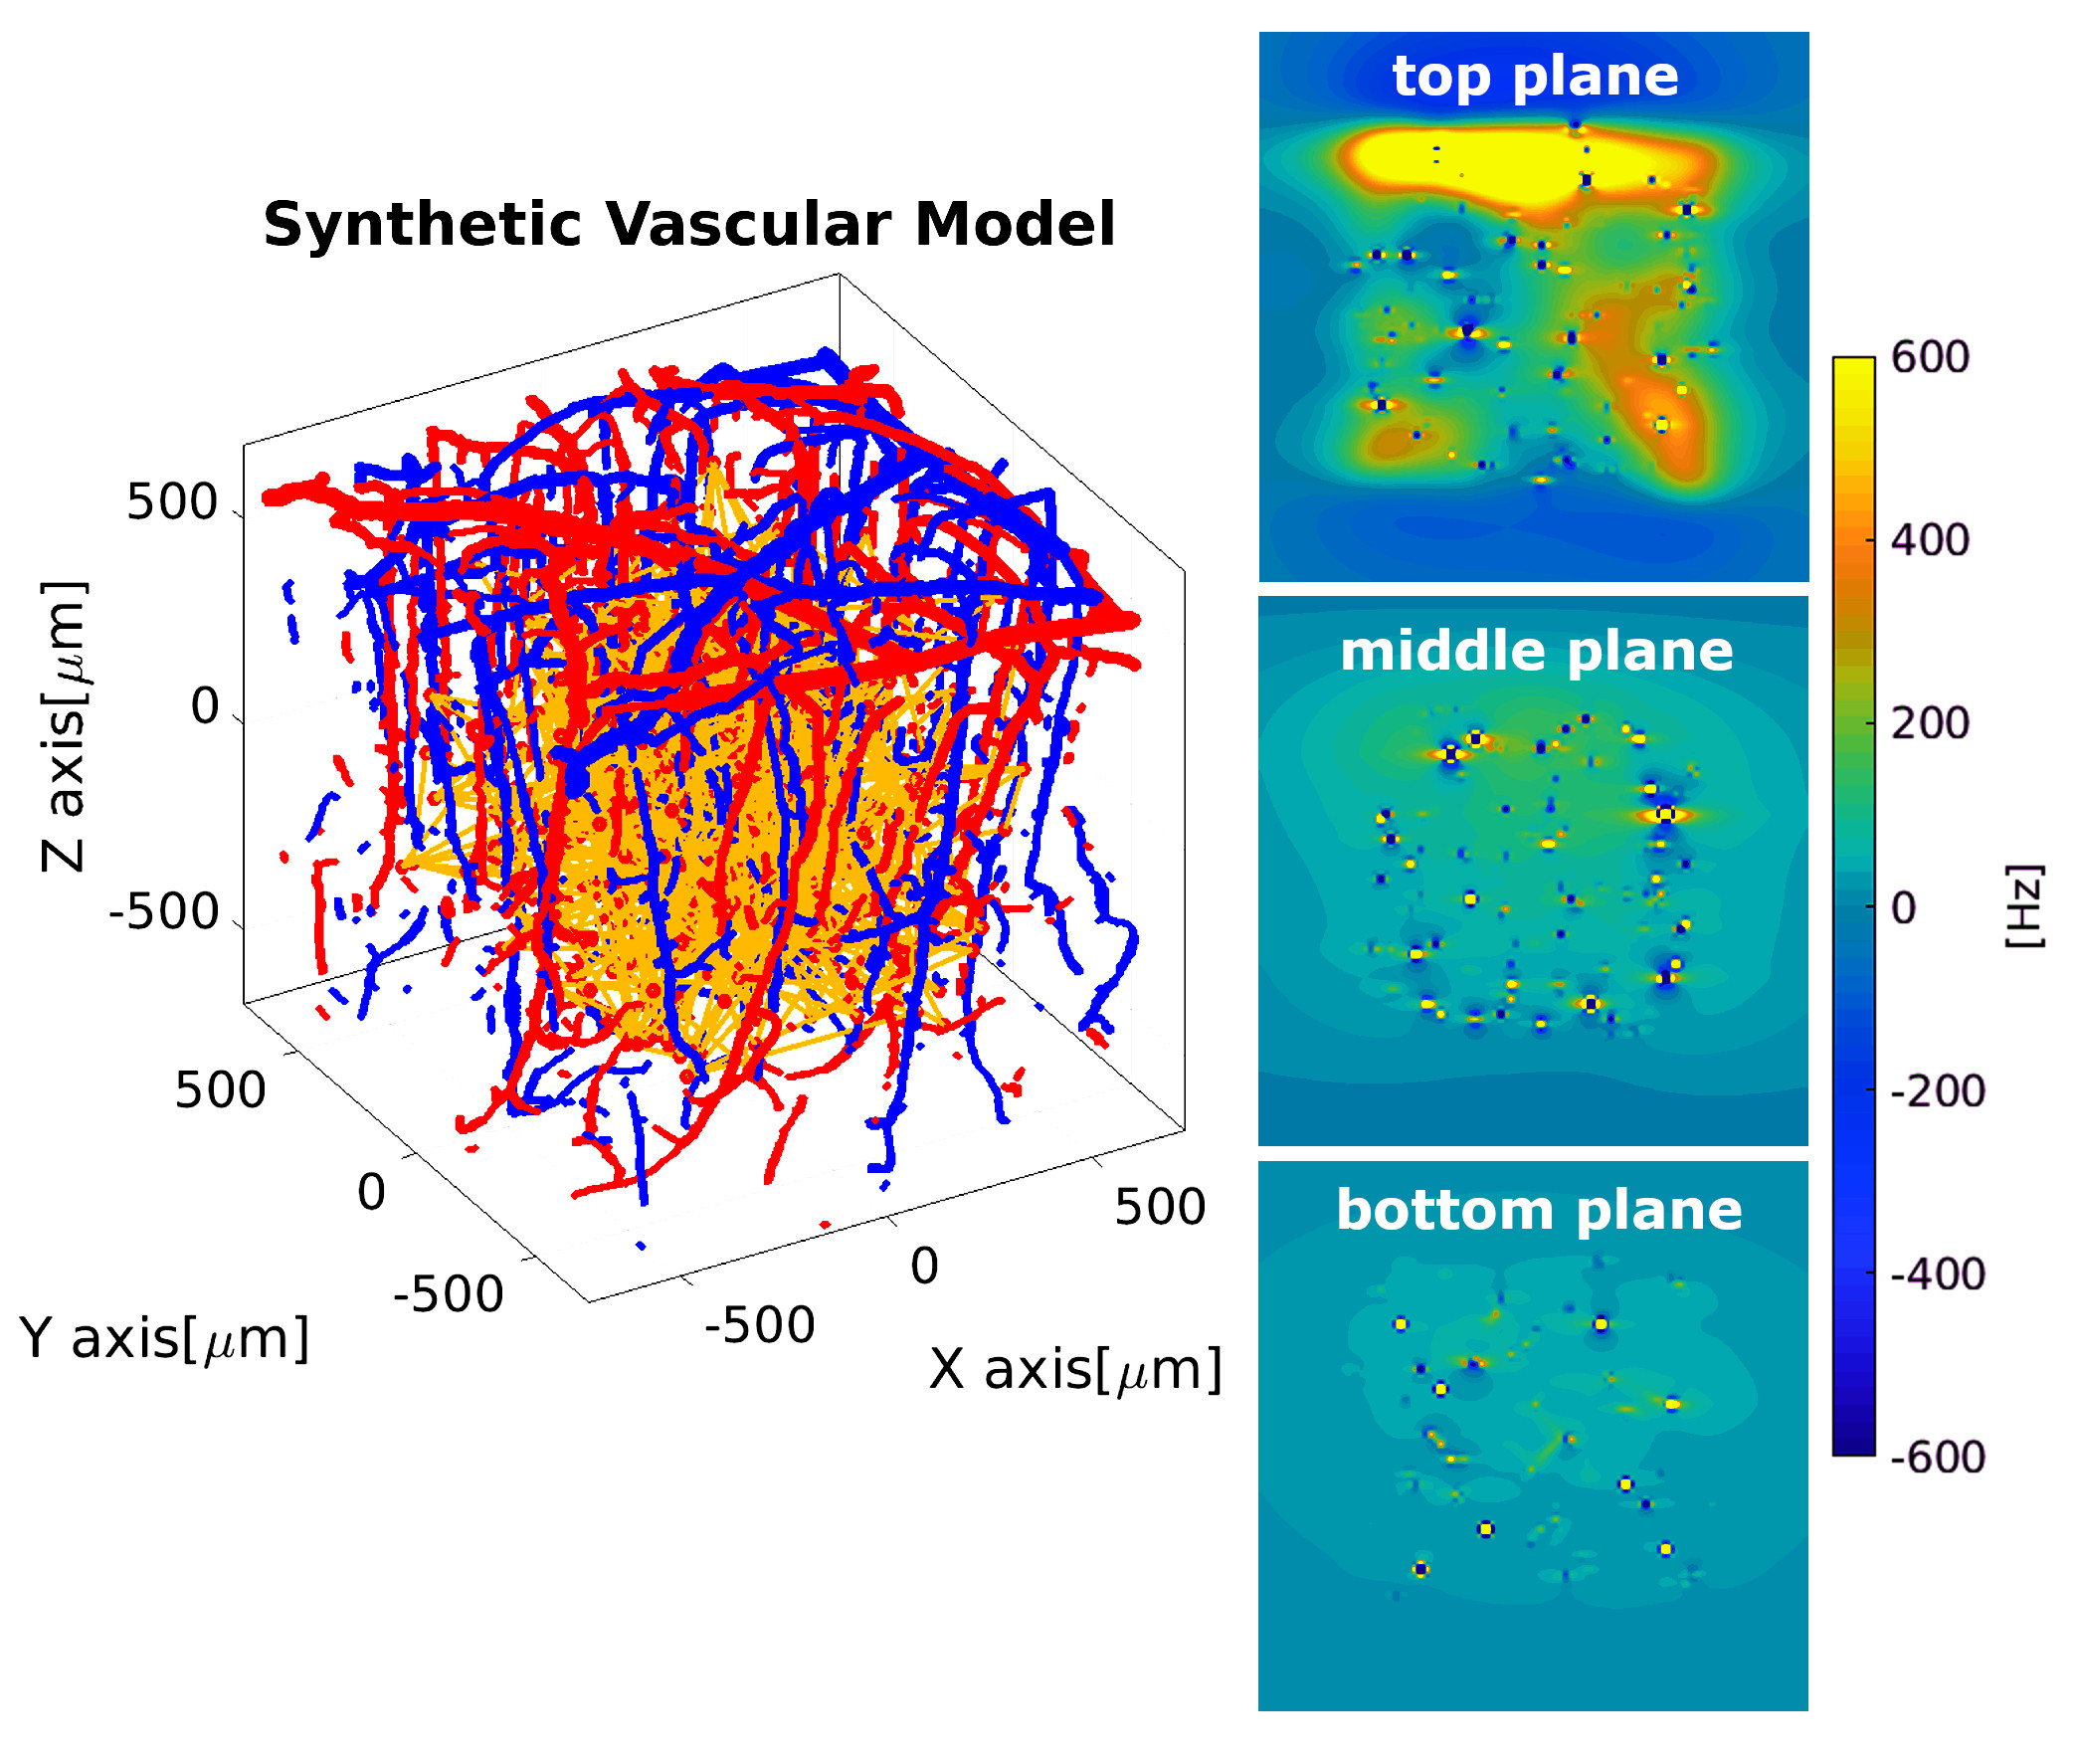
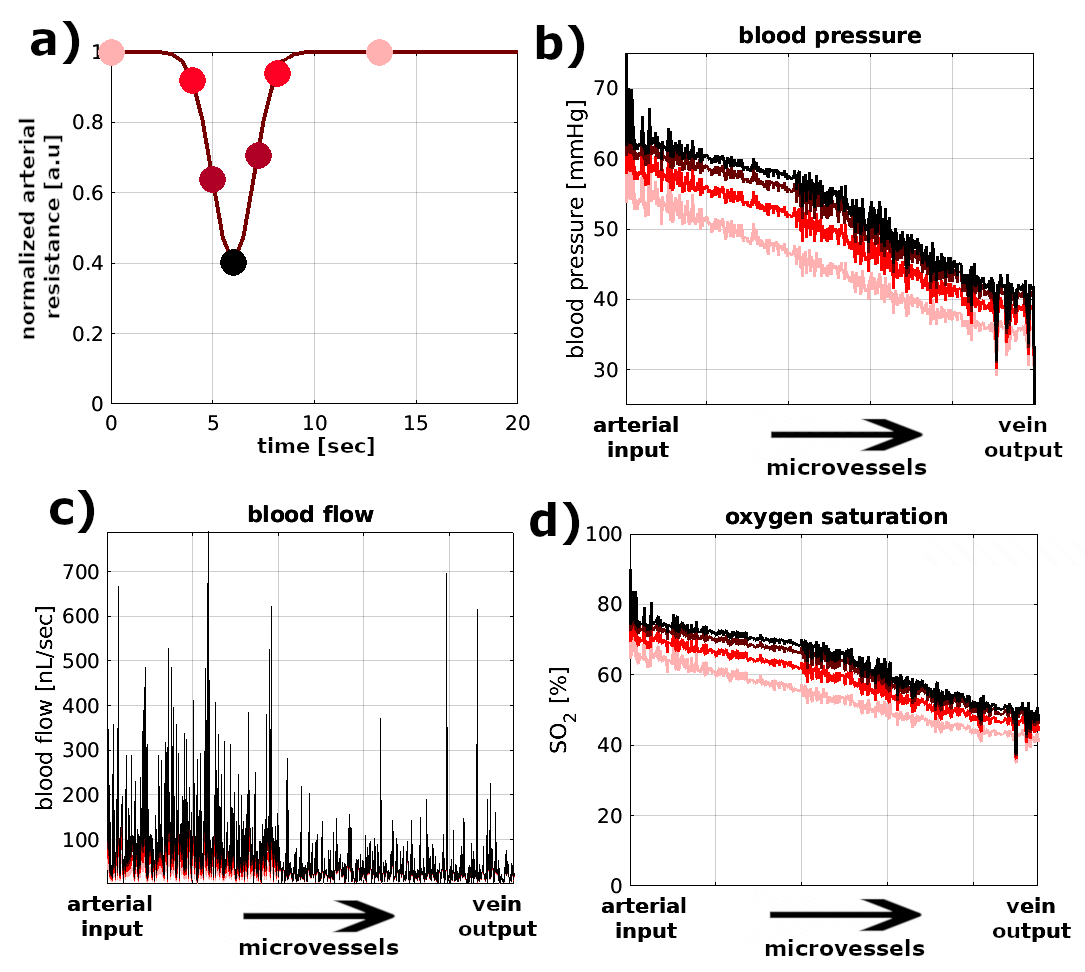
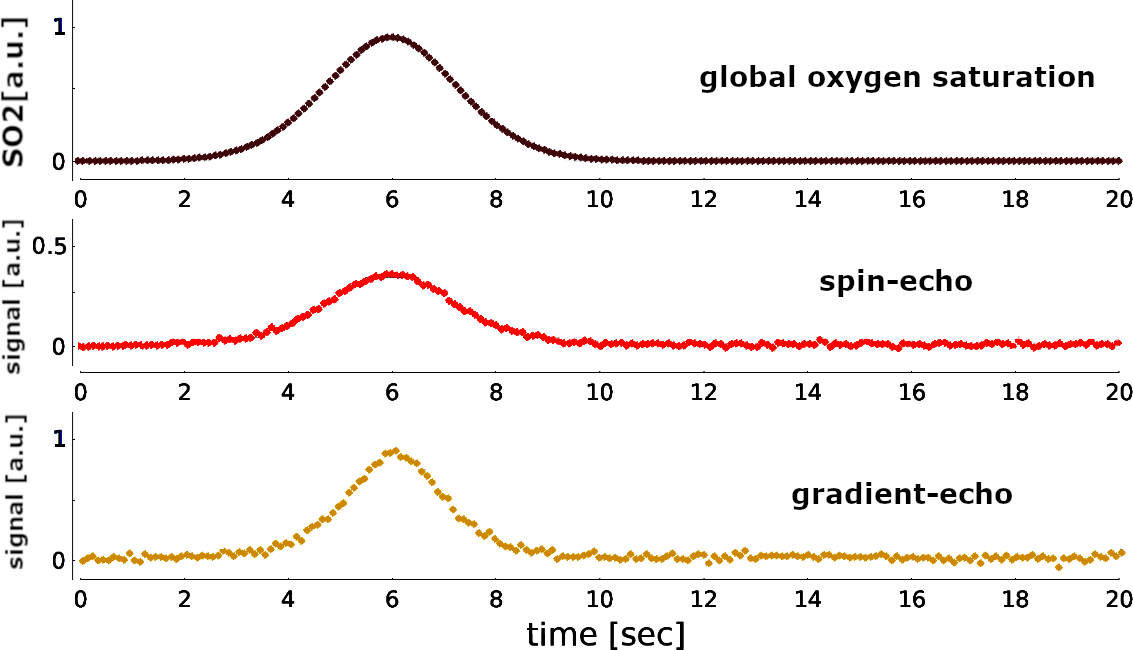
We have developed an algorithm that produces a synthetic 3D vascular model (SVM) that statistically conforms to the properties of the human cortical vasculature6,7,8 (Figure1,left). Properties accounted in the network generation are vessel’s radius, vessel’s length, number of connections between vessels, and orientation with respect to the cortical surface (detailed in abstract #478). The SVM thus generates a vascular network where hemodynamic simulations can be performed9, and gives the possibility to study different hemodynamic conditions. Here, we assumed an arterial dilation that produces a differential change of blood pressure, blood flow and oxygenation level across the SVM network. In order to compute the local magnetic field distortion, each microvessel is mimicked as a straight finite cylinder. The local magnetic variation depends on vessel radius, orientation with respect to the main magnetic field and oxygen saturation computed from the SVM model. Then, for each differential hemodynamic response, it is possible to compute a differential local magnetic field variation. In addition, water molecules in thermal motion are simulated by a Monte Carlo approach (1 µm2/ms), which sense the local magnetic field variation. The BOLD fMRI signal is computed by a phase accumulation of a bulk of spins depicting diffusion sensing the local magnetic field. All spin dephases are integrated over the echo-time corresponding to the particular hemodynamic stage. Simulations were computed for 1E7 spins for gradient-echo (TE=27ms) and spin-echo (TE=48ms) at 7T with a time resolution of 500µs.RESULTS
In Figure 1, a representative SVM model is schemed. The three magnetic field maps represent the local magnetic field variation produced on the top, middle and bottom planes of the SVM model for an exemplary time point. It is possible to observe the magnetic distortions produced by the microvascular network in the middle plane (green colorscale). The top plane highlights the magnetic field distortion induced by the macrovascular compartment. Figure 2 shows the hemodynamic changes (blood pressure, blood flow and oxygen saturation level) that resulted from an arterial dilation on the SVM network. The main parameter that alters the local magnetic field is the oxygen saturation level of each vascular segment. Figure 3 shows the BOLD fMRI time-course computed for a gradient-echo and spin-echo pulse sequence. It is possible to observe qualitative differences on both the amplitude (~two times fold) and the width of the BOLD fMRI signal related to the global oxygen saturation change.DISCUSSION/CONCLUSION
We have simulated the evolution of the BOLD fMRI time course using a synthetic 3D model of the human cortical vasculature and a realistic hemodynamic response for an arterial dilation. Further, this model allows us to convert the oxygenation level changes into a spatial magnetic field variation. In addition, simulation of water diffusion sensing the differential local magnetic field gives insights to disentangle quantitative hemodynamic properties of the BOLD fMRI signal. Simulated BOLD signals show qualitative differences in the amplitude and width for a gradient-echo and spin-echo pulse sequence. This sort of simulation helps to understand the physiological fingerprint of the BOLD fMRI signal formation in humans.Acknowledgements
This work was supported by the National Institute Of Mental Health of theNational Institutes of Health under Award Number R01MH111417References
1.Ogawa, S. et al. Functional brain mapping by blood oxygenation level-dependent contrast magnetic resonance imaging. A comparison of signal characteristics with a biophysical model. Biophys. J. 1993; 64:803–812
2.Kiselev V.G., Posse S. Analytical model of susceptibility-induced MR signal dephasing: effect of diffusion in a microvascular network. Magn Reson Med 1999; 41:499-509
3.Weisskoff, R., et al. Microscopic susceptibility variation and transverse relaxation: Theory and experiment. Magn. Reson. Med 1994; 31:601–610
4.Báez-Yánez M.G. et al. The impact of vessel size, orientation and intravascular contribution on the neurovascular fingerprint of BOLD bSSFP fMRI. Neuroimage 2017;163:13-23
5.Gagnon, L. et al. Quantifying the microvascular origin of BOLD-fMRI from first principles with two-photon microscopy and an oxygen-sensitive nanoprobe. J. Neurosci. 2015; 35: 3663–3675
6.Cassot F. et al. A novel three-dimensional computer-assisted method for a quantitative study of microvascular networks of the human cerebral cortex. Microcir 2006; 13:1-18
7.Lorthois S. et al. Simulation study of brain blood flow regulation by intra-cortical arterioles in an anatomically accurate large human vascular network: Part I: Methodology and baseline flow. NeuroImage 2011; 54:1031-1042
8.Payne S.J., El-Bouri W.K. Modelling dynamic changes in blood flow and volume in the cerebral vasculature. NeuroImage 2018; 176:124-137
9.Boas, D.A. et al. A vascular anatomical network model of the spatio-temporal response to brain activation. NeuroImage 2008; 40:1116–1129
Figures