1309
Multi-slice arterial spin labelled myocardial perfusion imaging with single shot EPI1Electrical and Computer Engineering, University of Southern California, Los Angeles, CA, United States
Synopsis
Arterial spin labelled cardiac magnetic resonance (ASL-CMR) imaging is a non-contrast myocardial perfusion (MP) imaging technique which can detect clinically relevant changes in MP under vasodilatory stress. Existing ASL-CMR techniques have limited spatial coverage because they cannot acquire multiple slices during the limited duration of pharmacologically induced peak stress (~3-4 min). In this work, we demonstrate the feasibility of a using carefully designed single shot echo planar imaging sequence for multi slice ASL-CMR at 3T.
Introduction
Arterial spin labeled cardiac magnetic resonance imaging (ASL-CMR) is a non-contrast myocardial perfusion (MP) imaging technique that can be used for diagnosis of coronary artery disease (CAD)1. CAD can be detected based on reduced perfusion during pharmacological vasodilation, which is limited to 3-4 min in humans; the time it takes to acquire a single slice with existing techniques. To make ASL-CMR clinically feasible spatial coverage needs to be improved without increase in scan time. Most existing ASL-CMR methods at 3T use balanced steady-state free precession (bSSFP) imaging which is not compatible with sequential or simultaneous multi-slice imaging due to a long imaging window or un-resolved artifacts that corrupt the ASL signal2,3, respectively. Alternatively, single shot echo planar imaging (SS-EPI) is a fast imaging technique that can reduce the imaging window from 200ms (imaging duration for bSSFP) to roughly 50ms and may enable sequential multi-slice ASL-CMR. EPI was the first imaging technique used for ASL-CMR at 1.5T4 and has recently been demonstrated for diffusion tensor imaging (DTI) at 3T5. In this study, we present a practical implementation of SS-EPI and demonstrate sequential multi-slice ASL with no increase in scan time.Methods
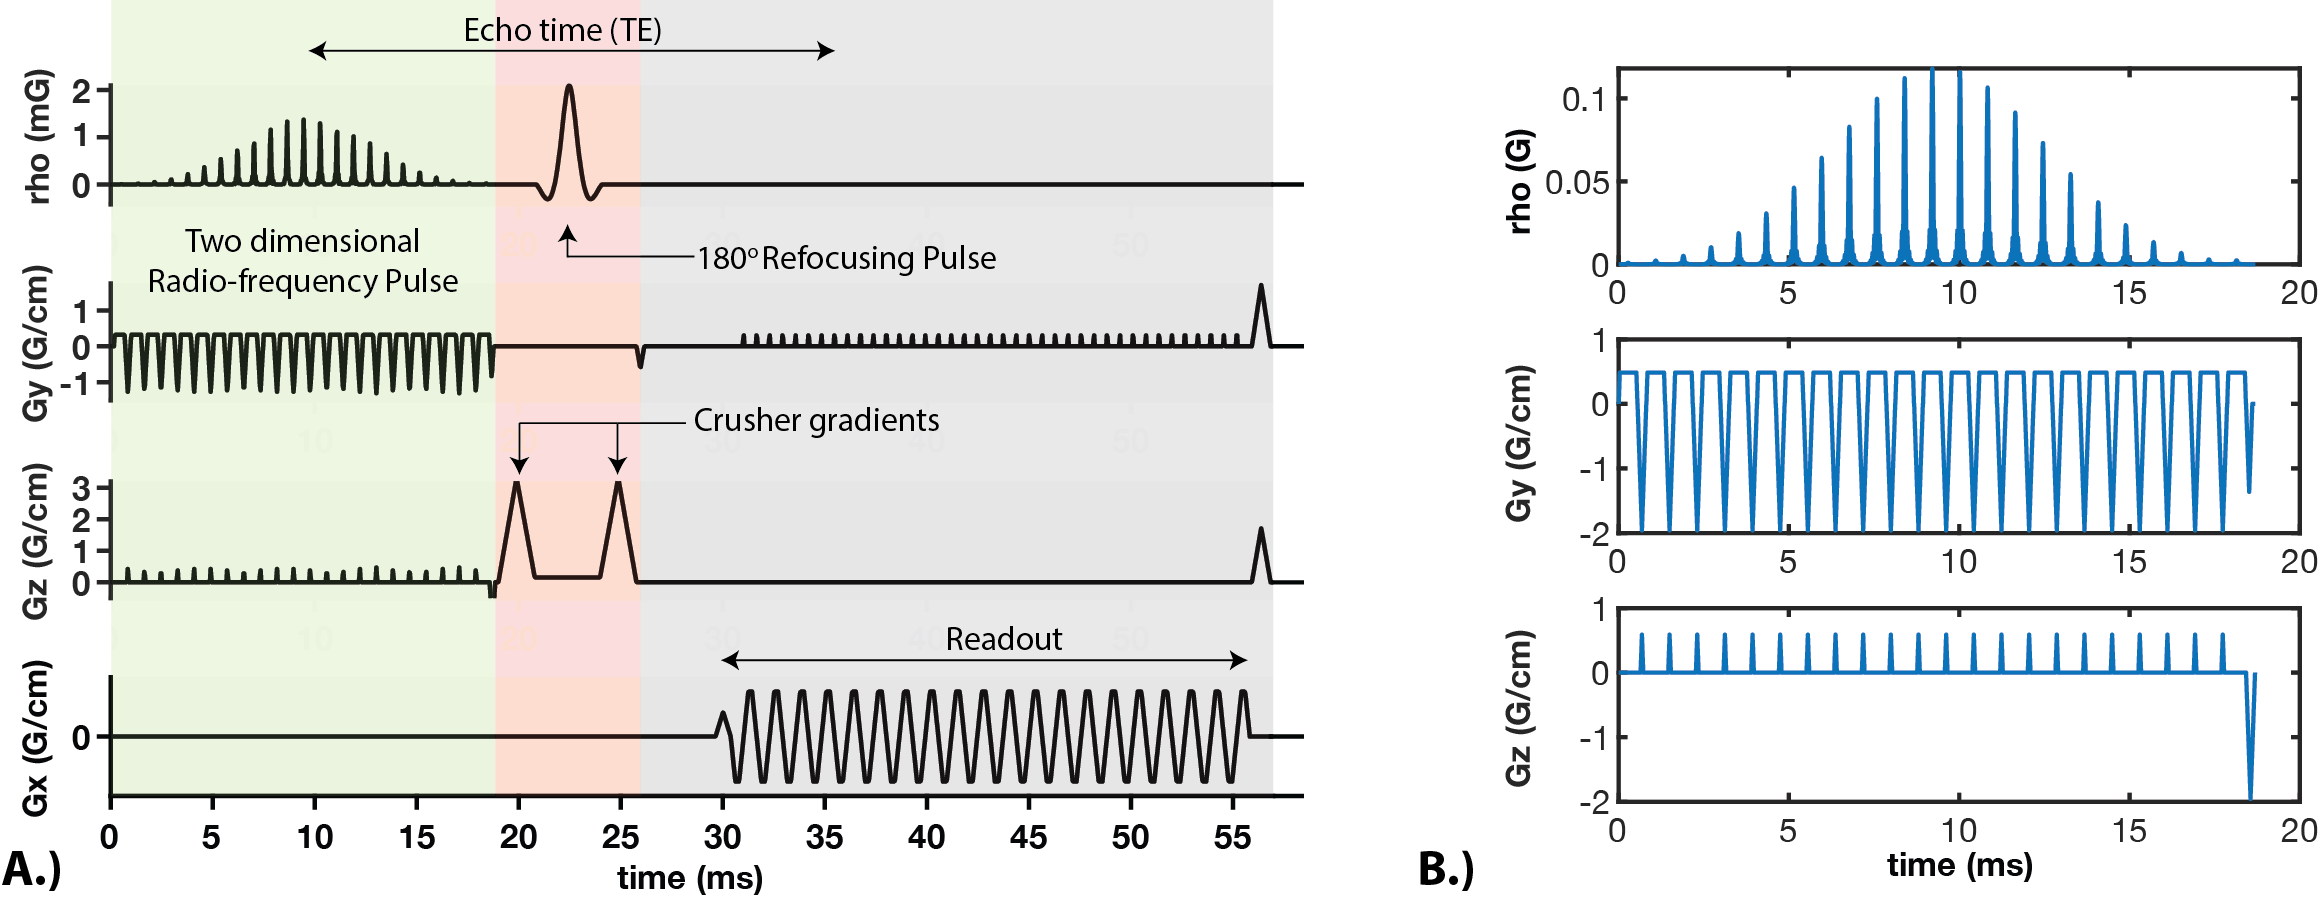
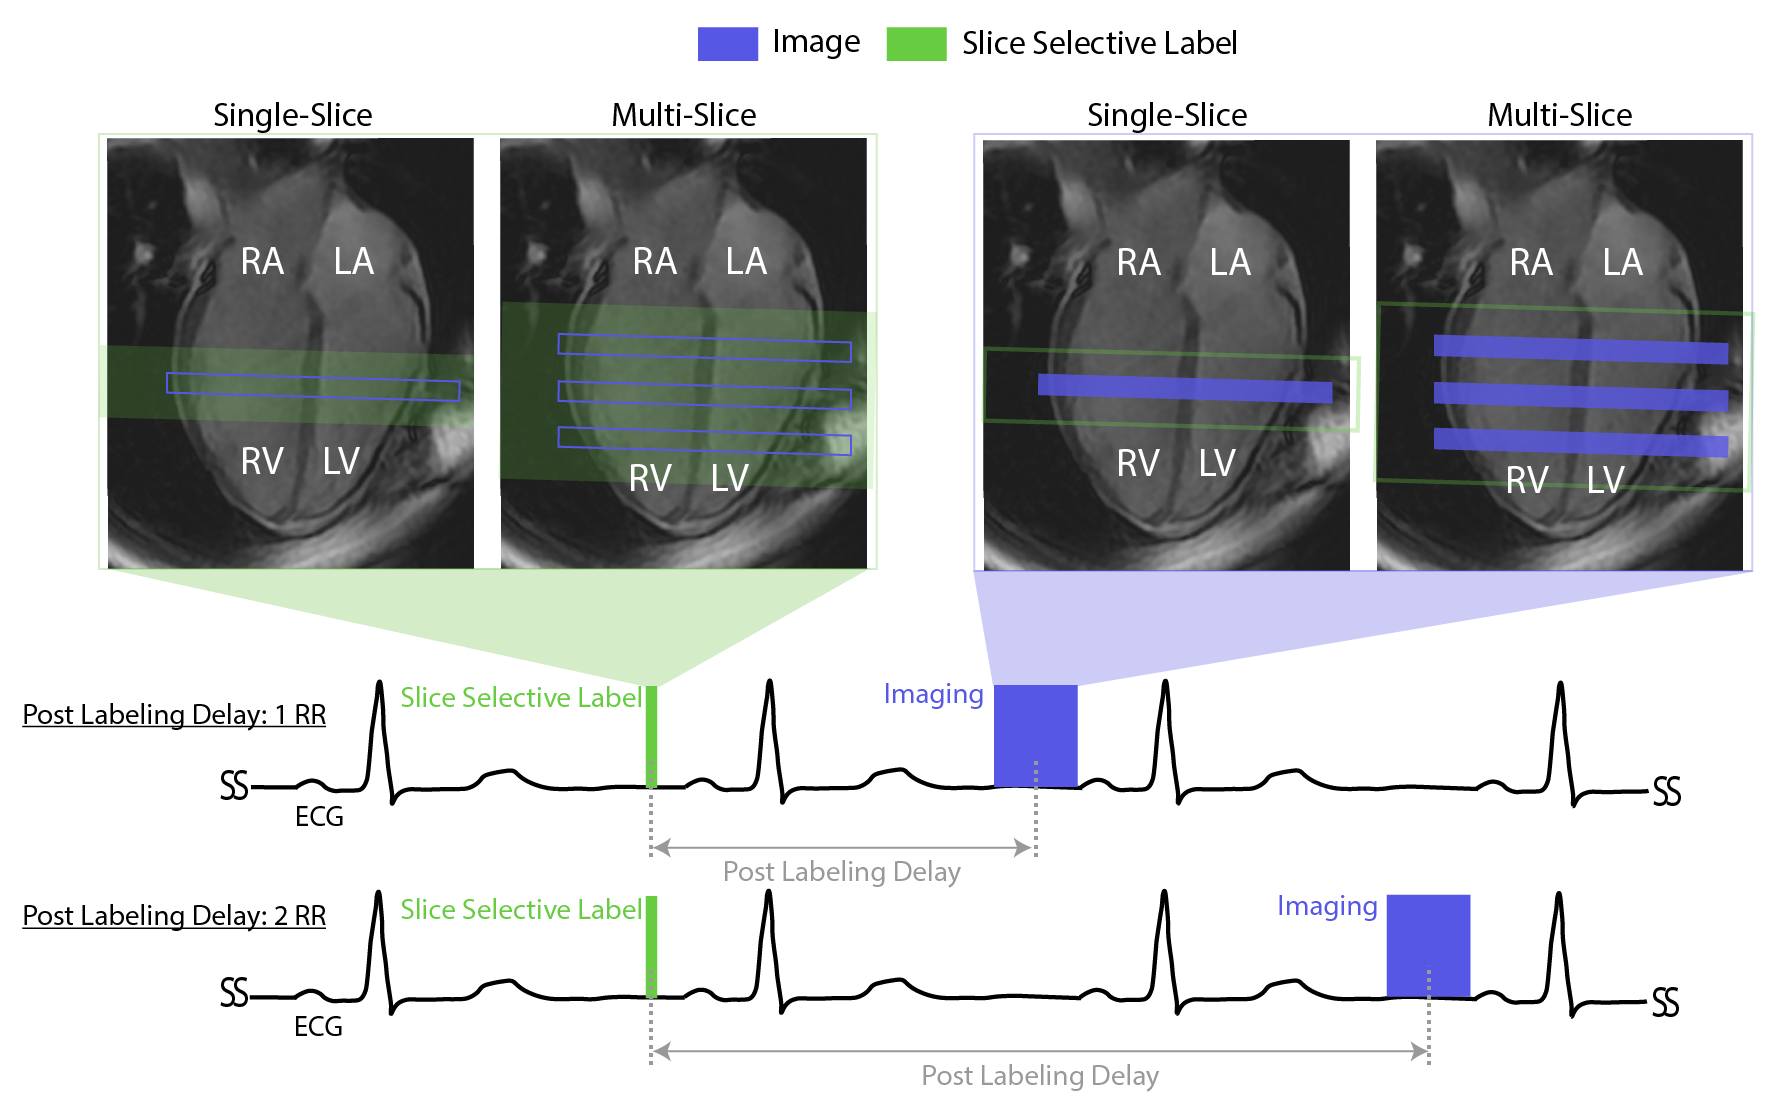
Imaging: Double gated flow alternative inversion recovery (DG-FAIR) was performed in short-axis slices with both SS-EPI and bSSFP imaging6. Reduced FOV SS-EPI imaging was performed using a two-dimensional radio-frequency pulse (2DRF)7, shown in Figure 1, with acquisition parameters: FOV 28x14 cm, TE/TR 31.3 ms /55ms, flip angle 90º, matrix size 128x64, partial Fourier factor 5/8th, readout time= 25 ms, and velocity-cutoff systole: 25 cm/s and diastole: 15 cm/s8. bSSFP imaging was performed with the previously published acquisition parameters9.Experiments: All experiments were performed on a GE (Signa Excite HD) 3T scanner with an 8-ch cardiac coil. Four healthy volunteers (1M/3F Age: 27-36) were scanned. The imaging protocol was approved by our IRB and informed consent was obtained from all volunteers. In all subjects, we performed single-slice DG-FAIR SS-EPI with post labeling delay (PLD): 2RR and bSSFP with PLD: 1RR and 2RR, during both stable systole and diastole, as shown in Figure 2. bSSFP with PLD of 1RR was used as the reference method whereas PLD of 2RR was used for pairwise comparison with one independent variable. Sequential multi-slice DG-FAIR SS-EPI was also performed in three of the four volunteers. Basal, mid, and apical short-axis (SAX) slices were acquired for diastolic imaging. Mid and apical SAX slices were acquired for systolic imaging. The order of slice acquisition was base to apex. The labeling slab thickness was 30mm, 50mm, and 70mm for the single, multi-slice systolic and multi-slice diastolic experiments, respectively.
Analysis: Reconstruction of SS-EPI was performed using GE orchestra toolbox (GE Healthcare, Waukesha, WI, USA). bSSFP images were reconstructed using a custom implementation of GRAPPA10. Per-pixel SNR maps were computed using the pseudo-replica method11. Semi-automated segmentation was done using previously published methods12. Global MP and physiological-noise (PN) for both single slice and multi-slice data was calculated in the same way as described by Poncelet et al.4.
Results and Discussion
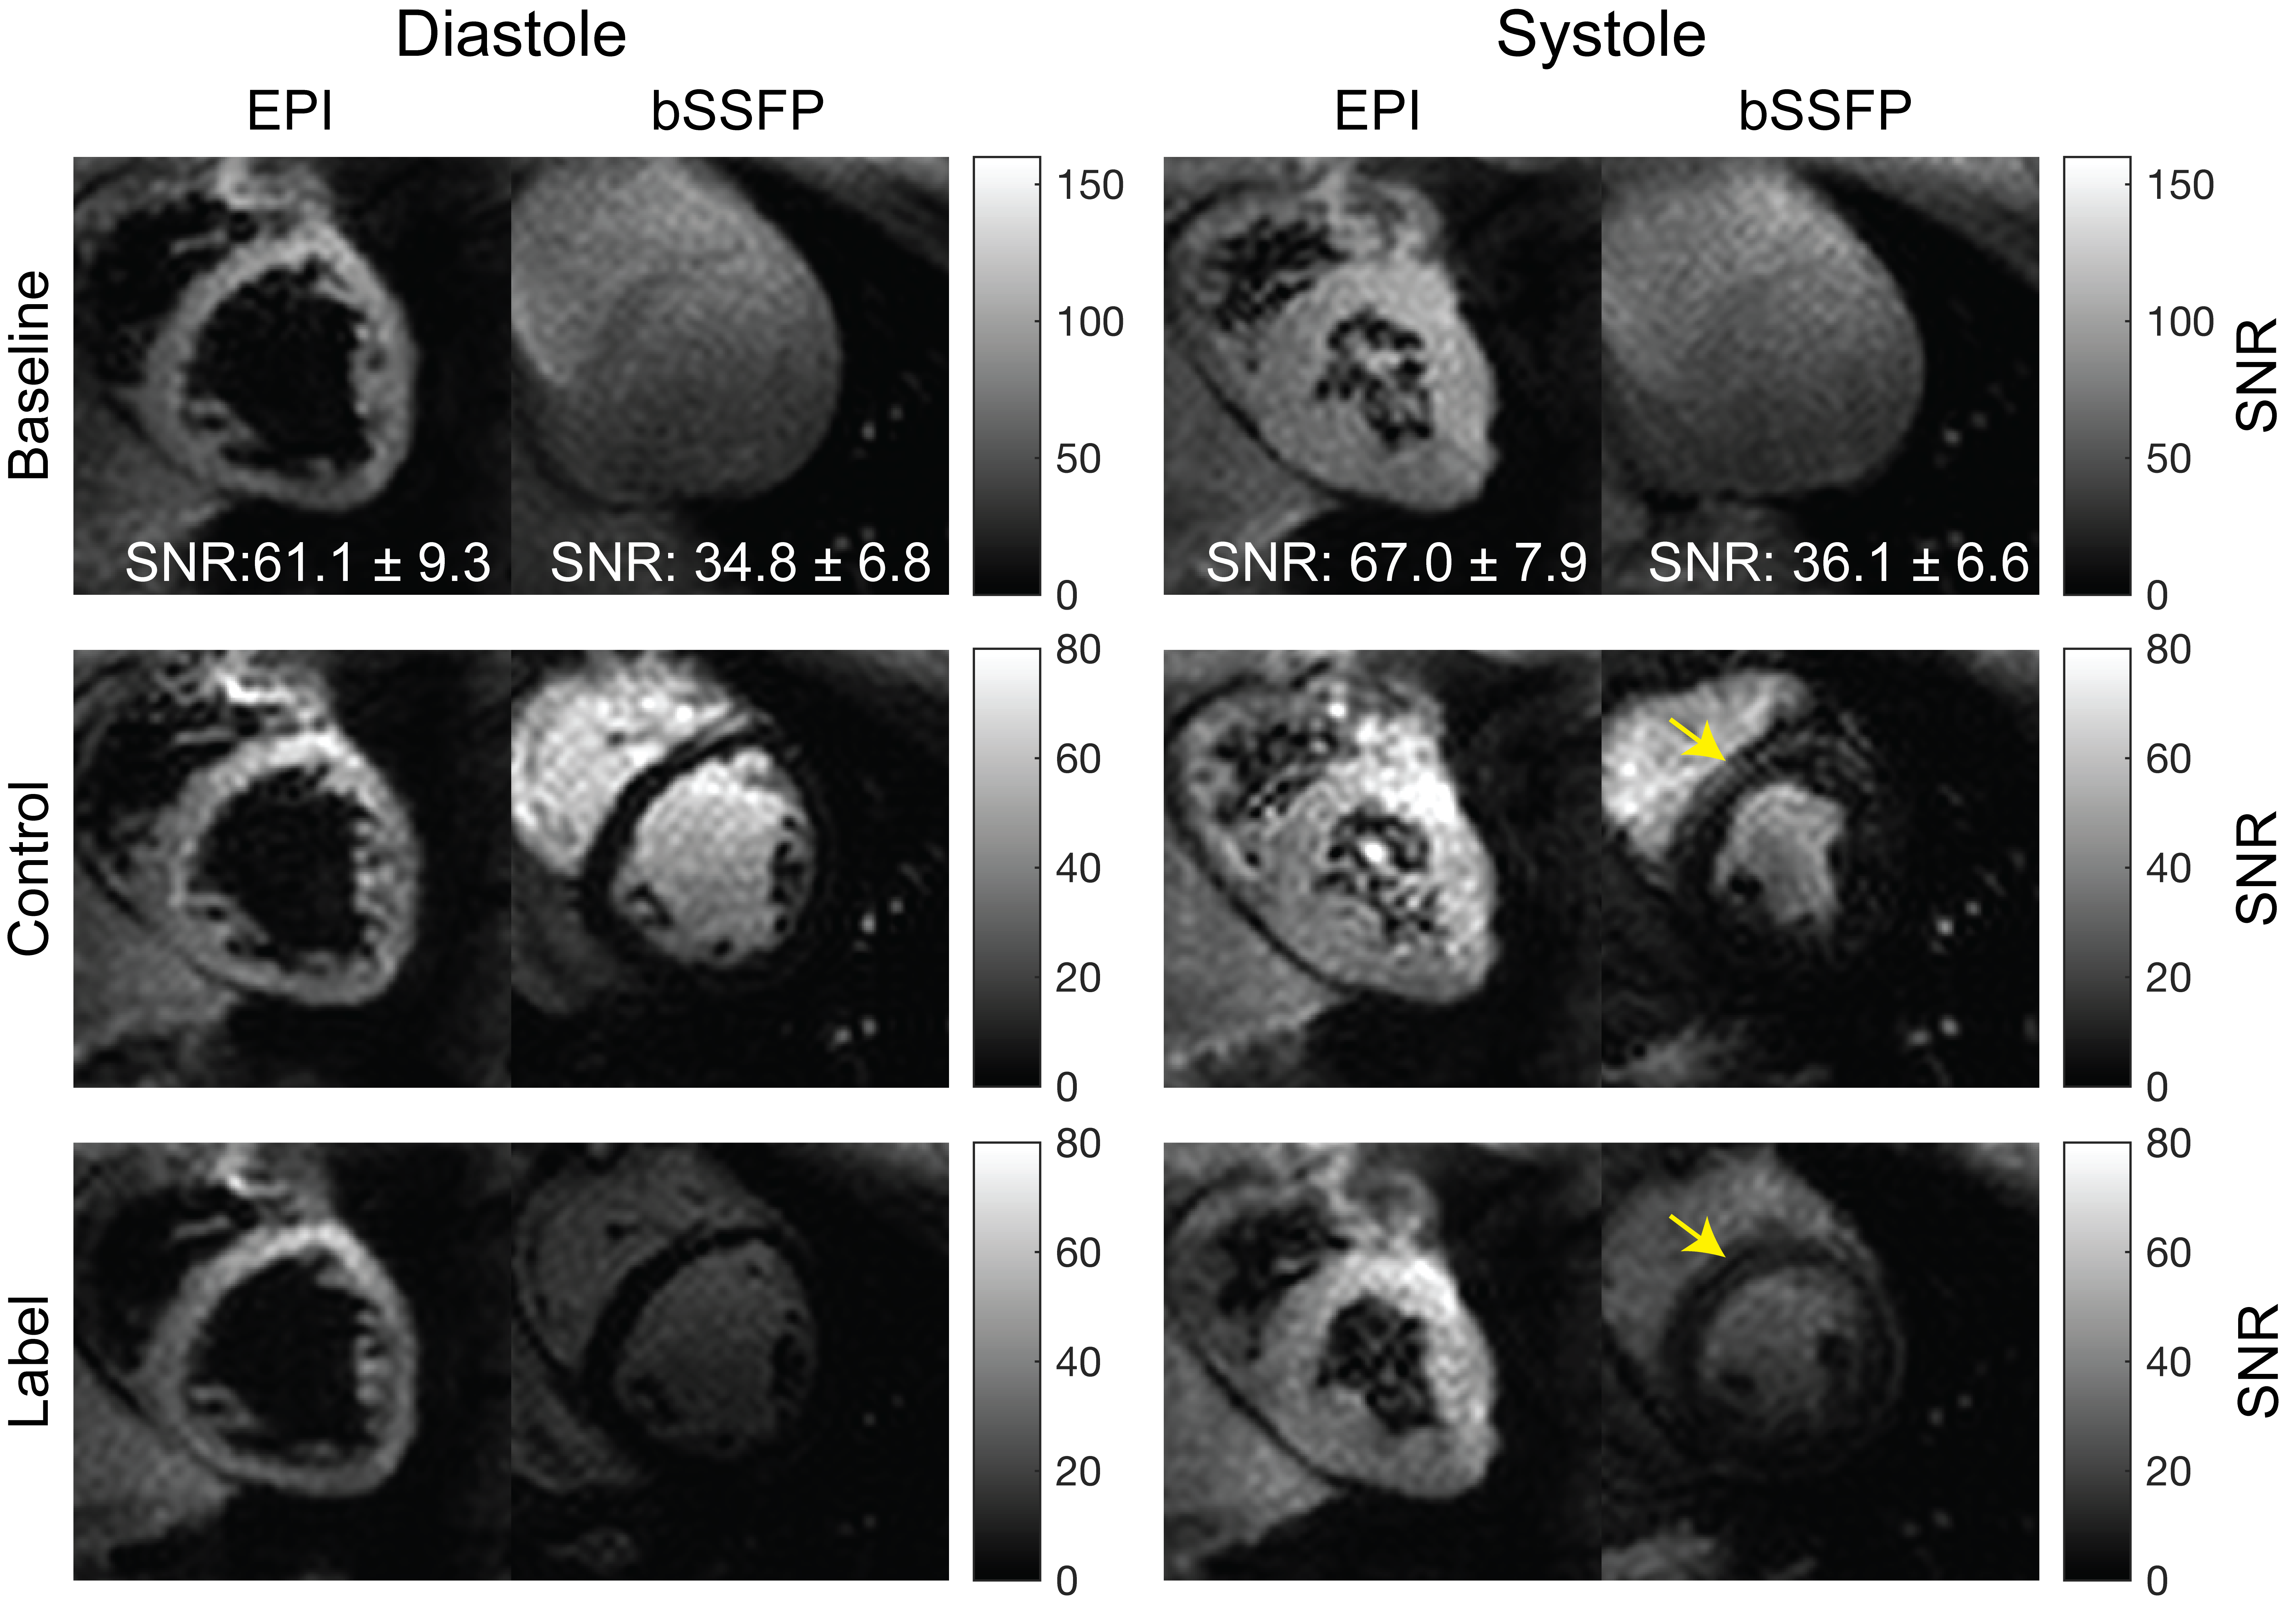
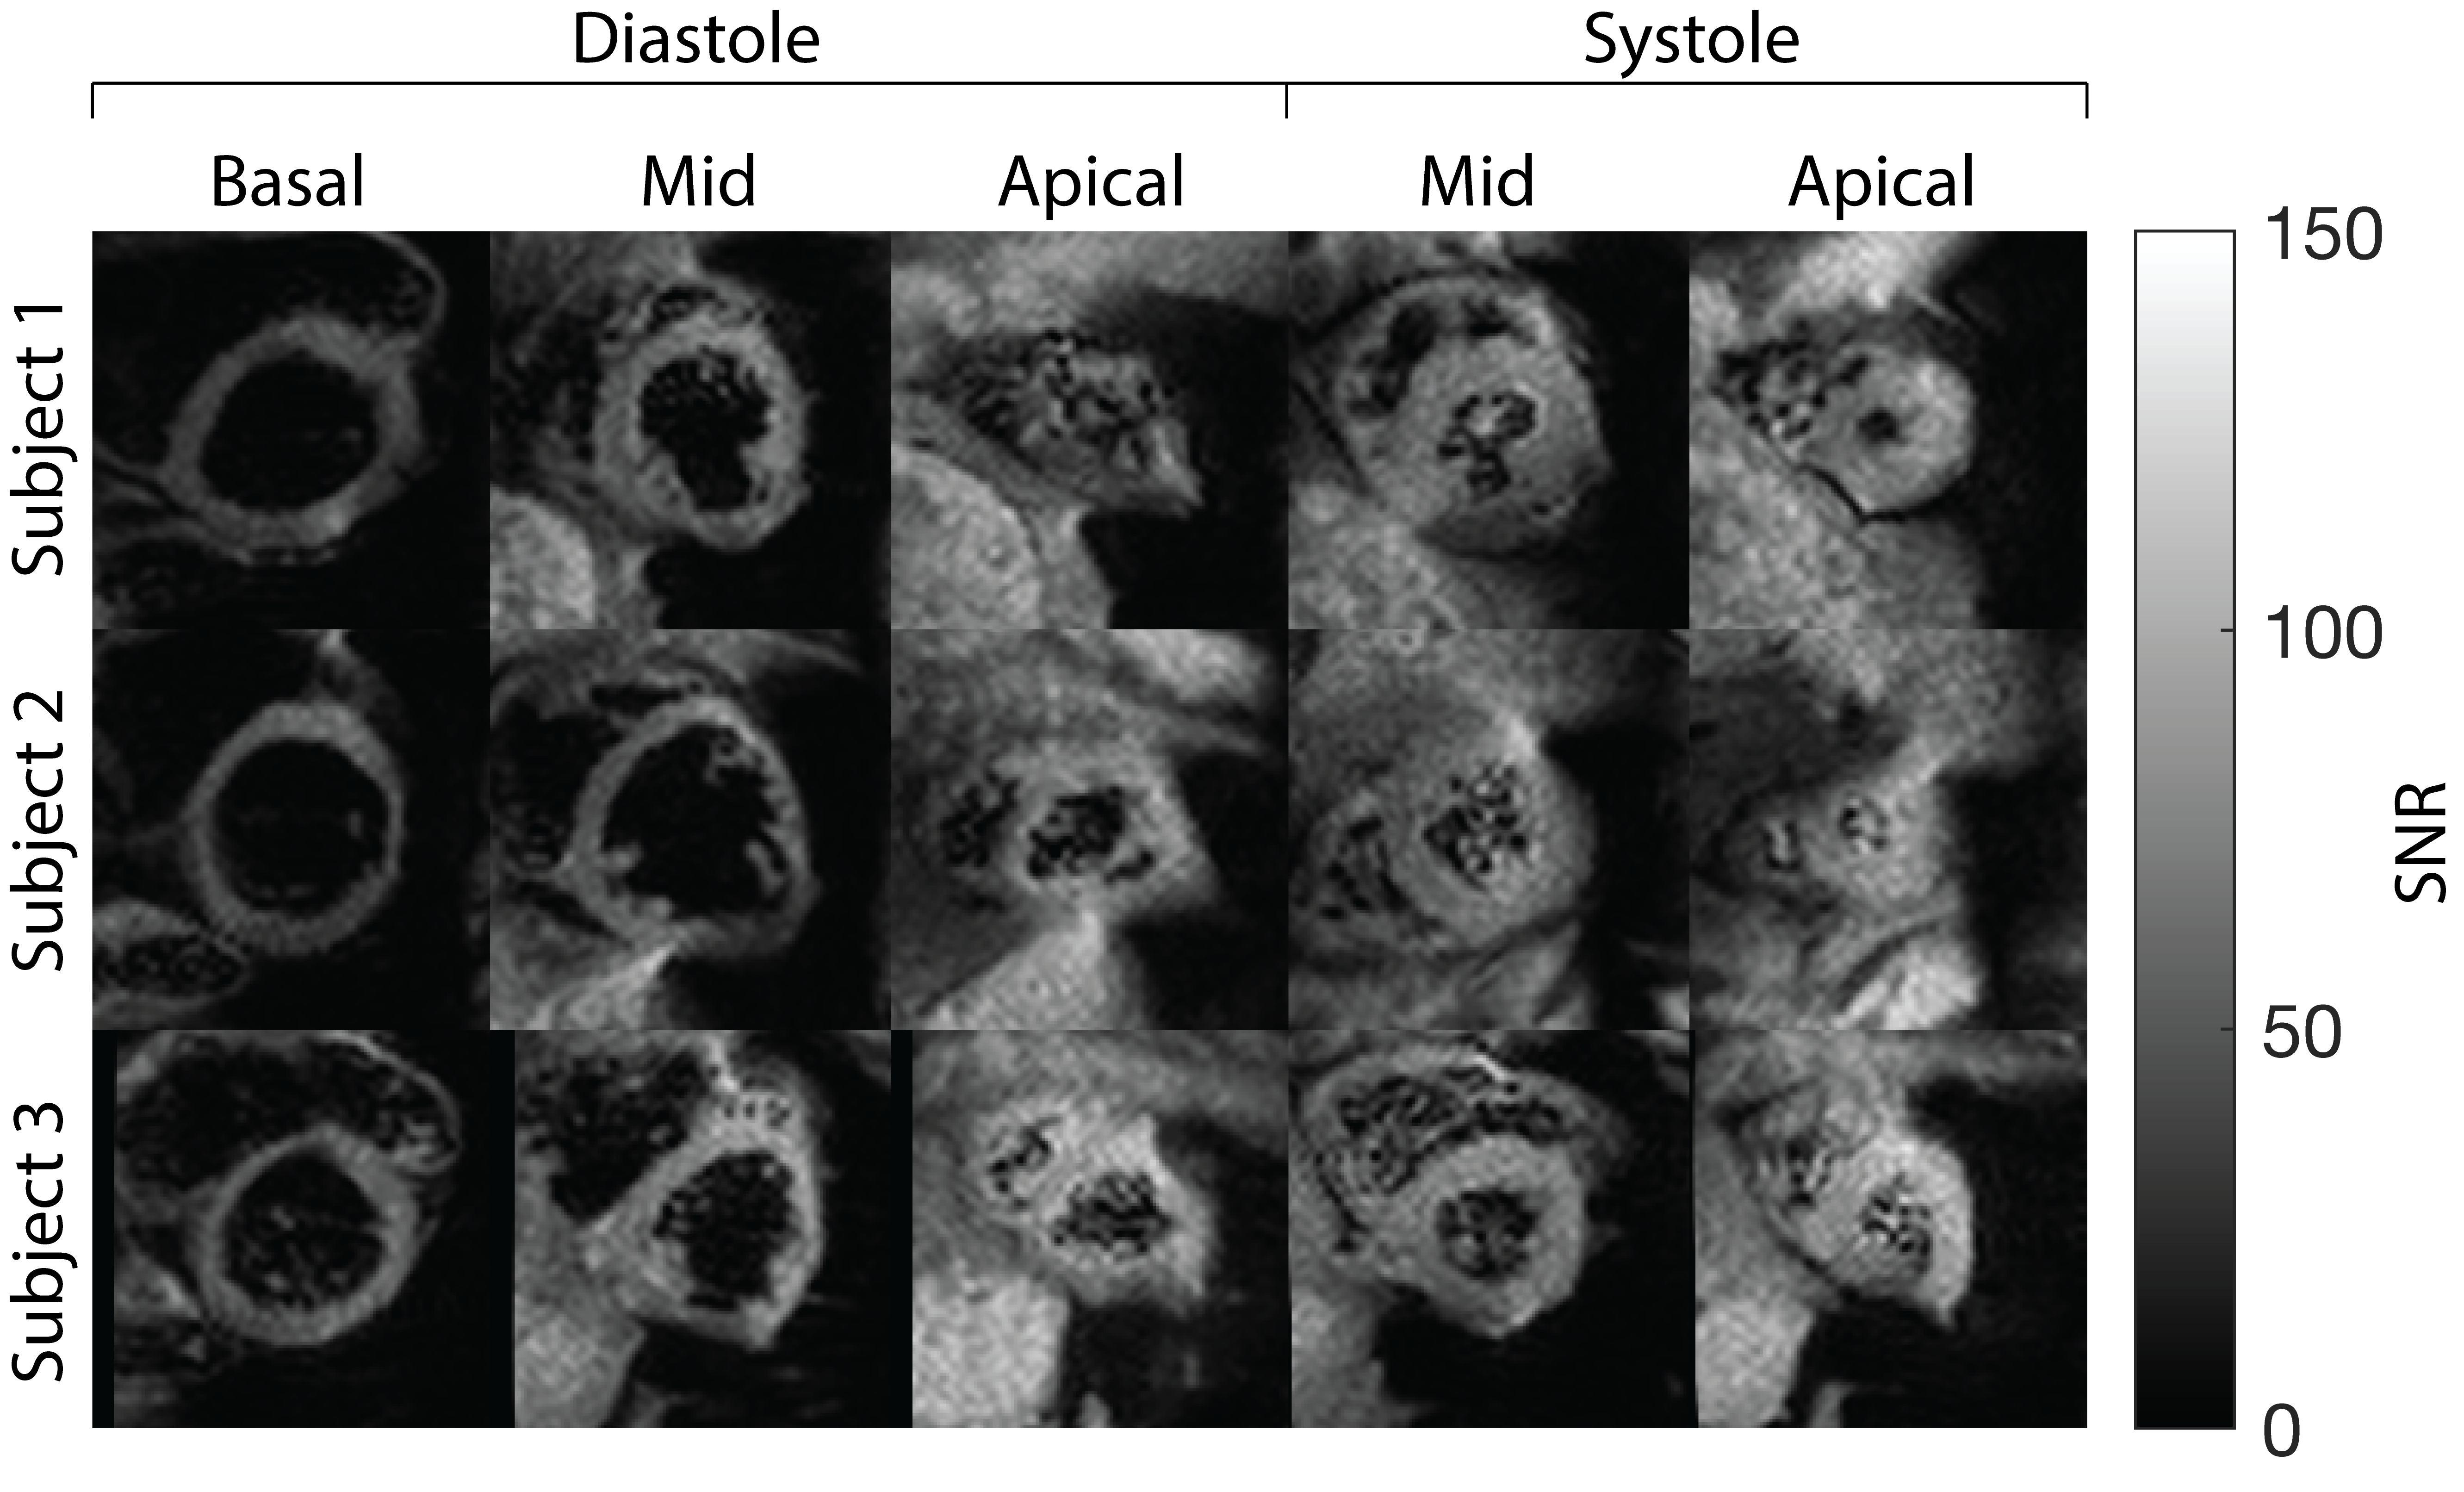
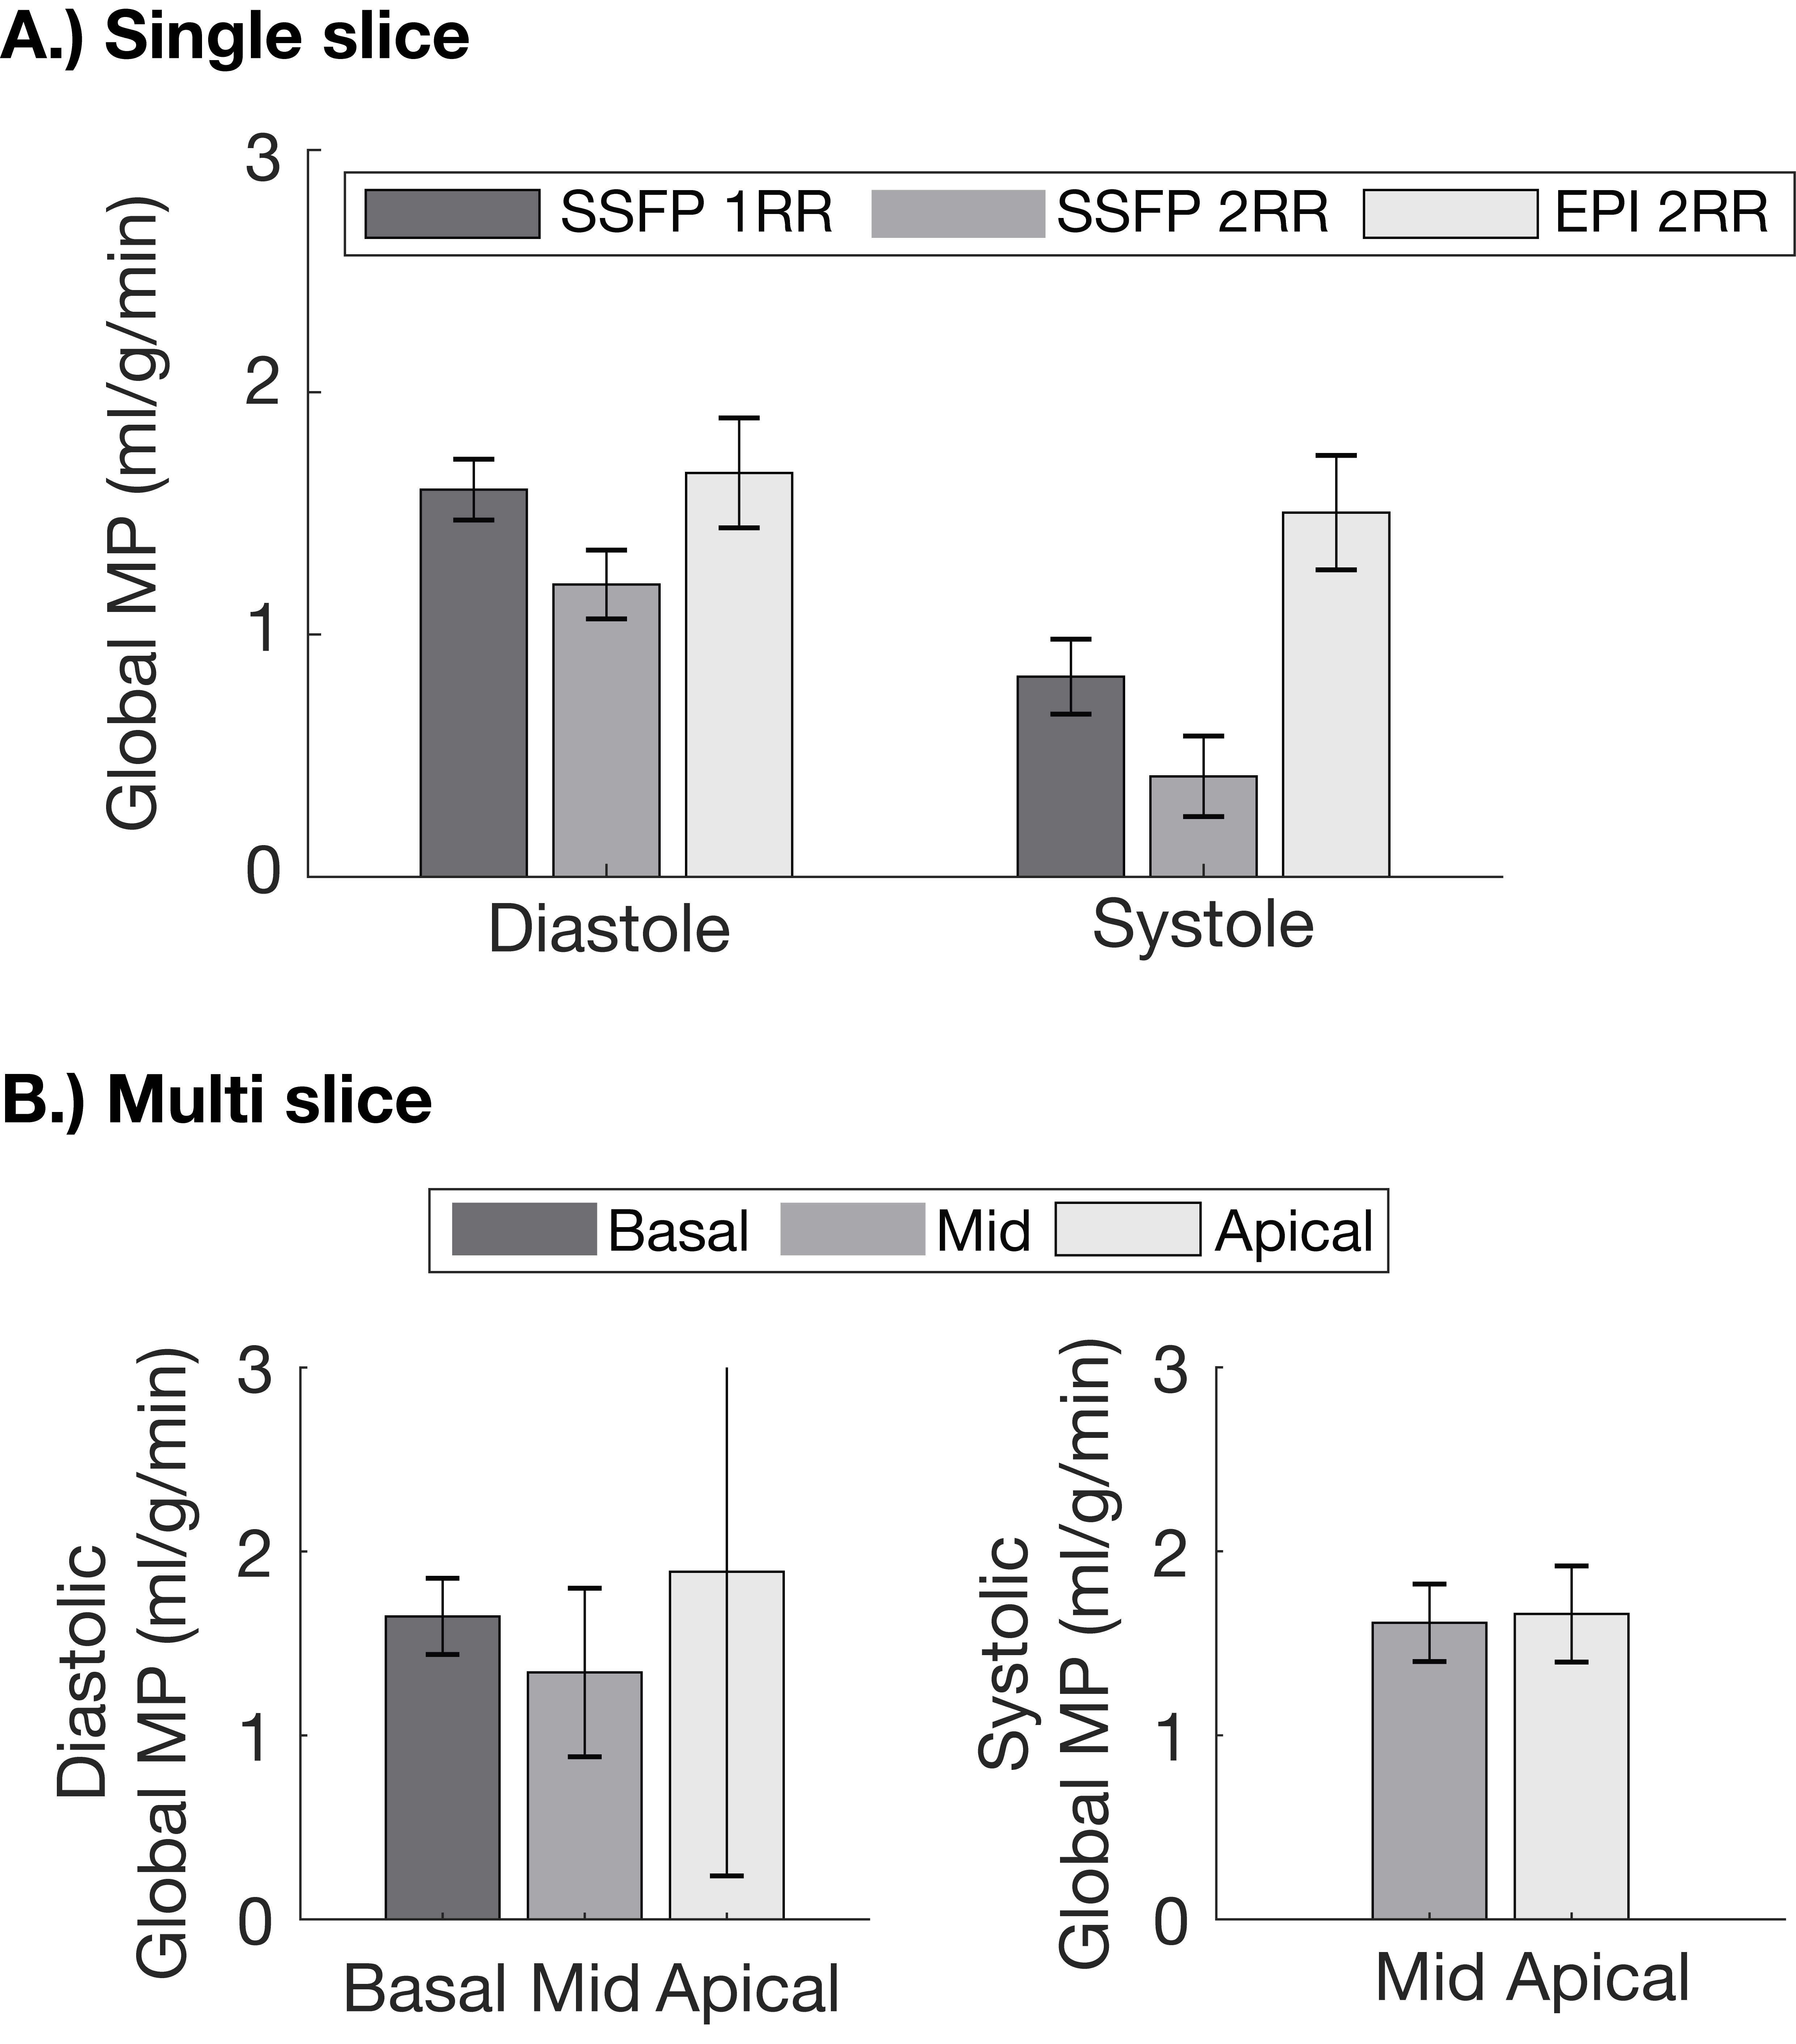
Figure 3 show representative image quality. Average Myocardial SNR for SS-EPI (diastole:61.1±9.3, and systole:67±7.9) was higher than bSSFP (diastole:34.8±6.8, and systole:36.1±6.6). Overall SS-EPI images were artifact free and could be used for measuring MP. Figure 4 contains sequential multi-slice SS-EPI images for three subjects. These were all acquired in the same scan duration as a single-slice acquisition. Image quality in the multi-slice experiments was comparable to the single slice images overall, but geometric distortion in the apical slice during diastole was severe and resulted in lower image quality.Figure 5A summarizes validation experiments comparing DG-FAIR SS-EPI against bSSFP. Six and two out of twenty-four control and label pairs were rejected for diastolic and systolic SS-EPI, respectively, due to mis-triggering. Global MP for diastolic SS-EPI (1.67±0.72 ml/g/min) and systolic SS-EPI (1.50±0.36 ml/g/min) were found to be statistically equivalent to diastolic bSSFP (1RR: 1.59±0.80 ml/g/min) based on TOST with P-values of 0.022 and 0.031, respectively. This shows that SS-EPI can measure MP and the measured values are comparable to existing ASL-CMR methods.
Figure 5B shows global MP for sequential multi-slice SS-EPI. MP was 1.64±0.47, 1.34±0.29, and 1.88±0.58 for basal, mid, and apical slices, respectively, during diastole. MP was 1.61±0.35, and 1.66±0.49 for mid, and apical slices, respectively, during systole. MP measured during multi-slice experiments was comparable to current and previous ASL-CMR studies. We observed low inter-slice variability in systolic ASL-CMR with PN comparable to previous studies, and high inter-slice variability for diastolic ASL-CMR with PN increasing with slice number. The increase in PN could be due to slice order or worse image quality in apical slices during diastole. This study would benefit from comparison with reference single slice MP measurements for non-mid SAX slices, and further improvements in image quality for diastolic imaging.
Conclusion
We have demonstrated SS-EPI with carefully optimized settings for human myocardial ASL-CMR at 3T during both systole and diastole. Single-slice MP measured using SS-EPI was statistically equivalent to diastolic bSSFP, which is the current reference method. We have also demonstrated sequential two-slice imaging using SS-EPI for ASL-CMR without increasing in scan time and extending this to three or more slices remains work in progress.Acknowledgements
We gratefully acknowledge funding support from NIH R01-HL130494. The authors also thank Hung P Do, Terrence Jao, Nam Lee, and Vanessa Landes for helpful discussions during the course of the study.References
1. Zun Z, Varadarajan P, Pai RG, Wong EC, Nayak KS. Arterial Spin Labeled CMR Detects Clinically Relevant Increase in Myocardial Blood Flow With Vasodilation. JACC: Cardiovascular Imaging 2011;4:1253–1261.
2. Landes VL, Nayak KS. Iterative correction of RF envelope distortion with GRATER‐measured waveforms. Magn Reson Med 2020;83:188–194.
3. Landes V, Jao T, Nayak K. Simultaneous Multi-slice bSSFP CMR: Is it feasible? In: SCMR 21st Scientific Session. Barcelona; 2018. p. 333.
4. Poncelet BP, Koelling TM, Schmidt CJ, et al. Measurement of human myocardial perfusion by double-gated flow alternating inversion recovery EPI. Magnetic Resonance in Medicine 1999;41:510–519.
5. Lau AZ, Tunnicliffe EM, Frost R, Koopmans PJ, Tyler DJ, Robson MD. Accelerated human cardiac diffusion tensor imaging using simultaneous multislice imaging: Multiband Human Cardiac Diffusion Tensor Imaging. Magnetic Resonance in Medicine 2015;73:995–1004.
6. Do HP, Yoon AJ, Fong MW, Saremi F, Barr ML, Nayak KS. Double‐gated myocardial ASL perfusion imaging is robust to heart rate variation. Magnetic Resonance in Medicine 2017;77:1975–1980.
7. Alley MT, Pauly JM, Sommer FG, Pelc NJ. Angiographic Imaging with 2D RF Pulses. Magnetic Resonance in Medicine 1997;37:260–267.
8. Javed A, Jao TR, Nayak, Krishna. Velocity Sensitivity of Inner-Volume Cardiac Echo Planar Imaging. In: ISMRM 26th Scientific Session. Paris; 2018. p. 4240.
9. Jao TR, Nayak KS. Demonstration of velocity selective myocardial arterial spin labeling perfusion imaging in humans: Demonstration of Velocity Selective Myocardial Arterial Spin Labeling Perfusion Imaging in Humans. Magnetic Resonance in Medicine 2018;80:272–278.
10. Uecker M, Lai P, Murphy MJ, et al. ESPIRiT-an eigenvalue approach to autocalibrating parallel MRI: Where SENSE meets GRAPPA. Magnetic Resonance in Medicine 2014;71:990–1001.
11. Robson PM, Grant AK, Madhuranthakam AJ, Lattanzi R, Sodickson DK, McKenzie CA. Comprehensive quantification of signal‐to‐noise ratio and g‐factor for image‐based and k‐space‐based parallel imaging reconstructions. Magnetic Resonance in Medicine 2008;60:895–907.
12. Javed A, Jao TR, Nayak KS. Motion correction facilitates the automation of cardiac ASL perfusion imaging. Journal of Cardiovascular Magnetic Resonance 2015;17:1–2.
13. Roux PL, Nishimura D, Macovski A. Parameter Relations for the Shinnar-Le Roux Selective Excitation Pulse Design Algorithm. IEEE Transactions on Medical Imaging 1991;10:53–65.
Figures