1308
Deep learning Assisted Radiological reporT (DART)1Biomedical Engineering, Columbia University, New York, NY, United States, 2Columbia Magnetic Resonance Research Center, Columbia University, New York, NY, United States, 3MediYantri Inc., Palatine, IL, United States, 4Columbia University Irving Medical Center, New York, NY, United States
Synopsis
A 2015 survey indicates that burnout of radiologists was seventh highest among all physicians. In this work, two neural networks are designed and trained to generate text-based first read radiology reports. Existing tools are leveraged to perform registration and then brain tumour segmentation. Feature vectors are constructed utilising the information extracted from the segmentation masks. These feature vectors are fed to the neural networks to train against a radiologist’s reports on fifty subjects. The neural networks along with image statistics are able to characterise tumour type, mass effect and edema and report tumour volumetry; compiled as a first-read radiology report.
Introduction
A 2015 survey indicates that burnout of radiologists was seventh highest among all physicians (1). Other national surveys report among the highest career dissatisfaction of any medical specialty (2). In this work we introduce a tool that streamlines the image-to-text workflow for reporting on brain tumours. Existing methods are leveraged to register the brain volume image and segment the tumour and construct a feature vector. This feature vector is utilised to train two neural networks to generate a text-based first read radiology report.Methods
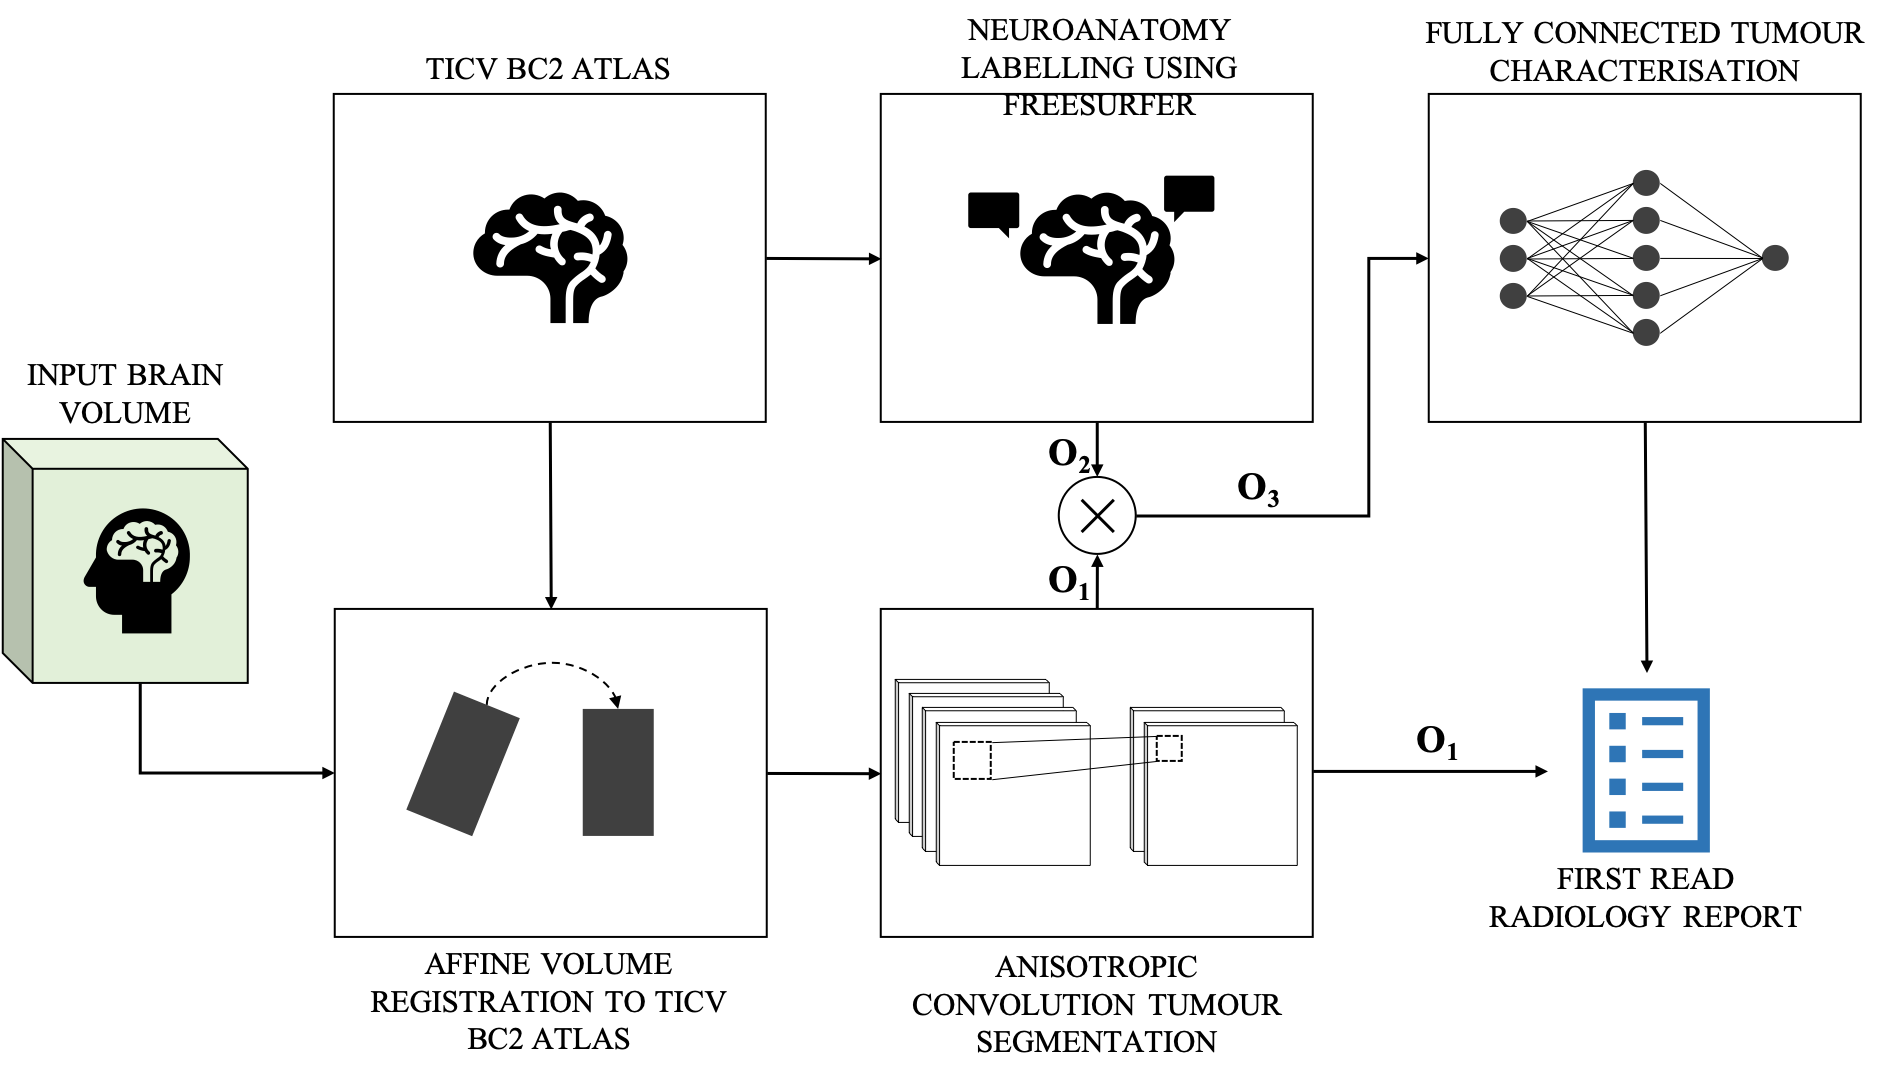
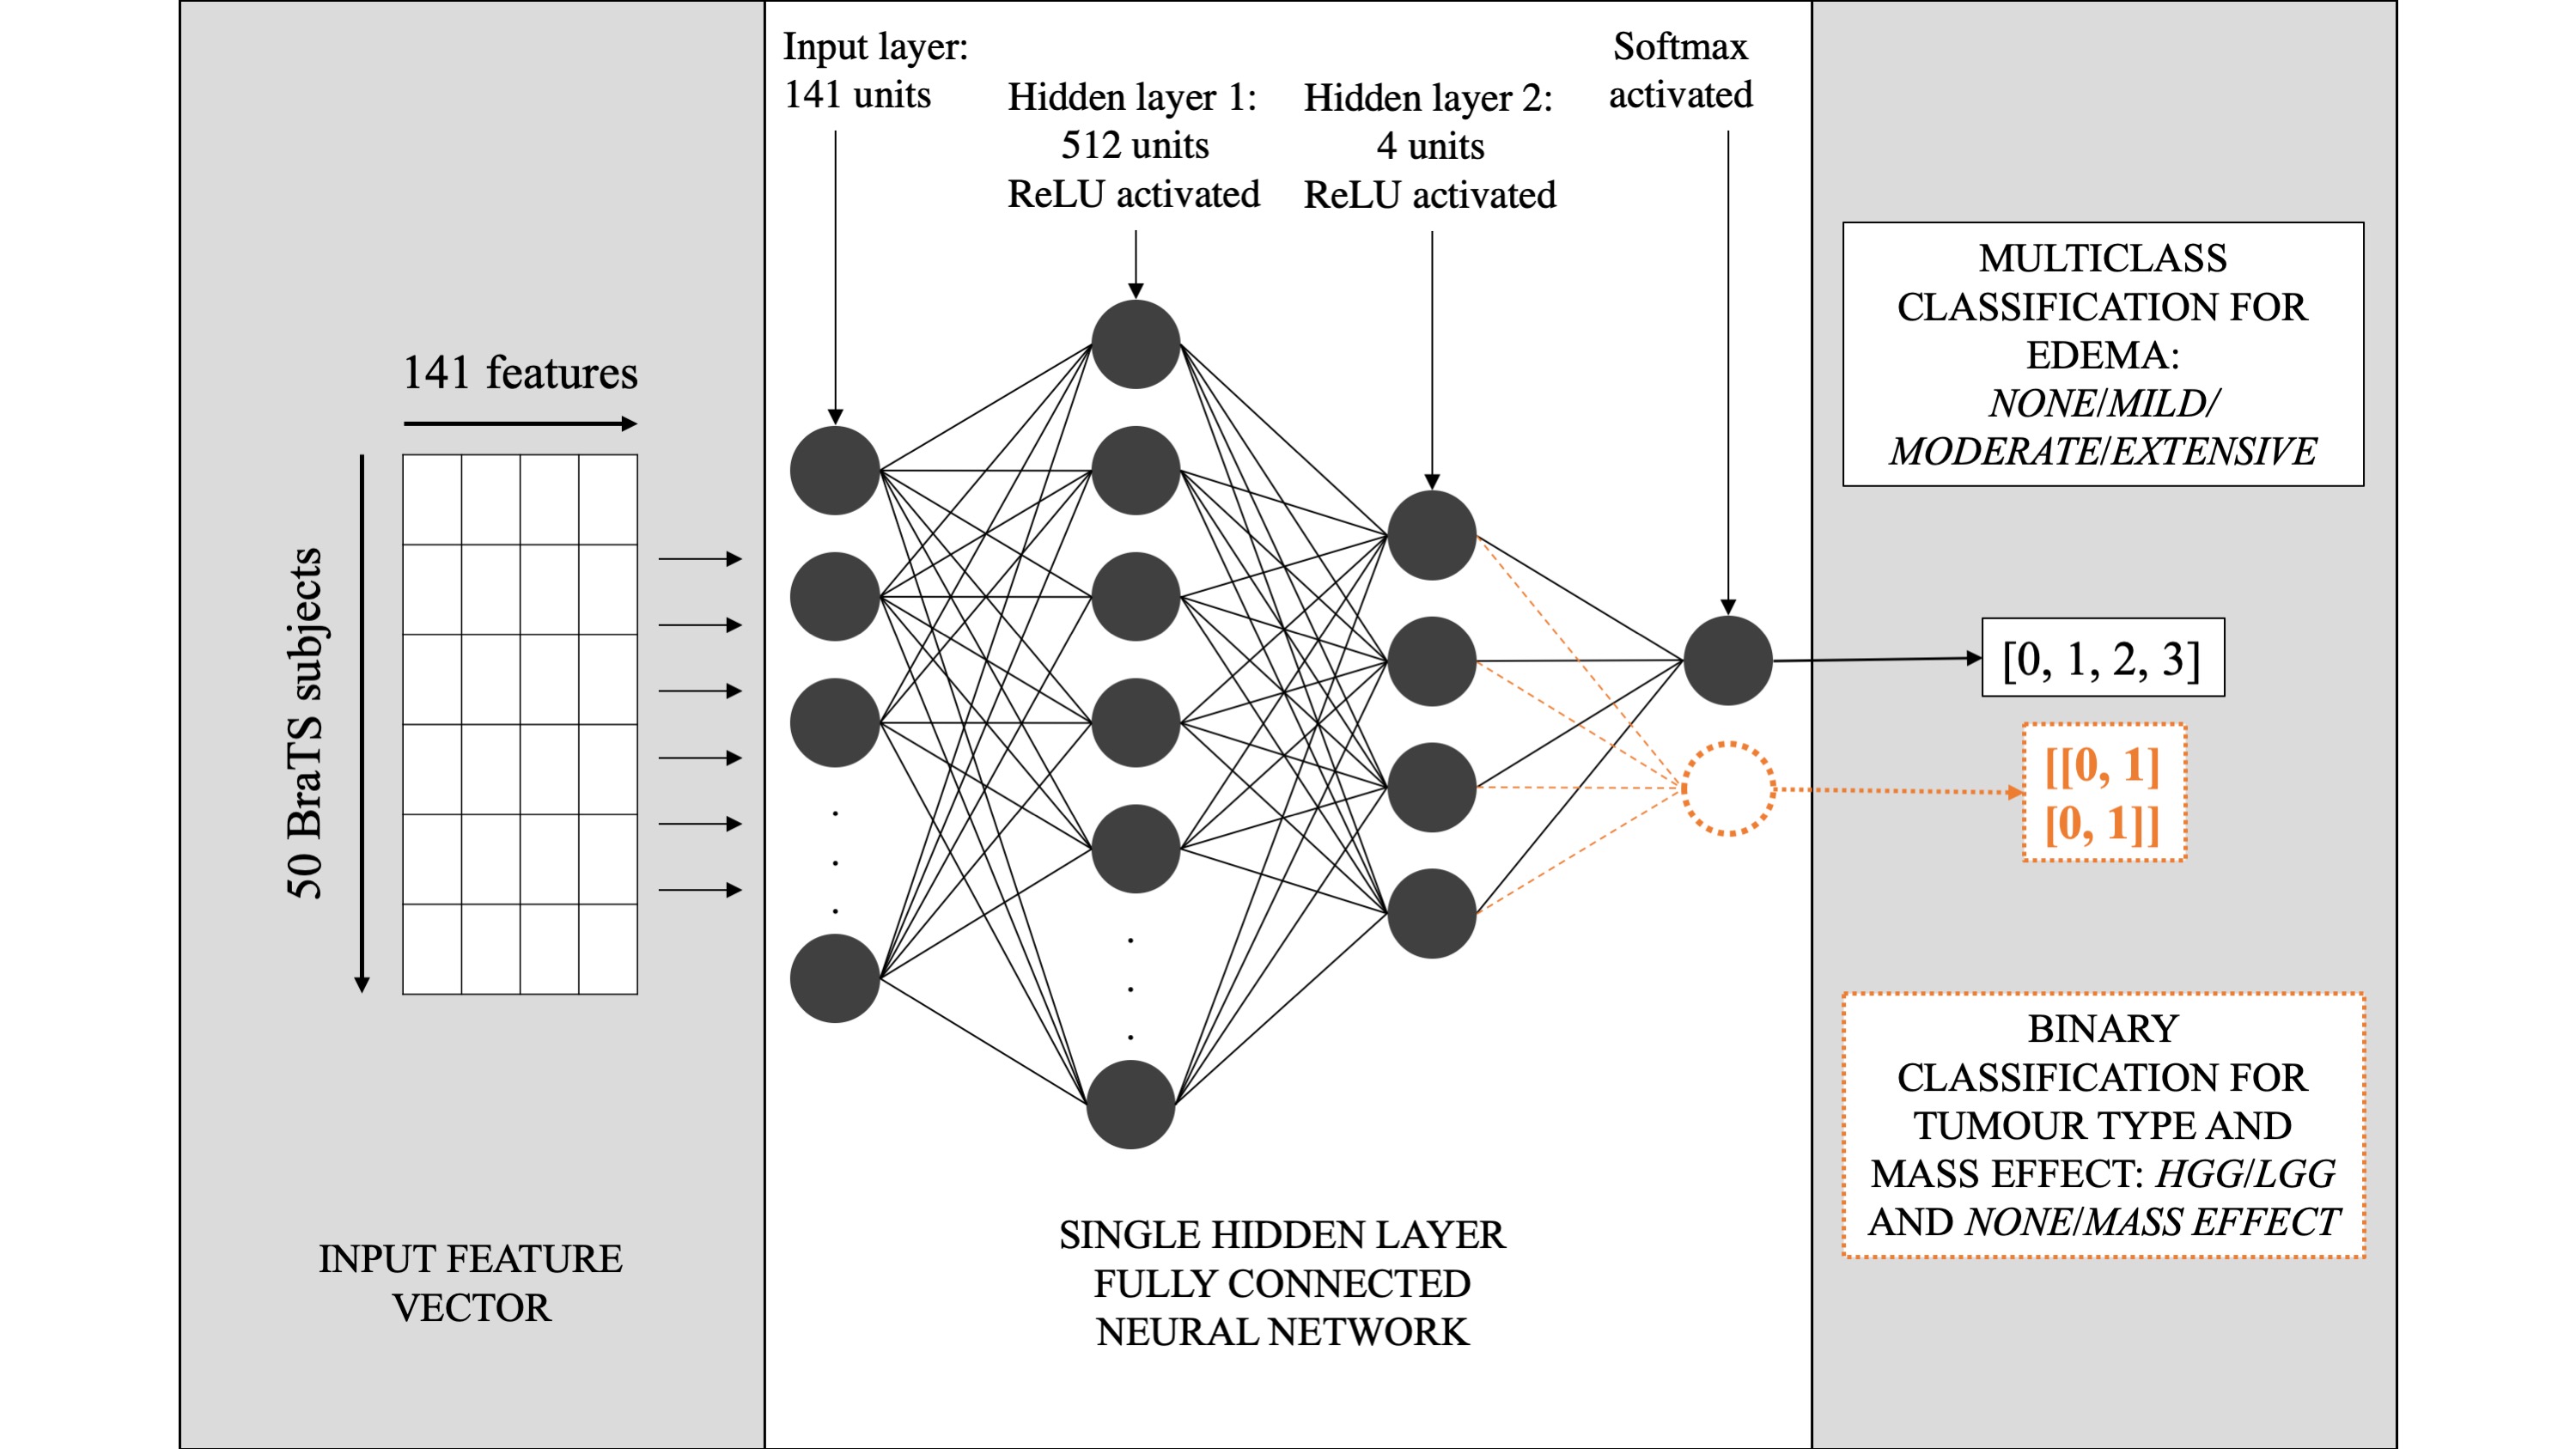
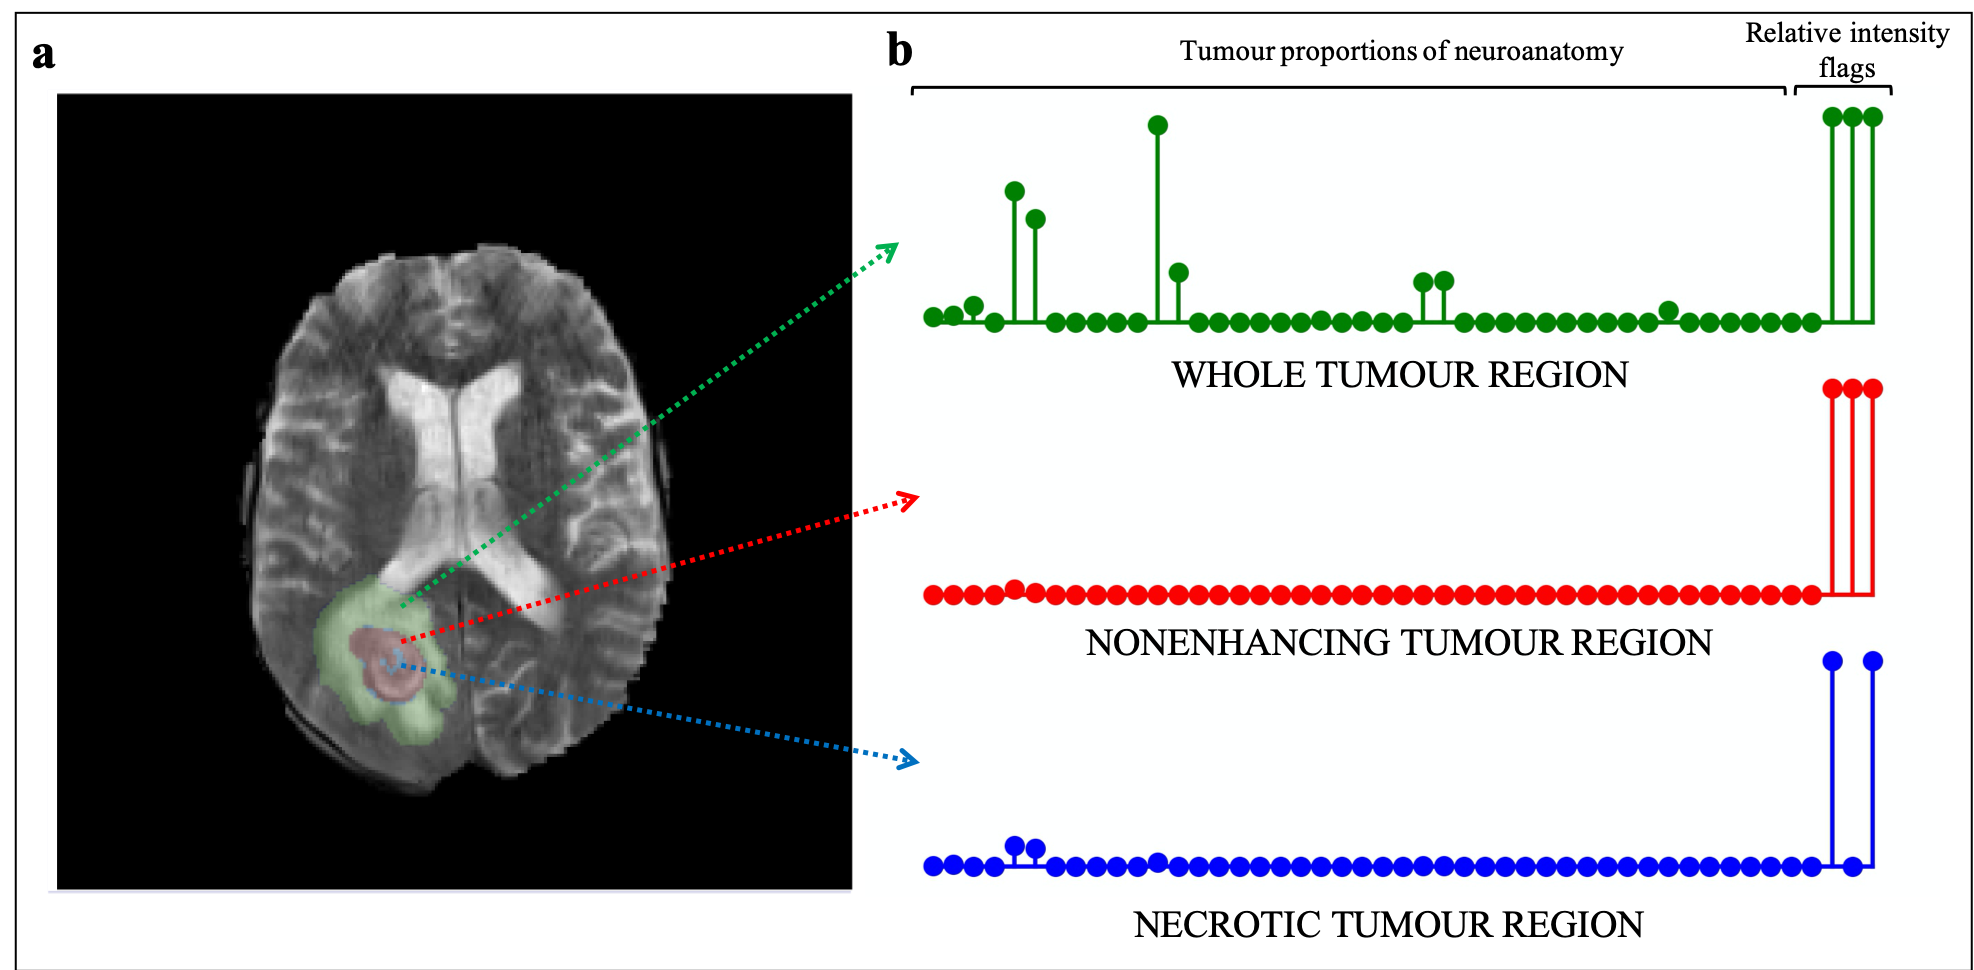
The overall process of producing a radiology report can be distilled to three steps: identifying, localising and characterising the tumour. For this work, the workflow to generate a text-based first read radiology report based on an input brain volume was designed similarly (Figure 1). Existing tools were leveraged to perform volume registration and tumour segmentation. A fully connected neural network was designed to perform tumour characterisation. Brain tumour segmentation dataset from MICCAI’s Brain Tumour Segmentation Challenge 2018 (3, 4, 5) was utilised, referred to as the ‘BraTS dataset’. This dataset consisted of brain volumes of 285 subjects (T1, T1 contrast enhanced, T2 FLAIR and DWI). One brain atlas was randomly chosen from the Total Intracranial Vault (TICV) BC2 Atlases dataset (6) and every BraTS subject was registered against this atlas. The affine volume registration was performed using the SimpleITK Python library (7). Brain tumour segmentation was performed on this registered-BraTS subject leveraging a pretrained network by Wang et al. (8). Automatic neuroanatomy labelling was performed on the chosen atlas using the FreeSurfer software (9). Based on the neuroanatomy labels and segmentation masks, each tumour region was localised and proportions of the neuroanatomy occupied by each tumour region was computed. The segmentation masks were also leveraged to perform tumour volumetry and derive flags that indicate whether each tumour region was hypointense of hyperintense in each contrast. These values were combined to generate a single-dimensional feature vector of size 141. Two single hidden layer fully connected neural networks were trained, one to predict tumour type and mass effect and the other to predict edema respectively (Figure 2). Predicting tumour type and mass effect were binary classification tasks while predicting edema was a multiclass classification task. Reports were produced by a radiologist for fifty BraTS subjects (25 high-grade gliomas/25 low-grade gliomas). The networks were trained for 100 epochs (Adam optimiser (8)) on pairs of feature vectors and keywords describing mass effect and edema extracted from the reports, on an Apple MacBook Pro 2015. Leave-one-out training was performed because of the small size of the training dataset. The class predictions obtained from the two neural networks were utilised to generate a text-based first read report. Finally, the binary/multiclass predictions from the neural networks were mapped to keywords and a text-based first read report was generated.Results
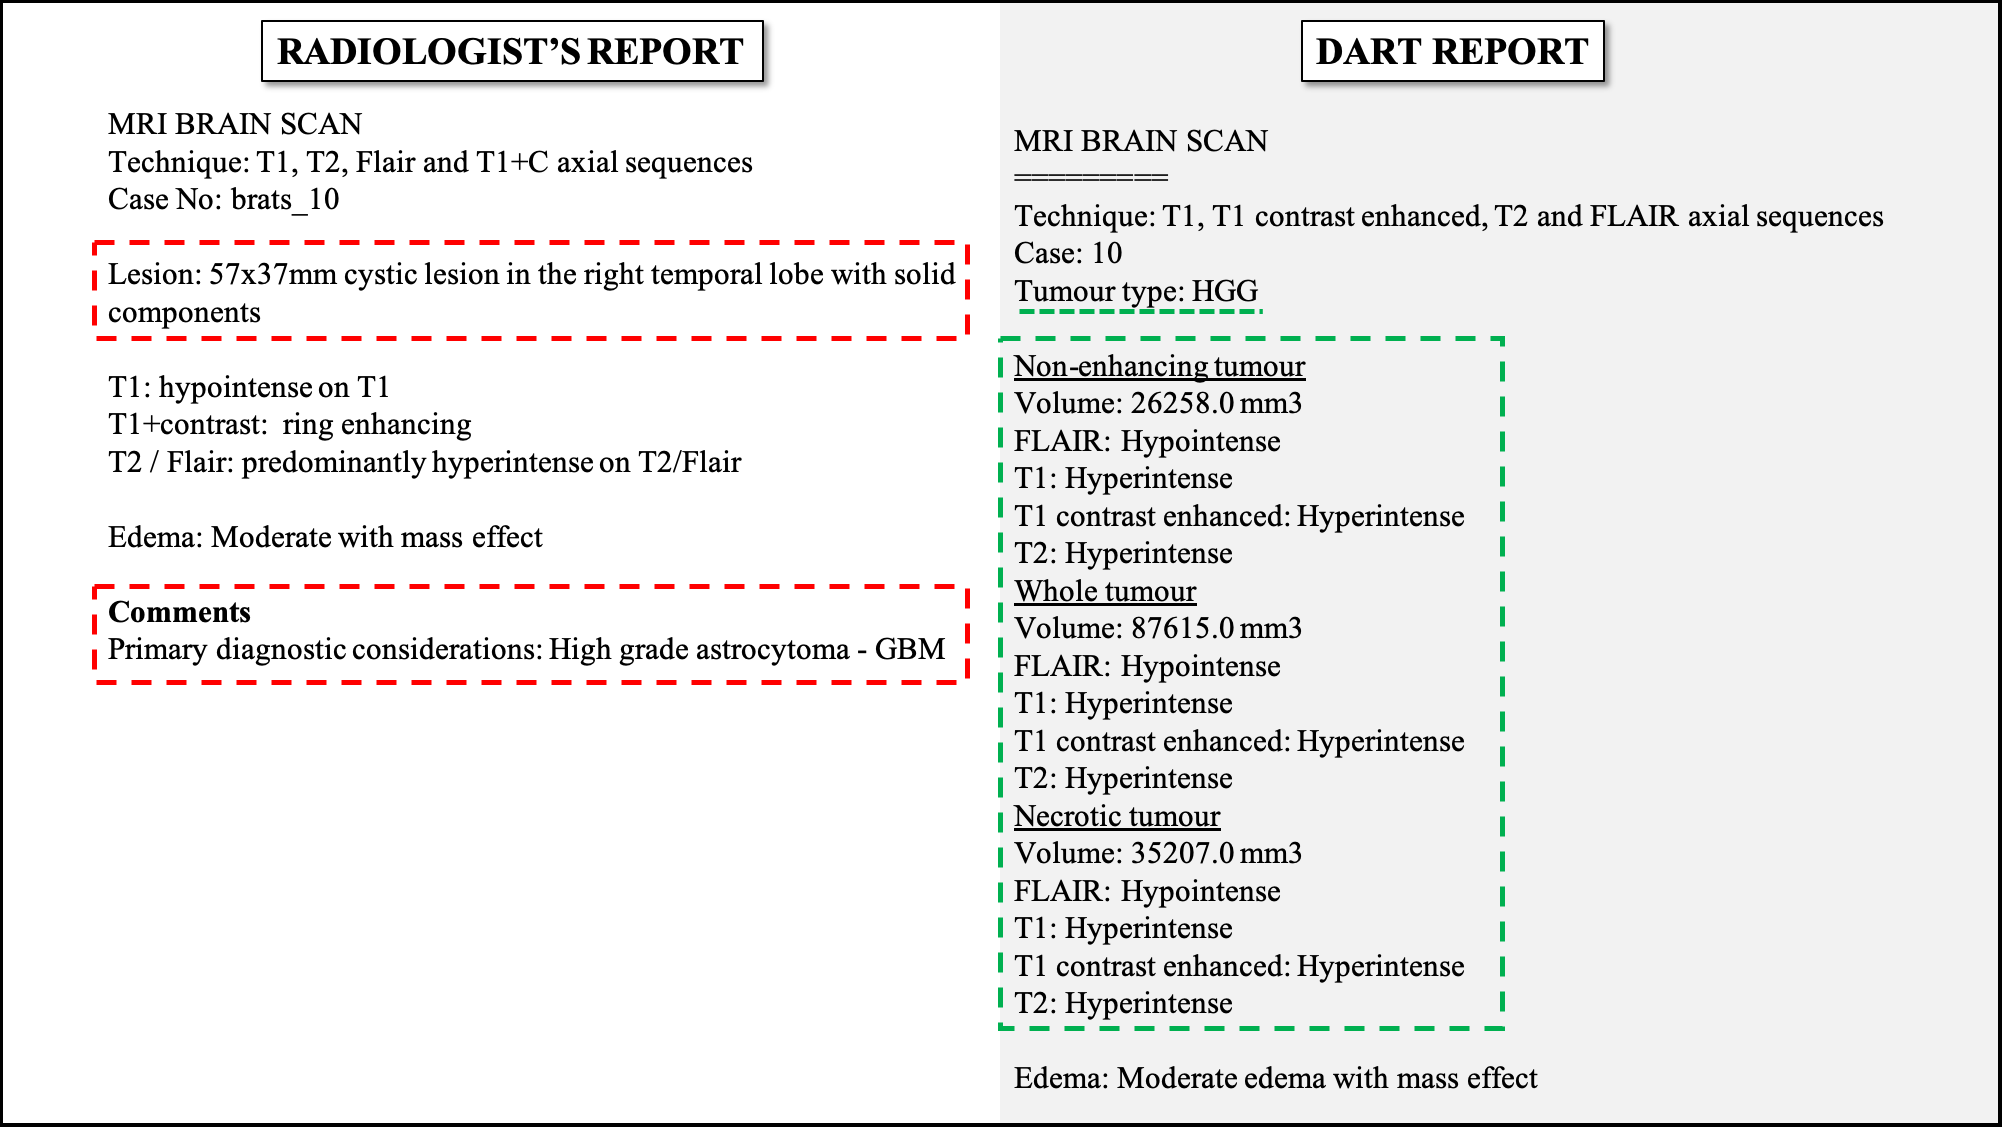
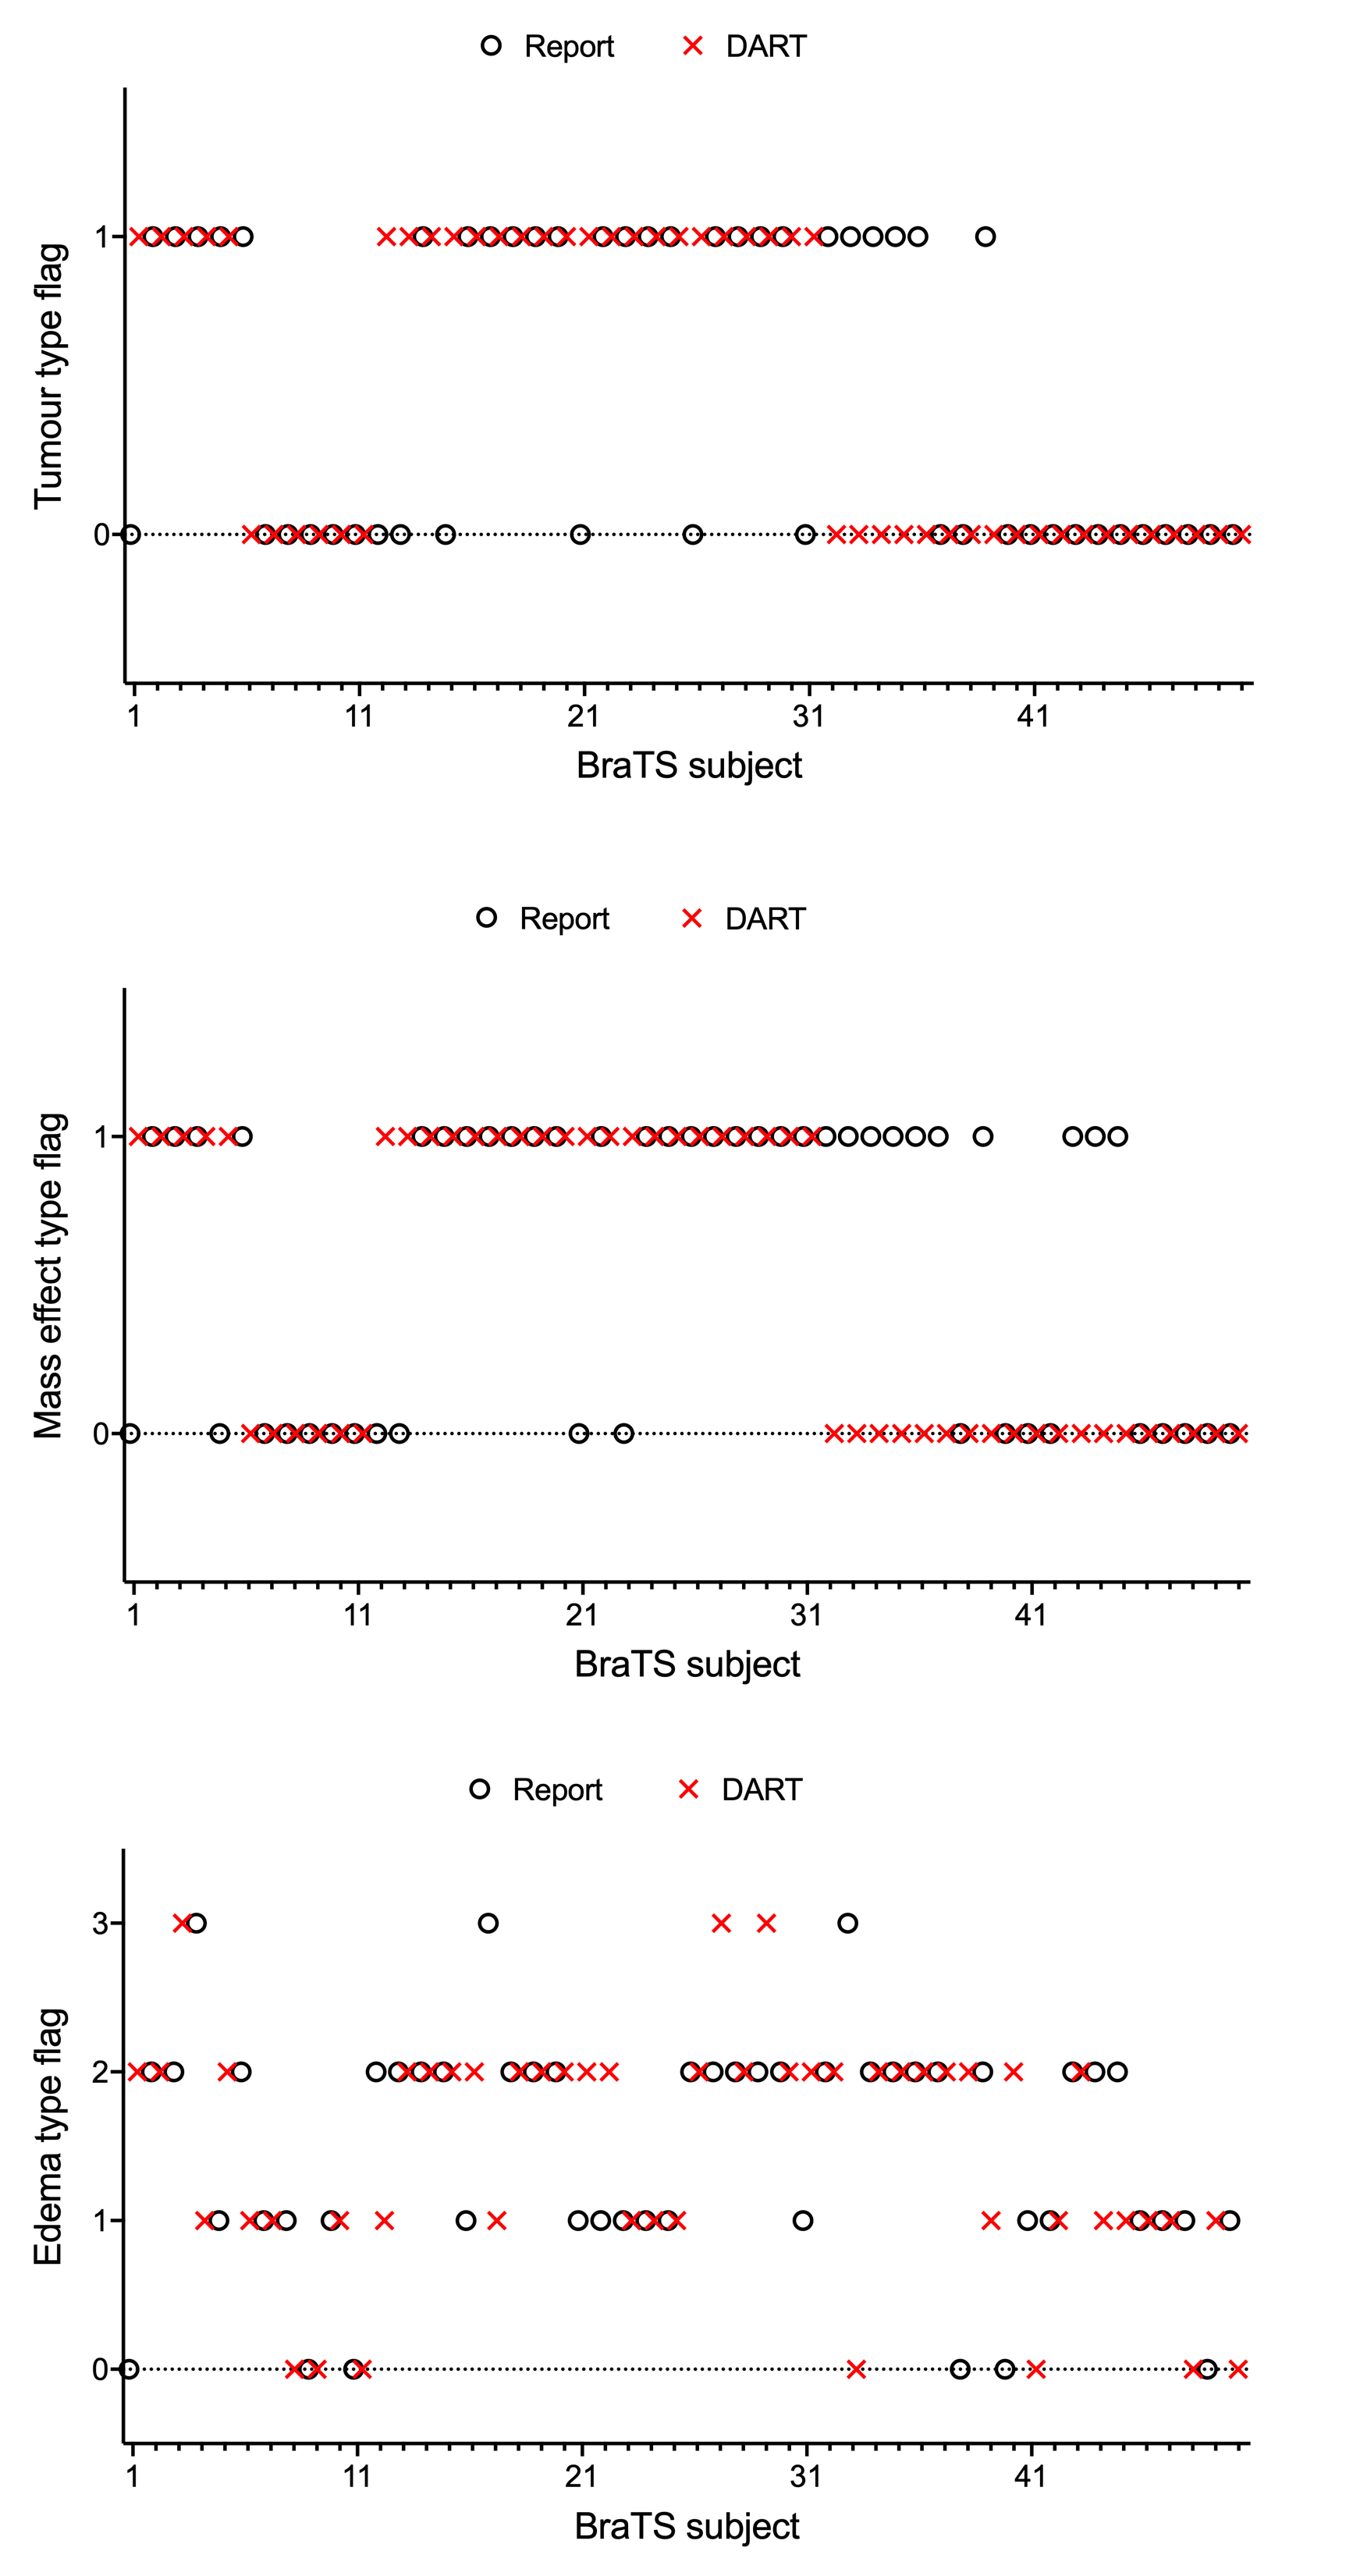
The affine volume registration using the FreeSurfer software was completed in approximately 12 hours. The tumour segmentation using the pretrained anisotropic convolution network required approximately 4 minutes per subject. The binary classification and multi-class classification models were trained to 96.5% and 89% accuracies in 15.1 and 14.6 seconds respectively. Figure 3 is a comparison of one report produced by a radiologist versus the DART report for the same BraTS subject. Information present exclusively in the radiologist’s and DART’s reports are highlighted in red and green respectively. In this work, DART does not generate descriptive outputs while characterising the tumours. Figure 5 is a graph comparing DART’s predictions for tumour type, mass effect and edema with the radiologist’s reports for fifty BraTS subjects.Discussion
Figure 5 shows multiple misclassifications in predicting tumour type, mass effect and edema. This can be attributed to the small size of the training dataset. Future work involves incorporating natural language processing or deep learning based image captioning methods to generate descriptive reports. Further, rapid registration can be performed by leveraging in-house or existing deep learning based volume registration tools. Validation of this work by radiologists will be necessary.Conclusion
An automated image-to-report workflow was setup that accepted Nifti brain volume input and generated a text-based first read radiology report. The two neural networks were trained to 93.5% and 89% accuracies for predicting tumour type and mass effect, and edema respectively. The end-to-end process was designed in a manner than mimics a radiologist’s process of identifying, localising and characterising the tumour. The first-read report can help in increasing the throughput of radiology report writing.Acknowledgements
1. Zuckerman Institute Technical Development Grant for MR, Zuckerman Mind Brain Behavior Institute,Grant Number: CU-ZI-MR-T-0002; PI: Geethanath
2. Zuckerman Institute Seed Grant for MR studies, Zuckerman Mind Brain Behavior Institute,Grant Number:CU-ZI-MR-S-0007; PI: Geethanath
References
1. Harolds, Jay A., et al. "Burnout of radiologists: frequency, risk factors, and remedies: a report of the ACR Commission on Human Resources." Journal of the American College of Radiology 13.4 (2016): 411-416.
2. Rosenkrantz, Andrew B., et al. "The reading room coordinator: reducing radiologist burnout in the digital age." Journal of the American College of Radiology 15.1 (2018): 65-68.
3. B. H. Menze, A. Jakab, S. Bauer, J. Kalpathy-Cramer, K. Farahani, J. Kirby, et al. "The Multimodal Brain Tumor Image Segmentation Benchmark (BRATS)", IEEE Transactions on Medical Imaging 34(10), 1993-2024 (2015) DOI: 10.1109/TMI.2014.2377694.
4. S. Bakas, H. Akbari, A. Sotiras, M. Bilello, M. Rozycki, J.S. Kirby, et al., "Advancing The Cancer Genome Atlas glioma MRI collections with expert segmentation labels and radiomic features", Nature Scientific Data, 4:170117 (2017) DOI: 10.1038/sdata.2017.117.
5. S. Bakas, M. Reyes, A. Jakab, S. Bauer, M. Rempfler, A. Crimi, et al., "Identifying the Best Machine Learning Algorithms for Brain Tumor Segmentation, Progression Assessment, and Overall Survival Prediction in the BRATS Challenge", arXiv preprint arXiv:1811.02629 (2018).
6. Yuankai Huo, Andrew J. Asman, Andrew J. Plassard, Bennett A Landman “Simultaneous total intracranial volume and posterior fossa volume estimation using multi-atlas label fusion” Human Brain Mapping, 2016.
7. Lowekamp, Bradley Christopher, et al. "The design of SimpleITK." Frontiers in neuroinformatics 7 (2013): 45.
8. Wang, Guotai, et al. "Automatic brain tumor segmentation using cascaded anisotropic convolutional neural networks." International MICCAI Brainlesion Workshop. Springer, Cham, 2017.
9. Fischl, Bruce. "FreeSurfer." Neuroimage 62.2 (2012): 774-781.
10. Kingma, Diederik P., and Jimmy Ba. "Adam: A method for stochastic optimization." arXiv preprint arXiv:1412.6980 (2014).
Figures