1307
Clinical performance of reduced gadolinium dose for contrast-enhanced brain MRI using deep learning1Radiology, Beijing Tiantan Hospital, Beijing, China, 2Subtle Medical Inc, Menlo Park, CA, United States
Synopsis
The reported gadolinium deposition phenomenon has caused extensive concern in the radiology community. This study focuses on validating the clinical performance of a proposed deep learning architecture which can significantly reduce the dosage of gadolinium-based contrast agents (GBCA) in brain MRI. The results suggest that the synthesized contrast images using deep learning with reduced GBCA dose can maintain its diagnostic quality under certain clinical circumstances.
Introduction
The usage of gadolinium-based contrast agents (GBCA) in MRI exams has raised increasing concern because of the reported gadolinium deposition 1-3. The latest research using deep learning (DL) has shown great promise to significantly reduce the dosage of GBCAs and achieve similar image quality 4. Initial assessment of the DL methods for GBCA dose reduction has focused on qualitative image quality. While important, this evaluation does not completely reflect the diagnostic performance in actual clinical settings. In this study, we apply DL to reduce GBCA dosage for brain MRI exams and focus on the clinical performance evaluation of the DL method. This study provides better understanding of the readiness and limitation of the DL method applied in clinics.Methods
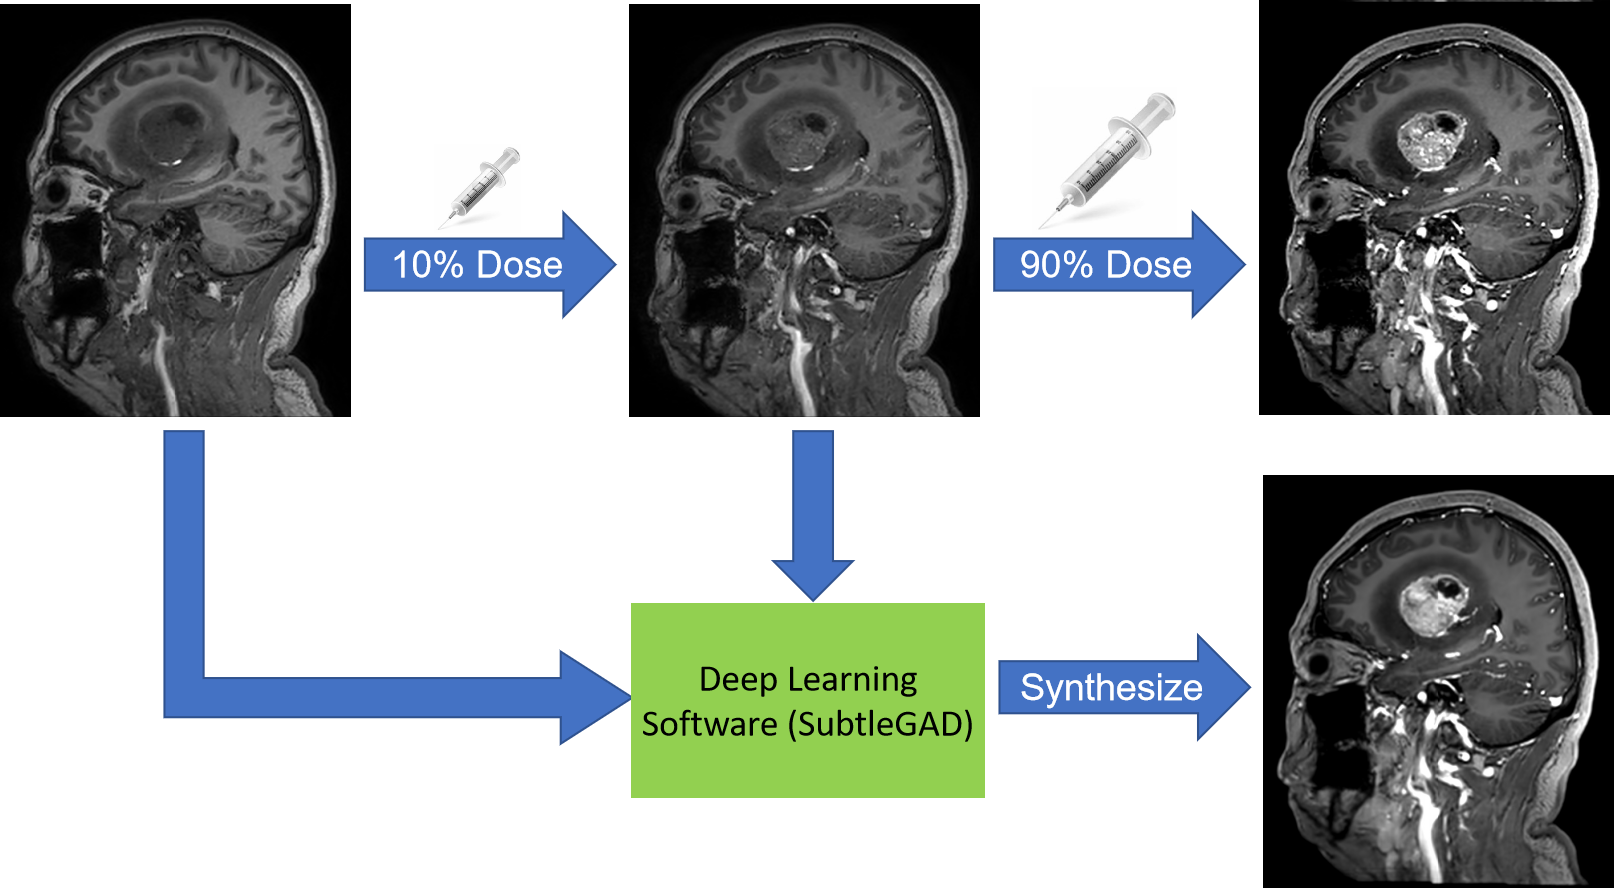
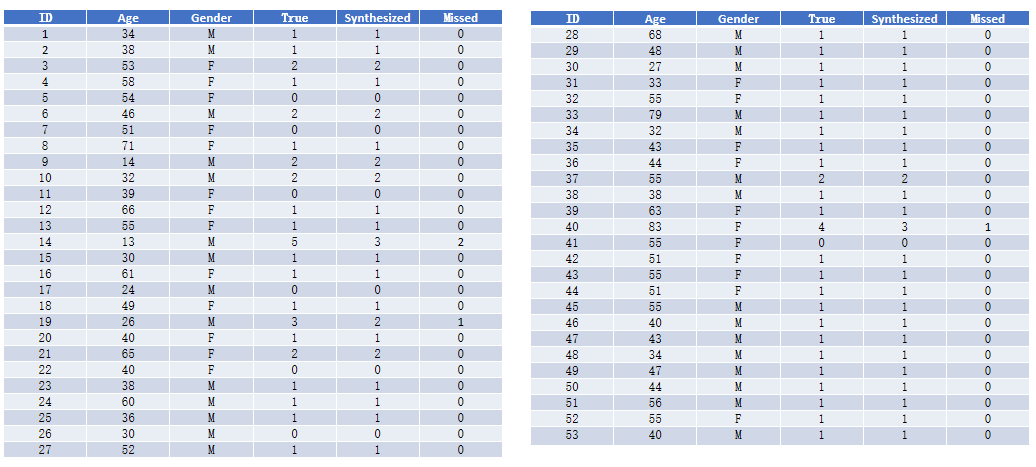
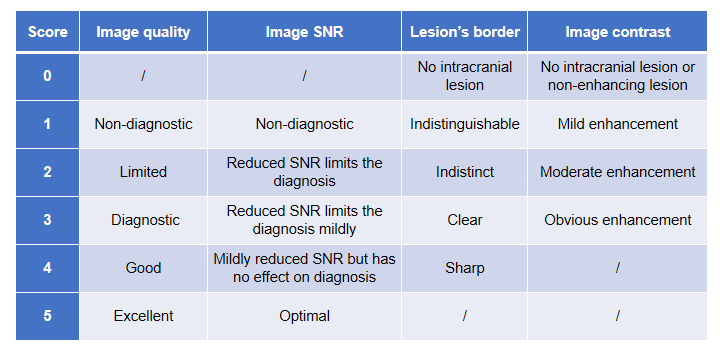
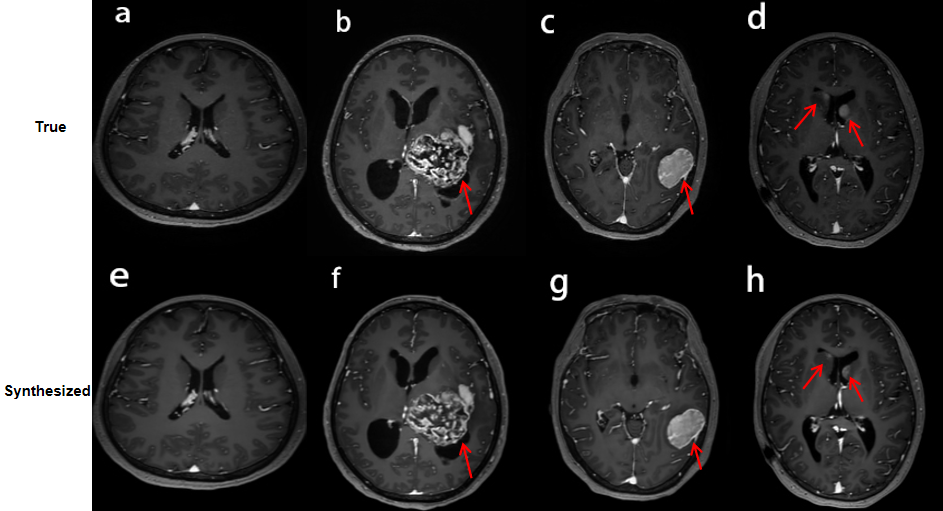
With IRB approval and patient consent, we collected a total of 73 consecutive patients undergoing contrast-enhanced brain MRI with Gadoteric Acid Meglumine Salt (15ml) and mixed clinical indications, including normal, tumor, and arachnoid cyst. Three 3D T1-weighted images were acquired on a Philips Ingenia 3.0T CX scanner (TR/TE 6.6/3.0; Voxel 1x1x1mm3; FOV 240x240x196 mm3; scan time 2:19 ) in one scan session with the following GBCA dose levels: zero-dose, low-dose (10%; approximately 2ml) GBCAs and full-dose (100%) GBCAs. The first 20 cases were used to train a deep learning model which can synthesize the full-dose contrast images from the zero-dose and low-dose image pairs4. The remaining 53 cases were used for testing using the research software SubtleGAD (Subtle Medical Inc, Menlo Park, CA). Detailed illustration of the workflow was shown in Figure 1. The DL-synthesized full-dose images were compared with the true full-dose images for quantitative and qualitative analysis. The quantitative metrics consisted of peak SNR (PSNR) and structural similarity index (SSIM). Qualitative assessments by two board-certified radiologists were performed to evaluate the diagnostic agreement between DL and true full-dose images. The evaluation criteria, including image quality, SNR, lesion boarder, and image contrast, are presented in Table 3. To evaluate the accuracy of detecting lesions, readers were requested to indicate the lesion number and the location for each case. Inter-reader reliability was analyzed using Cohen’s Kappa coefficients.Results
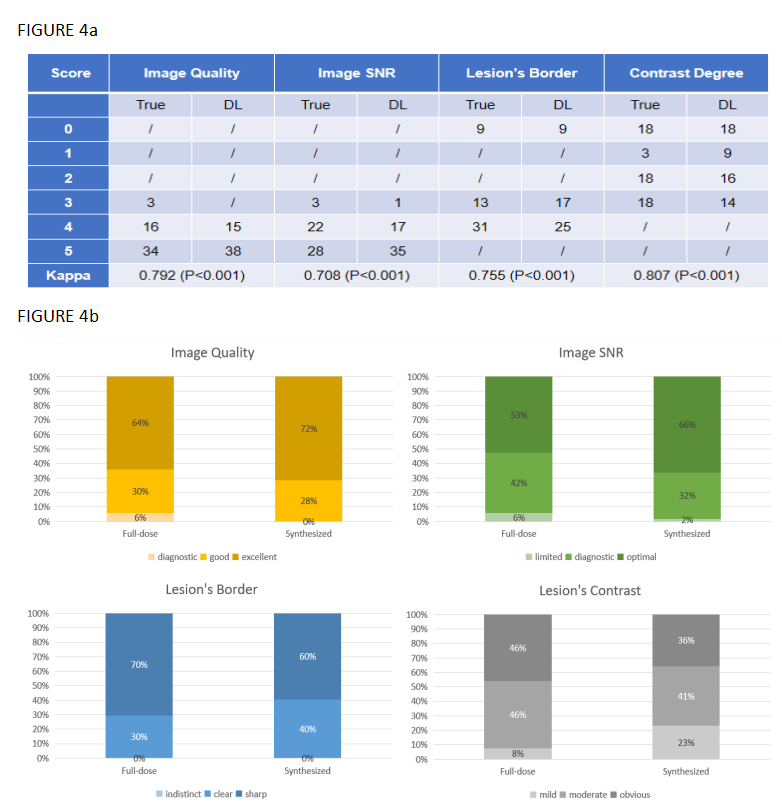
The patient demographics and the number of lesions detected from two images are shown in Table 2. The clinical findings perfectly matched in 50 out of 53 cases. For 3 cases, the number of detected lesions was reduced with DL. Representative cases are shown in Figure 5. The average PSNR and SSIM were 25.50+/-1.66 and 0.85+/-0.05, respectively. The comparison and statistics between true and synthesized images are shown in Figure 4. The coefficients range from 0.708 to 0.807, indicating good levels of agreement on all criteria. Slightly better image quailty and image SNR was noted in the synthesized images. Compared to true full-dose images, the synthesized images have a slight but not significant reduction in lesion’s border and lesion’s contrast.Discussion
In this study, the DL-synthesized full-dose images present similar image quality and close diagnostic performance when compared with the true full-dose images. All the cases can be separated into 3 groups: normal (n=7), single lesion (n=37) and multiple lesions (n=9). Notedly, there is no false positive in the DL images, which is an important finding. Except that 3 cases of multiple (n≥3) lesions did not fully capture 1-2 minor lesions with mild enhancement, all the lesions were detected accurately. This suggests that the DL method is promising in various clinical settings. With further algorithm improvement, it is likely that DL can enable low-dose contrast-enhanced MRI exams in actual clinical settings.Conclusion
In this study, we analyzed the clinical performance of DL for significant dose reduction in GBCA-based contrast enhanced exams. This study results suggest that the image quality of DL images can satisfy the needs of routine diagnosis under certain clinical settings.Acknowledgements
References
1. McDonald Robert J,McDonald Jennifer S,Kallmes David F et al. Intracranial Gadolinium Deposition after Contrast-enhanced MR Imaging.[J] .Radiology, 2015, 275: 772-82.2.
2.McDonald Robert J,McDonald Jennifer S,Kallmes David F et al. Gadolinium Deposition in Human Brain Tissues after Contrast-enhanced MR Imaging in Adult Patients without Intracranial Abnormalities.[J] .Radiology, 2017, 285: 546-554.3.
3.Mallio Carlo A,Lo Vullo Gianguido,Messina Laura et al. Increased T1 Signal Intensity of the Anterior Pituitary Gland on Unenhanced Magnetic Resonance Images After Chronic Exposure to Gadodiamide.[J] .Invest Radiol, 2019, undefined: undefined.
4. Gong Enhao,Pauly John M,Wintermark Max et al. Deep learning enables reduced gadolinium dose for contrast-enhanced brain MRI.[J] .J Magn Reson Imaging, 2018, 48: 330-340.
Figures