1305
Deep Learning Segmentation of Lenticulostriate Arteries on 3D Black Blood MRI1University of Southern California, Los Angeles, CA, United States
Synopsis
Cerebral small vessels are largely inaccessible to existing clinical in vivo imaging technologies. As such, early cerebral microvascular morphological changes in small vessel disease (SVD) are difficult to evaluate. A deep learning (DL)-based algorithm was developed to automatically segment lenticulostriate arteries (LSAs) in 3D black blood images acquired at 3T. Using manual segmentations as supervision, 3D segmentation of LSAs is demonstrated to be feasible with relatively high performance and can serve as a useful tool for quantitative morphometric analysis in patients with cerebral SVD.
Purpose
Early cerebral microvascular changes in small vessel disease (SVD) are difficult to evaluate because cerebral small vessels are largely inaccessible to existing clinical in vivo imaging technologies. The morphology of the lenticulostriate arteries (LSAs) can provide insight into the degenerative processes of SVD; however, these vessels are difficult to visualize and segment from clinical MRI images at 3T. We recently proposed a “black-blood” MRI technique to visualize LSAs with sub-millimeter spatial resolution using 3D turbo spin echo with variable flip angles (T1w-VFA-TSE) at standard clinical field strength of 3T1. Previously, the segmentation of LSAs required manual tracing of the maximum intensity projection images derived from Time-of-Flight angiography acquired at 7T. In this study, we developed and evaluated a deep learning (DL)-based algorithm to semi-automatically segment the LSAs from the 3D T1w-VFA-TSE (black blood) images acquired at 3T.Methods
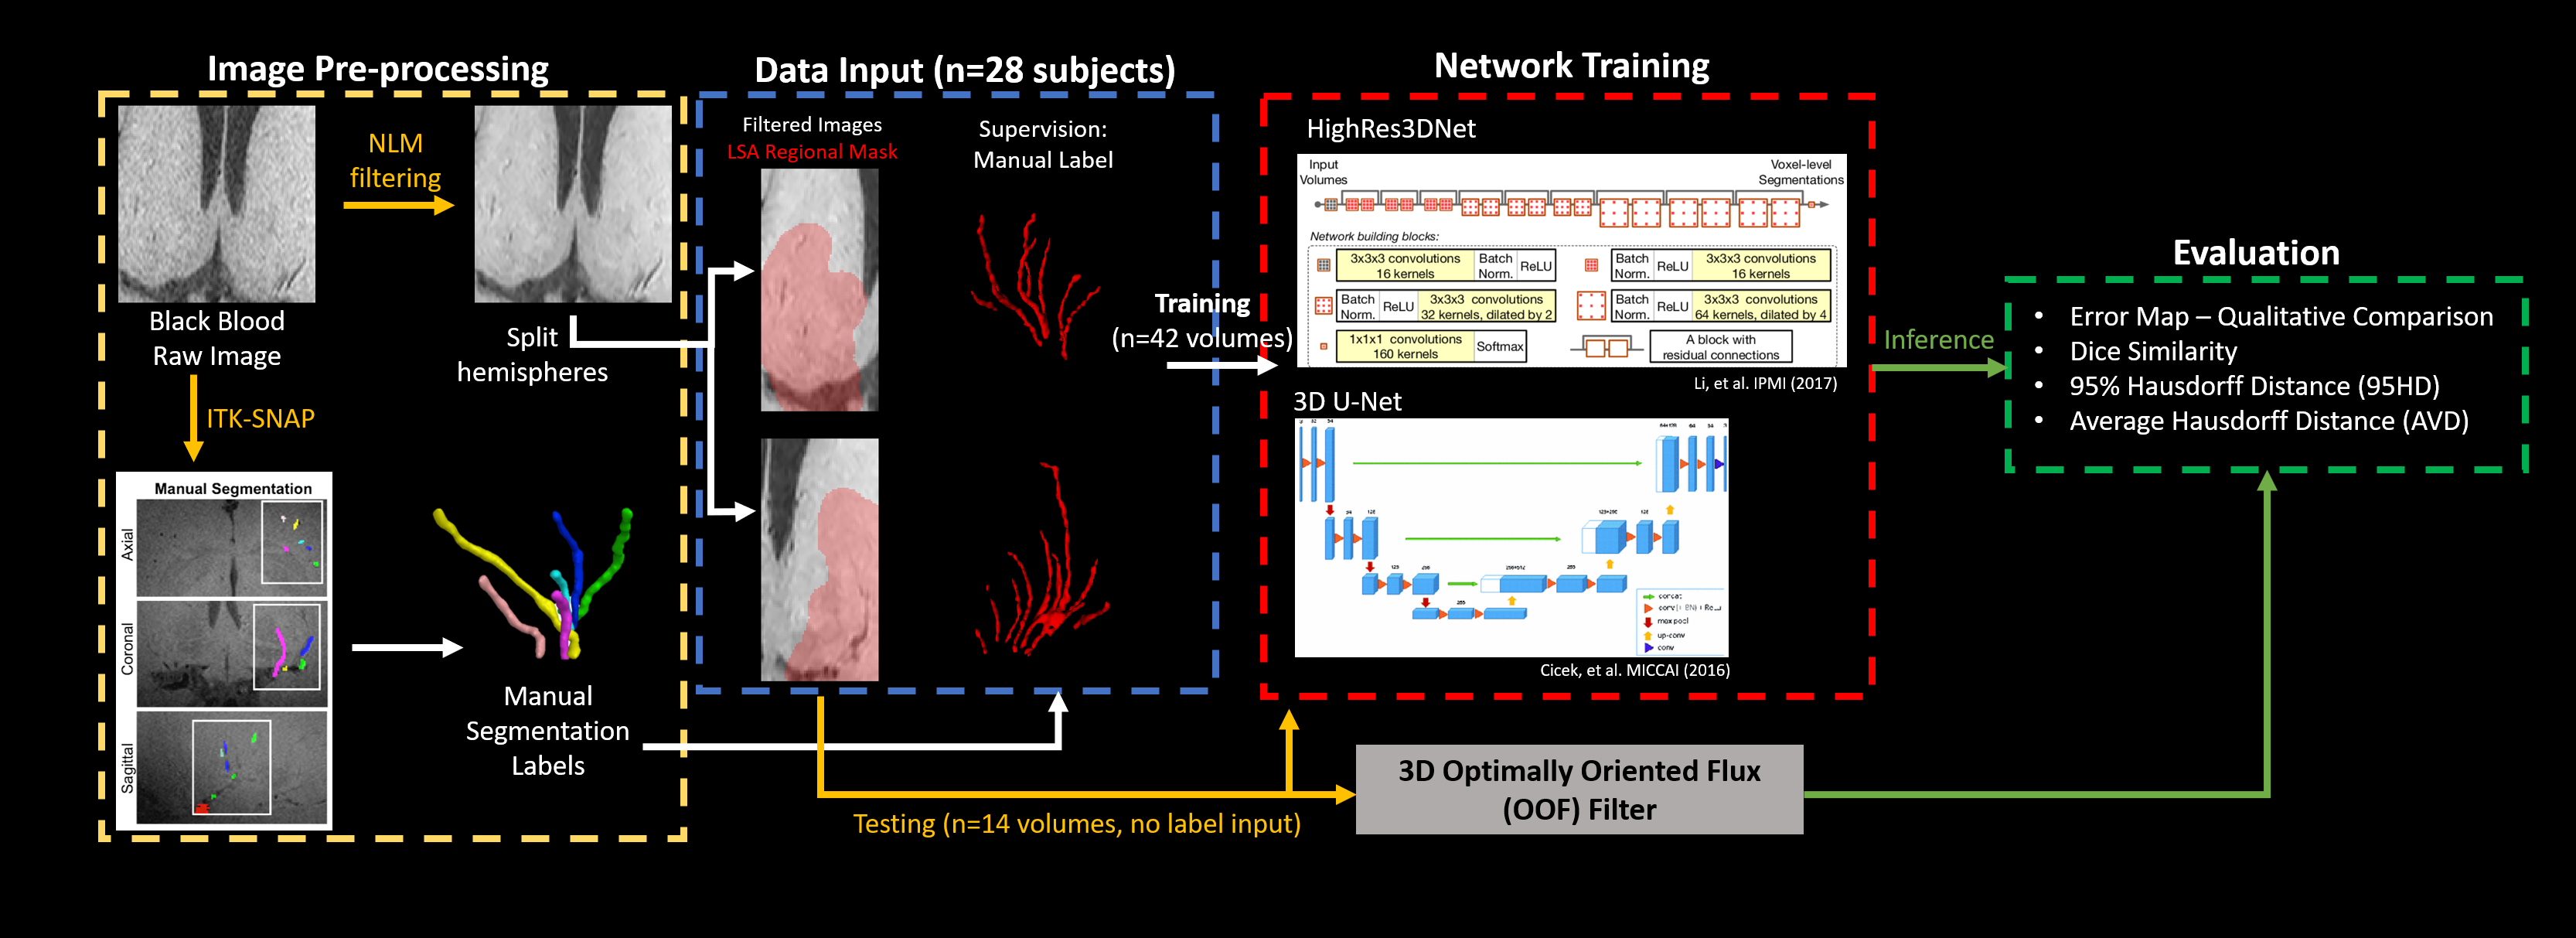
The flowchart of the experiment is shown in Figure 1, including modules of pre-processing, data input, DL model architecture, and evaluation.Data acquisition and processing
Black blood MRI images were collected from 28 participants (18 female, 49.6±19.8 years, age range [22,78]) using a Siemens 3T Prisma scanner [Siemens Healthcare, Erlangen, Germany] with a 32-channel head coil. The “black blood” contrast was attained using an optimized T1w-VFA-TSE sequence1 with the following parameters: TR/TE=1000/12ms, turbo factor=44, matrix size=756x896, resolution=0.51x0.51x0.64mm3 interpolated to 0.3x0.3x0.5mm3, 160 sagittal slices, GRAPPA=2; TA=8:39min. Three-dimensional manual segmentation of the LSAs was performed using the paintbrush tool in ITK-SNAP2, carefully scrolling in all three views. To prepare for input into the automated segmentation models, the raw images underwent several pre-processing steps. First, the images were denoised via non-local means filtering. The filtered images were then cropped to a volume encompassing the LSAs and separated by left and right hemispheres to avoid the ventricular structures for a total of 56 image volumes. To improve the specificity of the training, an LSA regional mask was created by dilating the manual segmentation labels and taking the common covered region as the mask. The dataset was divided into a training set with 21 subjects (42 volumes) and a test set with 7 subjects (14 volumes).
Network Architecture and Training
The HighRes3DNet3 architecture with 20 layers and residual connections was adapted from and trained within the NiftyNet4 platform on 2 Nvidia GeForce GTX 1080 Ti GPUs. Black blood images and the LSA regional masks were used as input, and manual segmentation labels served as the supervision. 48x48x48 volumes (batch size=4) were randomly extracted from the 3D preprocessed images for training. Volume-level augmentation was utilized including rotation and random spatial rescaling. The training process was performed with 40,000 iterations, with Dice loss as the loss function and the Adam optimizer5 for computing graph gradients. For comparison, 3D U-Net6 with comparable configuration parameters was also tested through the NiftyNet platform. In addition, vessel segmentation was performed in MATLAB [Mathworks, Natick, MA] using 3D optimally-oriented flux (OOF)7 filtering, which relies on image gradients to estimate local vessel orientations.
Model Performance Assessment
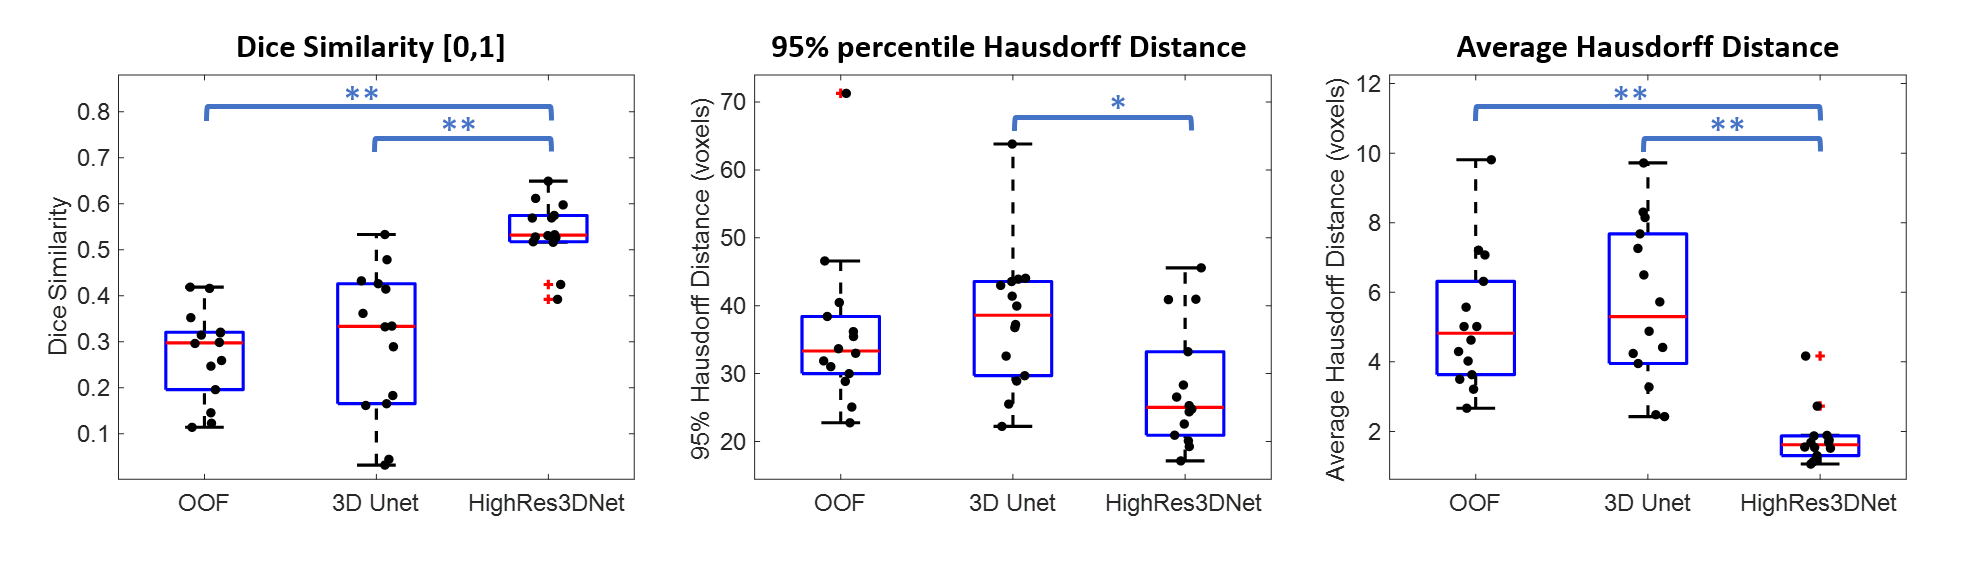
The model performance was assessed using three different measures: Dice coefficient, 95% percentile Hausdorff distance (95HD), and average Hausdorff distance (AVD)8. The 95HD and AVD metrics are resistant to outliers and represent the longest distances in voxels between two segmentation results; hence, smaller values indicate better performance. Dice coefficient ranges from [0,1] unitless values where better performance is indicated by larger values. The metrics were calculated for OOF, U-Net, and HighRes3DNet using MATLAB and the EvaluateSegmentation software9.
Results and Discussion
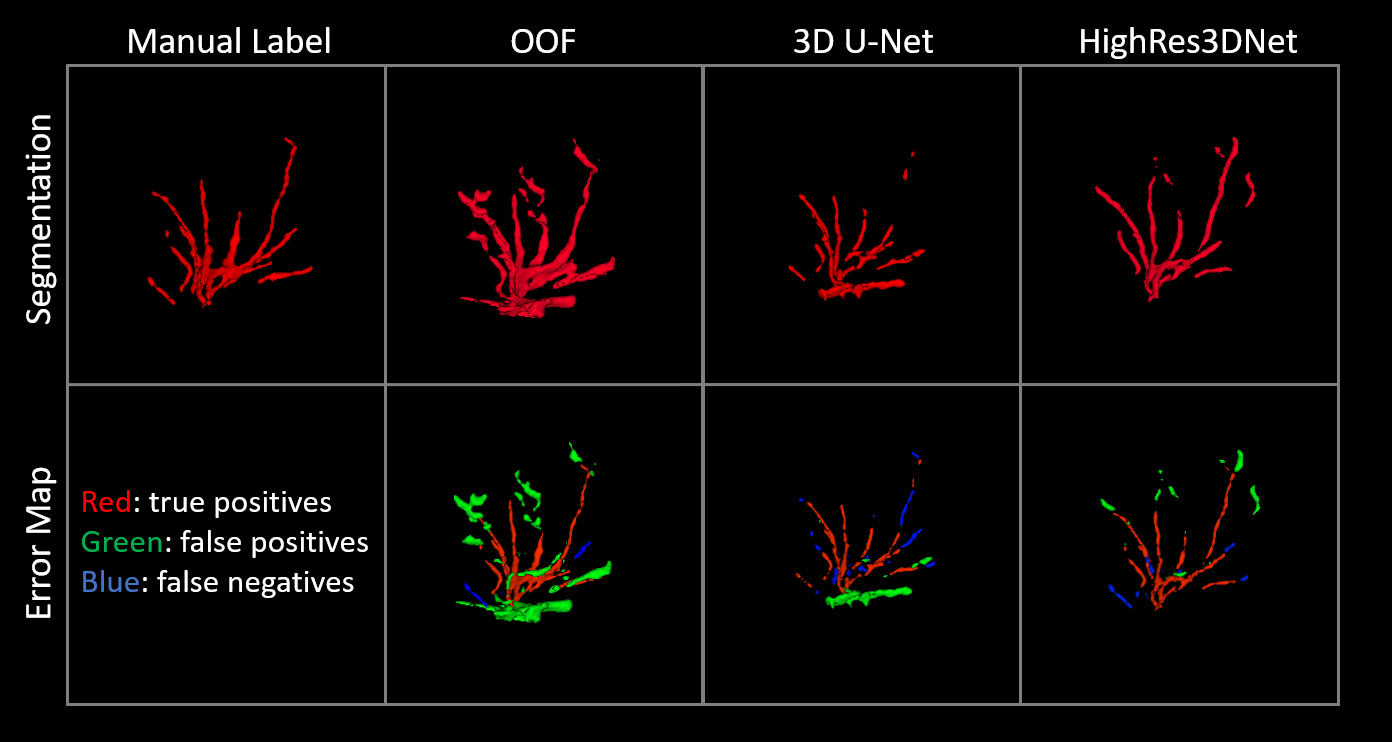
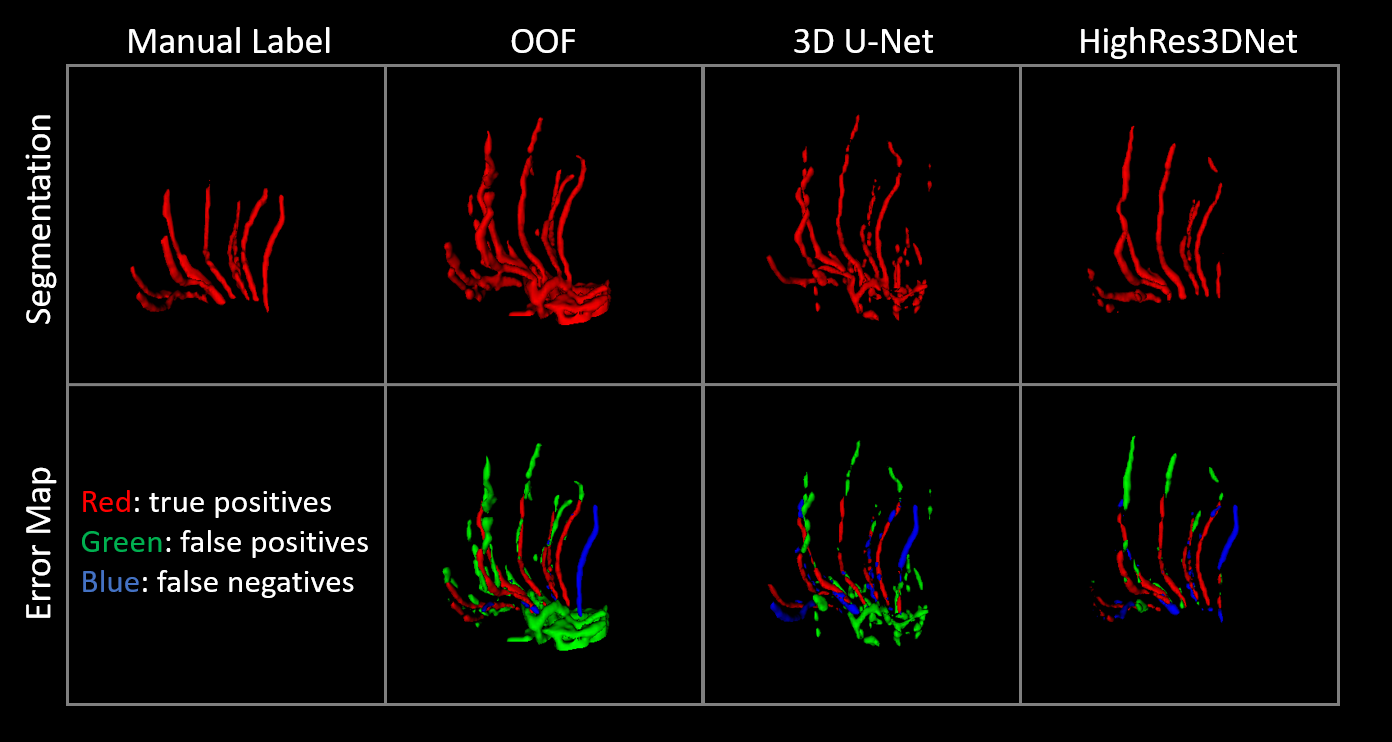
Figures 2 and 3 show examples of the 3D projections of the segmentation results for each method. The visual analysis of the three methods demonstrated that it is feasible to perform automatic segmentation of the LSAs using the optimized black blood MR images. For OOF, 3D U-Net, and HighRes3DNet, the average Dice coefficient was 0.27±0.10, 0.30±0.16, and 0.54±0.07, respectively. The average 95HD was 36.05±11.83, 38.05±10.37, and 27.86±8.94 voxels, respectively. The AVD was 5.14±1.93, 5.64±2.33, and 1.79±0.80 voxels, respectively. Figure 4 shows boxplots of the metrics for each method. HighRes3DNet shows superior performance (p<0.01 for Dice and AHD, p<0.05 for 95HD) in terms of segmenting the LSAs in reference to manual segmentation. These metrics should be interpreted with caution because manual segmentation is still limited to human interpretation, and distal portions of the LSAs are often missed (Figure 3). Based on the OOF results, filtering methods – though indiscriminate to other structures such as perivascular space or ventricles – are a sensitive, feasible approach to initiate the manual segmentation process or even serve as pre-training data for deep learning. With further hyperparameter optimization, the HighRes3DNet model is a promising method for specific LSA segmentation in black blood MR images.Conclusion
We present in the current work an exploratory deep learning framework for automatic segmentation of lenticulostriate arteries from black blood images acquired at 3T. Using manual segmentations as supervision, automatic 3D segmentation of LSAs is demonstrated to be feasible with relatively high performance, and it can serve as a potentially effective tool to aid quantitative morphometric analyses in patients with cerebral small vessel disease.Acknowledgements
This work was supported by National Institutes of Health grants UH2-NS100614, S10-OD025312, K25-AG056594 and P41-EB015922. This work was also supported by American Heart Association grant 16SDG29630013.References
1. Ma SJ, Sarabi MS, Yan L, Shao X, Chen Y, Yang Q, et al. Characterization of lenticulostriate arteries with high resolution black-blood t1-weighted turbo spin echo with variable flip angles at 3 and 7 tesla. Neuroimage. 2019;199:184-193
2. Yushkevich PA, Piven J, Hazlett HC, Smith RG, Ho S, Gee JC, et al. User-guided 3d active contour segmentation of anatomical structures: Significantly improved efficiency and reliability. Neuroimage. 2006;31:1116-1128
3. Li W, Wang G, Fidon L, Ourselin S, Cardoso MJ, Vercauteren T. On the compactness, efficiency, and representation of 3d convolutional networks: Brain parcellation as a pretext task. 2017.
4. Gibson E, Li W, Sudre C, Fidon L, Shakir DI, Wang G, et al. Niftynet: A deep-learning platform for medical imaging. Computer Methods and Programs in Biomedicine. 2018;158:113-122
5. Kingma D, Ba J. Adam: A method for stochastic optimization. International Conference on Learning Representations. 2014
6. Çiçek Ö, Abdulkadir A, Lienkamp S, Brox T, Ronneberger O. 3d u-net: Learning dense volumetric segmentation from sparse annotation. 2016.
7. Law M, Chung A. Three dimensional curvilinear structure detection using optimally oriented flux. 2008.
8. Livne M, Rieger J, Aydin OU, Taha AA, Akay EM, Kossen T, et al. A u-net deep learning framework for high performance vessel segmentation in patients with cerebrovascular disease. Frontiers in Neuroscience. 2019;13
9. Taha AA, Hanbury A. Metrics for evaluating 3d medical image segmentation: Analysis, selection, and tool. BMC Medical Imaging. 2015;15:29
Figures