1304
Attention-based convolutional network quantifying the importance of quantitative MR metrics in the multiple sclerosis lesion classification
Po-Jui Lu1,2,3, Reza Rahmanzadeh1,2, Riccardo Galbusera1,2, Matthias Weigel1,2,4, Youngjin Yoo3, Pascal Ceccaldi3, Yi Wang5, Jens Kuhle2, Ludwig Kappos1,2, Philippe Cattin6, Benjamin Odry7, Eli Gibson3, and Cristina Granziera1,2
1Translational Imaging in Neurology (ThINk) Basel, Department of Medicine and Biomedical Engineering, University Hospital Basel and University of Basel, Basel, Switzerland, 2Neurologic Clinic and Policlinic, Departments of Medicine, Clinical Research and Biomedical Engineering, University Hospital Basel and University of Basel, Basel, Switzerland, 3Digital Technology and Innovation, Siemens Healthineers, Princeton, NJ, United States, 4Radiological Physics, Department of Radiology, University Hospital Basel, Basel, Switzerland, 5Department of Radiology, Weill Cornell Medical College, New York, NY, United States, 6Center for medical Image Analysis & Navigation, Department of Biomedical Engineering, University of Basel, Basel, Switzerland, 7Covera Health, New York, NY, United States
1Translational Imaging in Neurology (ThINk) Basel, Department of Medicine and Biomedical Engineering, University Hospital Basel and University of Basel, Basel, Switzerland, 2Neurologic Clinic and Policlinic, Departments of Medicine, Clinical Research and Biomedical Engineering, University Hospital Basel and University of Basel, Basel, Switzerland, 3Digital Technology and Innovation, Siemens Healthineers, Princeton, NJ, United States, 4Radiological Physics, Department of Radiology, University Hospital Basel, Basel, Switzerland, 5Department of Radiology, Weill Cornell Medical College, New York, NY, United States, 6Center for medical Image Analysis & Navigation, Department of Biomedical Engineering, University of Basel, Basel, Switzerland, 7Covera Health, New York, NY, United States
Synopsis
White matter lesions in multiple sclerosis patients exhibit distinct characteristics depending on their locations in the brain. Multiple quantitative MR sequences sensitive to white matter micro-environment are necessary for the assessment of those lesions; but how to judge which sequences contain the most relevant information remains a challenge. In this abstract, we are proposing a convolutional neural network with a gated attention mechanism to quantify the importance of MR metrics in classifying juxtacortical and periventricular lesions. The results show the statistically significant order of quantitative importance of metrics, one step closer to combining more relevant metrics for better interpretation.
Introduction
Multiple sclerosis(MS) is a neurodegenerative disease of the central nervous system, which is characterized by focal lesions, i.e. areas of demyelination, remyelination and axonal loss. Among different types of white matter lesions(WMLs), Juxtacortical Lesions(JCLs) and Periventricular Lesions(PVLs) have distinctive remyelinating abilities and distinct extent of axonal and myelin damage, as shown in the postmortem histopathological1 and in-vivo PET2 studies respectively. In our previous work3, we attempted to define the importance order of quantitative MR metrics(qMRs) in the classification of JCLs and PVLs by using a two-step inference. This work proceeds further to study the one-step inference quantifying the importance of qMRs in the classification of JCLs and PVLs by incorporating a gated attention mechanism4 into a convolutional neural network(CNN) to estimate importance more reliably.Methods
Forty-nine MS patients (35 relapsing-remitting and 14 progressive) underwent a multi-parametric protocol on a 3T Siemens MAGNETOM Prisma MRI system. MRI data were reconstructed into four qMRs: myelin water fraction(MWF)5, neural density index(NDI)6, quantitative susceptibility map(QSM)7 and T1 relaxometry(qT1) map8 in Fig.1a. WML segmentations were automatically segmented9 and manually corrected by two expert raters. JCLs and PVLs were defined as WMLs located within 3mm from the boundary between (i) WM and grey matter and (ii) WM and ventricles in Fig.1b. 750 JCLs and 242 PVLs were found. To classify JCLs and PVLs, a patch-based CNN with gated attention mechanism was built with three main components, including feature extraction, gated attention mechanism and classification in Fig.2. The feature extraction component included two convolutional blocks for each modality. The convolutional block included one convolutional layer of 32 filters, exponential leaky units and batch normalization. The two connected convolutional blocks were followed by a fully connected layer(FCl) of 16 neurons encoding the hidden feature. The gated attention mechanism was formed by an attention layer containing a 32-neuron FCl followed by the tanh function and a gate layer utilizing a 32-neuron FCl followed by the sigmoid function. The outputs of tanh and sigmoid were element-wise multiplied and connected to a FCl and the softmax function to generate the normalized attention weights. The classifier was one sigmoid neuron receiving the weighted sum of the hidden features and the attention weights. The importance of each modality was represented by the attention weight. Lesions were divided into training, validation and test dataset following the ratios: 0.6, 0.3 and 0.1. Each sample was 5mm cube in lesions and surrounding WM on qMRs. The batch size was 128. The regularization methods included Adam with decoupled weight decay10, data augmentation, early stopping and learning rate scheduler. The class imbalance ratio was incorporated into the weighted cross-entropy loss. The network was optimized over the area under the receiver operating characteristic curve on the validation dataset. Two experiments were performed. The first experiment considered the datasets composed of only one modality’s data and Gaussian noise for the other three modalities to evaluate the ability of the proposed network in detecting the relatively important modality. The second experiment was a 50-time repetition experiment of classification on the real datasets. In each repetition, the datasets were randomly resampled to evaluate the reliability of the obtained order of attention weights. Pair-wise one-sided 10000 permutation t-tests were performed on the attention weights from the repetitions, corrected by Bonferroni correction.Results
Fig.3 shows the results of Experiment 1 when only qT1 or MWF is considered in the Gaussian-noise datasets. The attention weight of the real qT1 is 0.52, triple the weight of the noise datasets and the weight of the real MWF is 0.39, twice the weight. The performance of the repetition experiment on the validation dataset are accuracy(79±4), sensitivity(78±9), and specificity(79±8) and on the test dataset are accuracy(76±7), sensitivity(77±12), and specificity(76±11) in Fig.4. In Fig.5, the resultant mean and standard deviation of the attention weights on test dataset are: qT1 0.28±0.05, MWF 0.25±0.04, NDI 0.24±0.04 and QSM 0.23±0.05. qT1>MWF and MWF>NDI have of corr-p < 0.001 in both datasets, but NDI>QSM has corr-p < 0.01 in the validation dataset and corr-p < 0.05 in the test dataset.Discussion
In Experiment 1, the network could find the real input containing relevant lesion information. The attention weight differences between real inputs were relatively small, which may be attributed to the limited number of training samples and the size of patches compared to the neural network parameters. In Experiment 2, the proposed network could reliably give higher attention weights to more relevant modalities in the classification. qT1 appears to be the most discriminative feature, followed by MWF and NDI. qT1 quantifies the overall microstructural tissue damage within MS lesions11, whereas MWF and NDI provide specific information about myelin and axonal content5,6: the order of importance reflects the overall difference in myelin/axonal content revealed in pathological studies1, which qT1 depicts with the highest sensitivity.Conclusion
Through attention weights, the combination of difference qMRs might be possible for studying the complex patterns of MS lesion pathology. The proposed network assigns higher attention weights to relevant qMRs in the application of classifying lesions having different abilities to remyelinate and extent of myelin/axonal damage. This ability to measure the relative importance of qMRs supports the identification of promising combinations for future analysis.Acknowledgements
This research is supported by Swiss National Funds PZ00P3_154508, PZ00P3_131914 and PP00P3_176984 and we thank all the patients for their participation. The concepts and information presented in this abstract are based on research results that are not commercially available.References
- Goldschmidt T. Remyelination capacity of the MS brain decreases with disease chronicity. Neurology. 2009; 72(22):1914-21.
- Poiron E. Remyelination fails in the periventricular white matter in MS. ECTRIMS 2018
- Lu P.-J. Deep learning analysis applied to multi-parametric advanced MRI shows higher myelin content and neurite density in juxtacortical lesions compared to periventricular lesions. ECTRIMS 2019
- Ilse, M., Tomczak, J. M., & Welling, M. Attention-based Deep Multiple Instance Learning. ICML 2018
- Nguyen TD, Deh K, Monohan E, et al. Feasibility and reproducibility of whole brain myelin water mapping in 4 minutes using fast acquisition with spiral trajectory and adiabatic T2prep (FAST-T2) at 3T. Magn Reson Med. 2016; 76(2):456-65
- Zhang H, Schneider T, Wheeler-Kingshott CA, Alexander DC. NODDI: practical in vivo neurite orientation dispersion and density imaging of the human brain. Neuroimage. 2012;61(4):1000-1016
- Wang Y, Liu T. Quantitative susceptibility mapping (QSM): Decoding MRI data for a tissue magnetic biomarker. Magn Reson Med. 2015;73(1):82-101
- Kober T. MP2RAGE multiple sclerosis magnetic resonance imaging at 3 T. Invest Radiol. 2012;47(6):346-52
- La Rosa F. et al. Shallow vs deep learning architectures for white matter lesion segmentation in the early stages of multiple sclerosis. MICCAI 2018 Brain Lesion (BrainLes) workshop
- Loshchilov I., Hutter F. Decoupled Weight Decay Regularization. ICLR 2019
- Bonnier G. Advanced MRI unravels the nature of tissue alterations in early multiple sclerosis. Annals of Clinical and Translational Neurology 2014; 1(6): 423–432
Figures
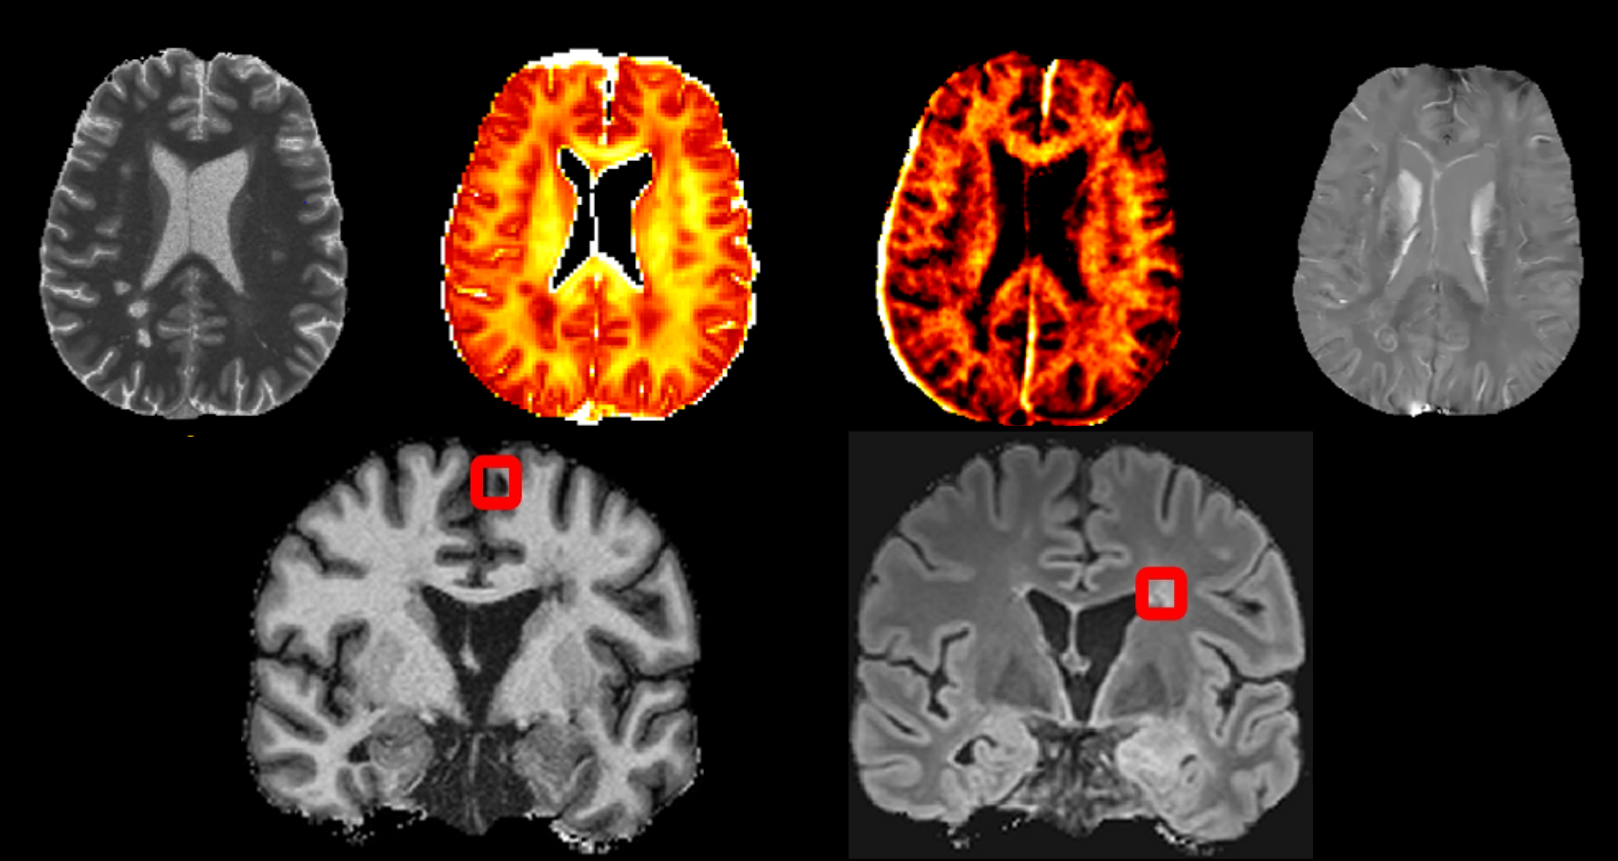
Figure 1: (a)Upper row: The quantitative images:
quantitative T1 relaxometry, neuron density index, myelin water map and
quantitative susceptibility maps. (b)Lower row: The juxtacortical lesions and
periventricular lesions on the MP2RAGE and FLAIR.

Figure 2: The network structure consists of
feature extraction, attention mechanism and classifier. Conv stands for a
convolutional layer. ELU is the exponential leaky unit and FC is the fully
connected layer. Concat is the concatenating layer. BN stands for the batch
normalization. ⊙ represents the element-wise
multiplication.

Figure 3: The result of experiment 1. The first
column indicates the real data of which modality was in the input datasets
while other modalities were Gaussian noise. The result in the first row is when
qT1is the real input among other Gaussian noise. The second row is when MWF is
the only real input. The highest attention weights are in red.

Figure 4: The performance of experiment 2. The
average mean and standard deviation of evaluation metrics are given.
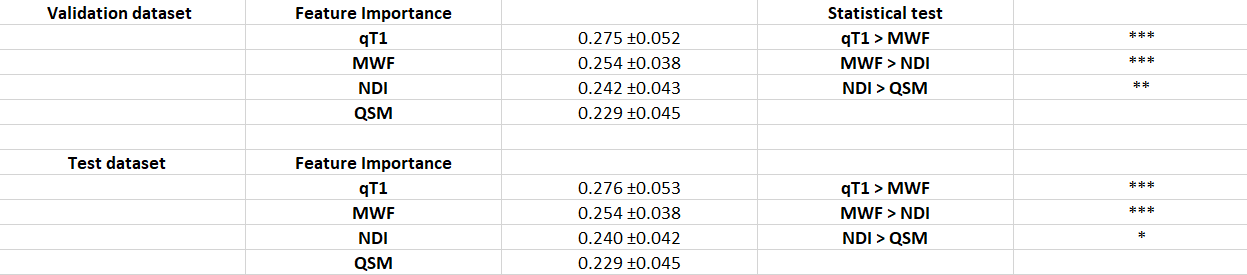
Figure 5: The resultant attention weights and
the statistical test on the pair-wise comparison from experiment 2. The first
row shows the results of the validation dataset and in the second row are the
results of test dataset.
(***:
corrected p<0.001, **: corrected p<0.01, *: corrected p<0.05 )