1303
Characterisation of white matter lesion patterns in Systemic Lupus Erythematosus by an unsupervised machine learning approach.1Department of Clinical Sciences Lund/Diagnostic Radiology, Lund University, Lund, Sweden, 2Clinical Memory Research Unit, Department of Clinical Sciences, Malmö, Lund University, Lund, Sweden, 3Clinical Imaging and Physiology, Skåne University Hospital, Lund, Sweden, 4Department of Reumatology, Skåne University Hospital, Lund, Sweden, 5Department of Clinical Sciences/Centre for Imaging and Function, Skåne University Hospital, Lund, Sweden
Synopsis
Evaluating white matter hyperintensities (WMHs) in neuropsychiatric systemic lupus erythematosus (NPSLE) is a challenging task. Multimodal MRI images in combination with unsupervised machine characterization can provide a powerful tool to investigate the spatial WHM distribution of relevant phenotypes. Automatically segmented WMH maps were spatially allocated to a white matter tract atlas. Cluster analysis was applied on this tract-wise lesion-load map to obtain subtypes with a distinct WMH damage profile. This approach on microstructural changes could help to identify specific progression pattern which may improve the accuracy of NPSLE classification.
Introduction
Systemic Lupus Erythematosus (SLE) is an autoimmune disorder which affects multiple organ systems including the central nervous system. The latter is particularly affected in SLE with neuropsychiatric (NP) symptoms1. Attributing NP symptoms to SLE is a challenging task, however, due to the lack of specific neurobiological or neuroimaging biomarkers2,3. Common MRI findings in SLE are focal white matter hyperintensities (WMHs) or white matter (WM) lesions which can be seen on T2-weighted and FLAIR sequences. While the presence of WMHs is associated with neuropsychiatric SLE (NPSLE), WMHs are also found in non-neuropsychiatric SLE (non-NPSLE)2,3. WMHs are an endpoint of microstructural changes caused by a multitude of pathological processes3,4,5, which we hypothesize could follow different spatial patterns in SLE subtypes.To test this, an unsupervised machine learning approach was developed to isolate WMH-patterns with spatially distinct damage profiles to enhance SLE classification schemes.
Material and Methods
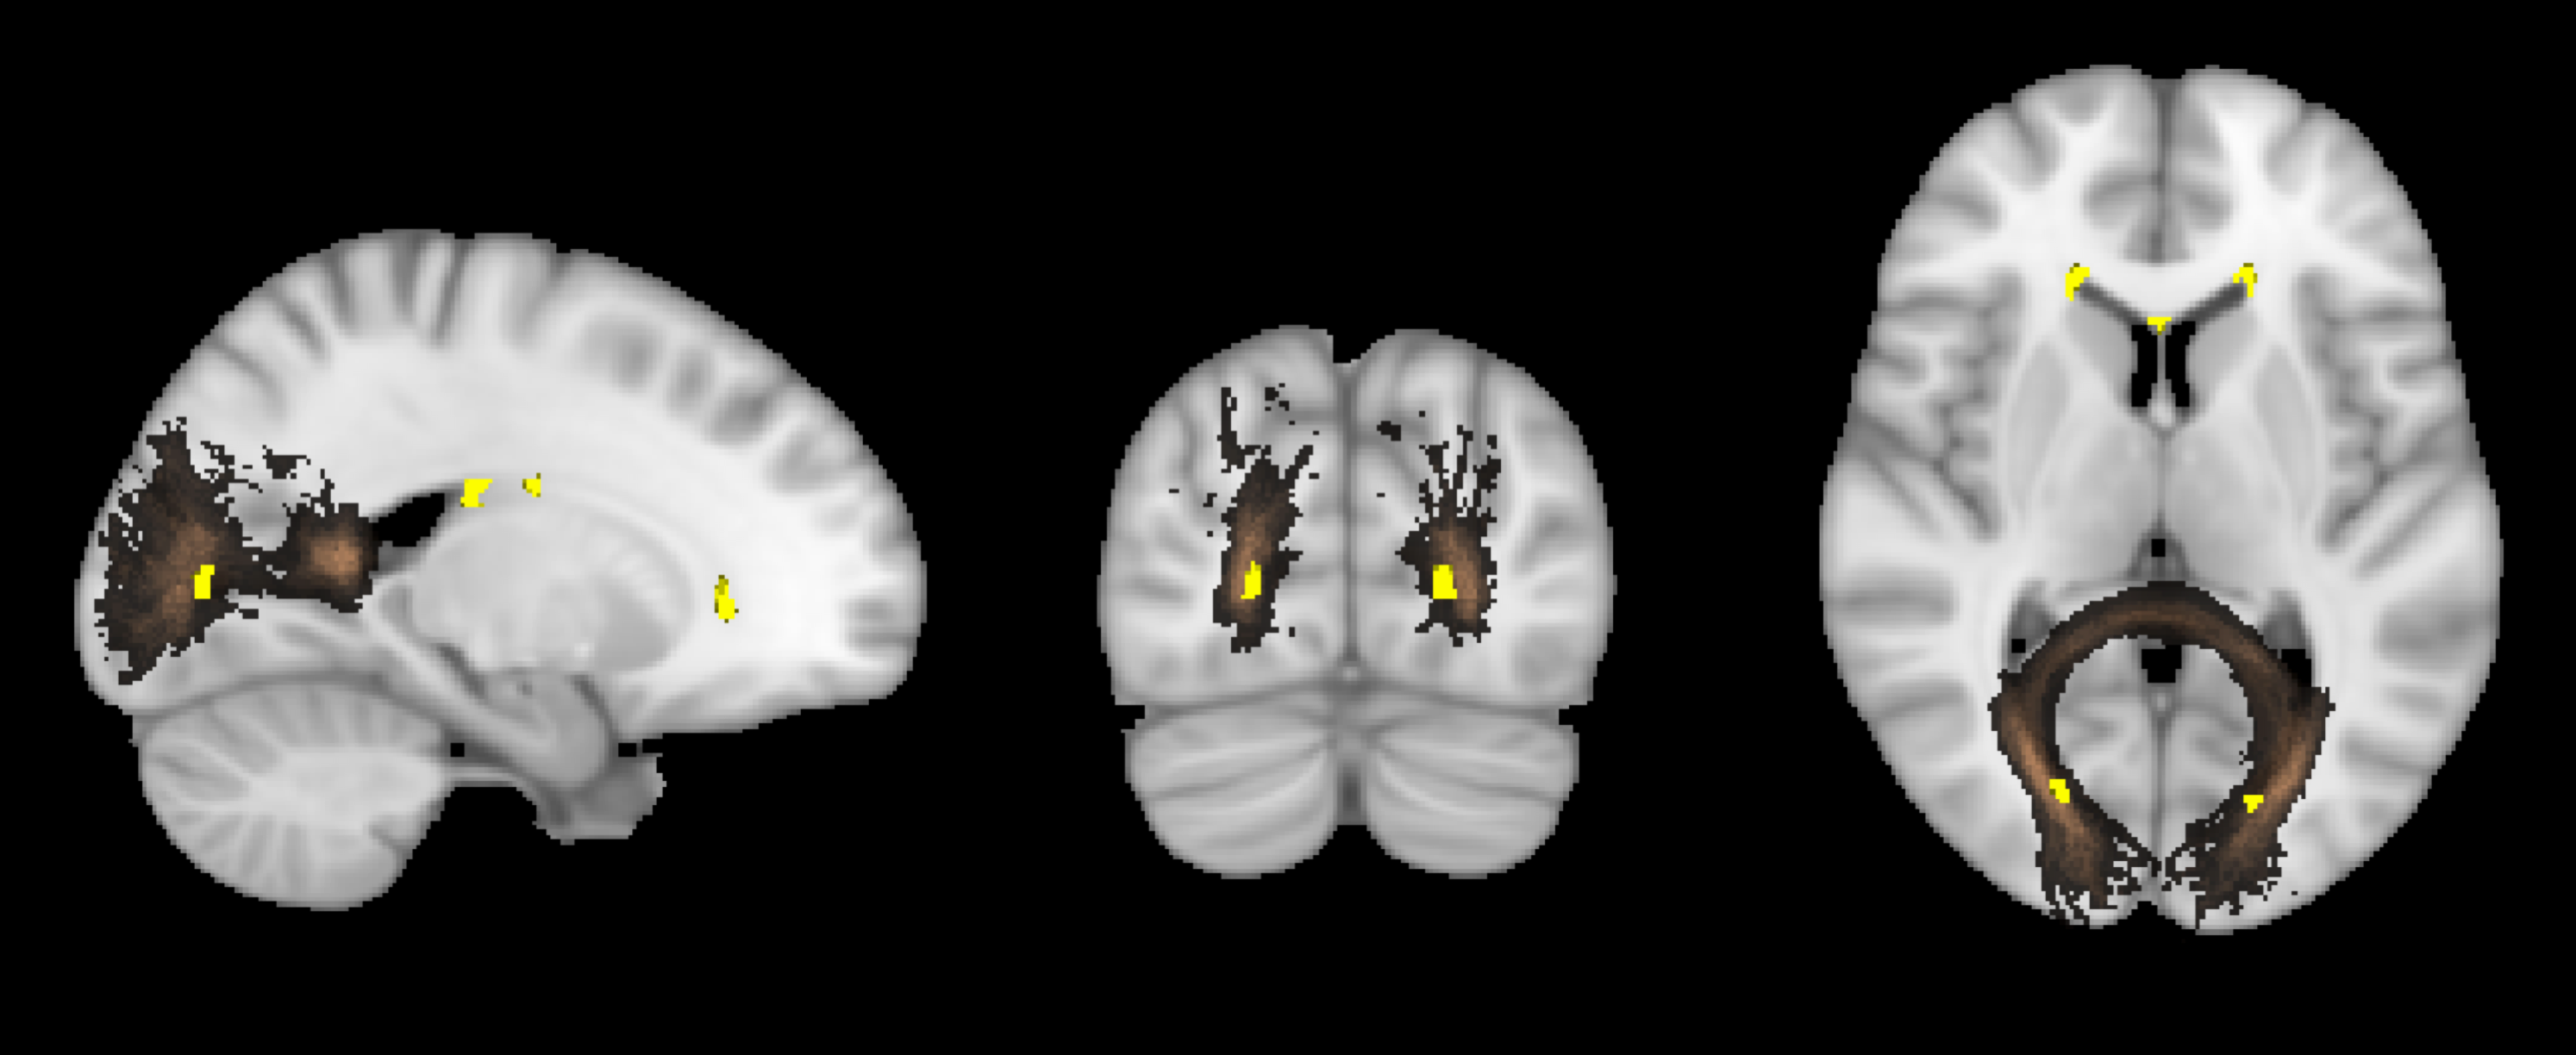
60 SLE patients (37 NPLSE, 23 non-NPSLE) and 24 healthy controls (HC), all women between 18-51 years of age, underwent an institutional review board (IRB) approved 3T MRI brain scan (3T Siemens MAGNETOM Skyra, Erlangen, Germany). Imaging included T1-weighted MPRAGE (magnetisation-prepared rapid gradient-echo) (1mm isotropic, TE/TR/TI=2.54/1900/900 ms) and T2-weighted FLAIR (fluid attenuated inversion recovery) (resolution 0.7x0.7x3 mm, 33 axial slices, TE/TR/TI=81/9000/2500 ms).The imaging data was processed to cluster patients with different spatial distributions of WMHs, using the following steps. WMHs were automatically segmented for each subject on T1 and FLAIR images using LST toolbox6. The obtained WMH probability maps were transformed to the standard Montréal Neurological Institute (MNI) space by applying the transformation from the T1-weighted MPRAGE non-linear co-registration7. Each WMH map was masked by John Hopkins University (JHU) WM tract probability atlas (Fig. 1). WMH and tract probabilities were summed up which resulted in a tract-wise lesion-load feature space, so called lesion-load map. To obtain individual lesion pattern, the lesion-load map was L2-normalized for each subject. Hierarchical clustering (Ward's method) was applied to the normalized lesion-load map. The elbow criterion was used to find an appropriate number of clusters in our dataset. Only SLE patients were included in the cluster analysis.
Results
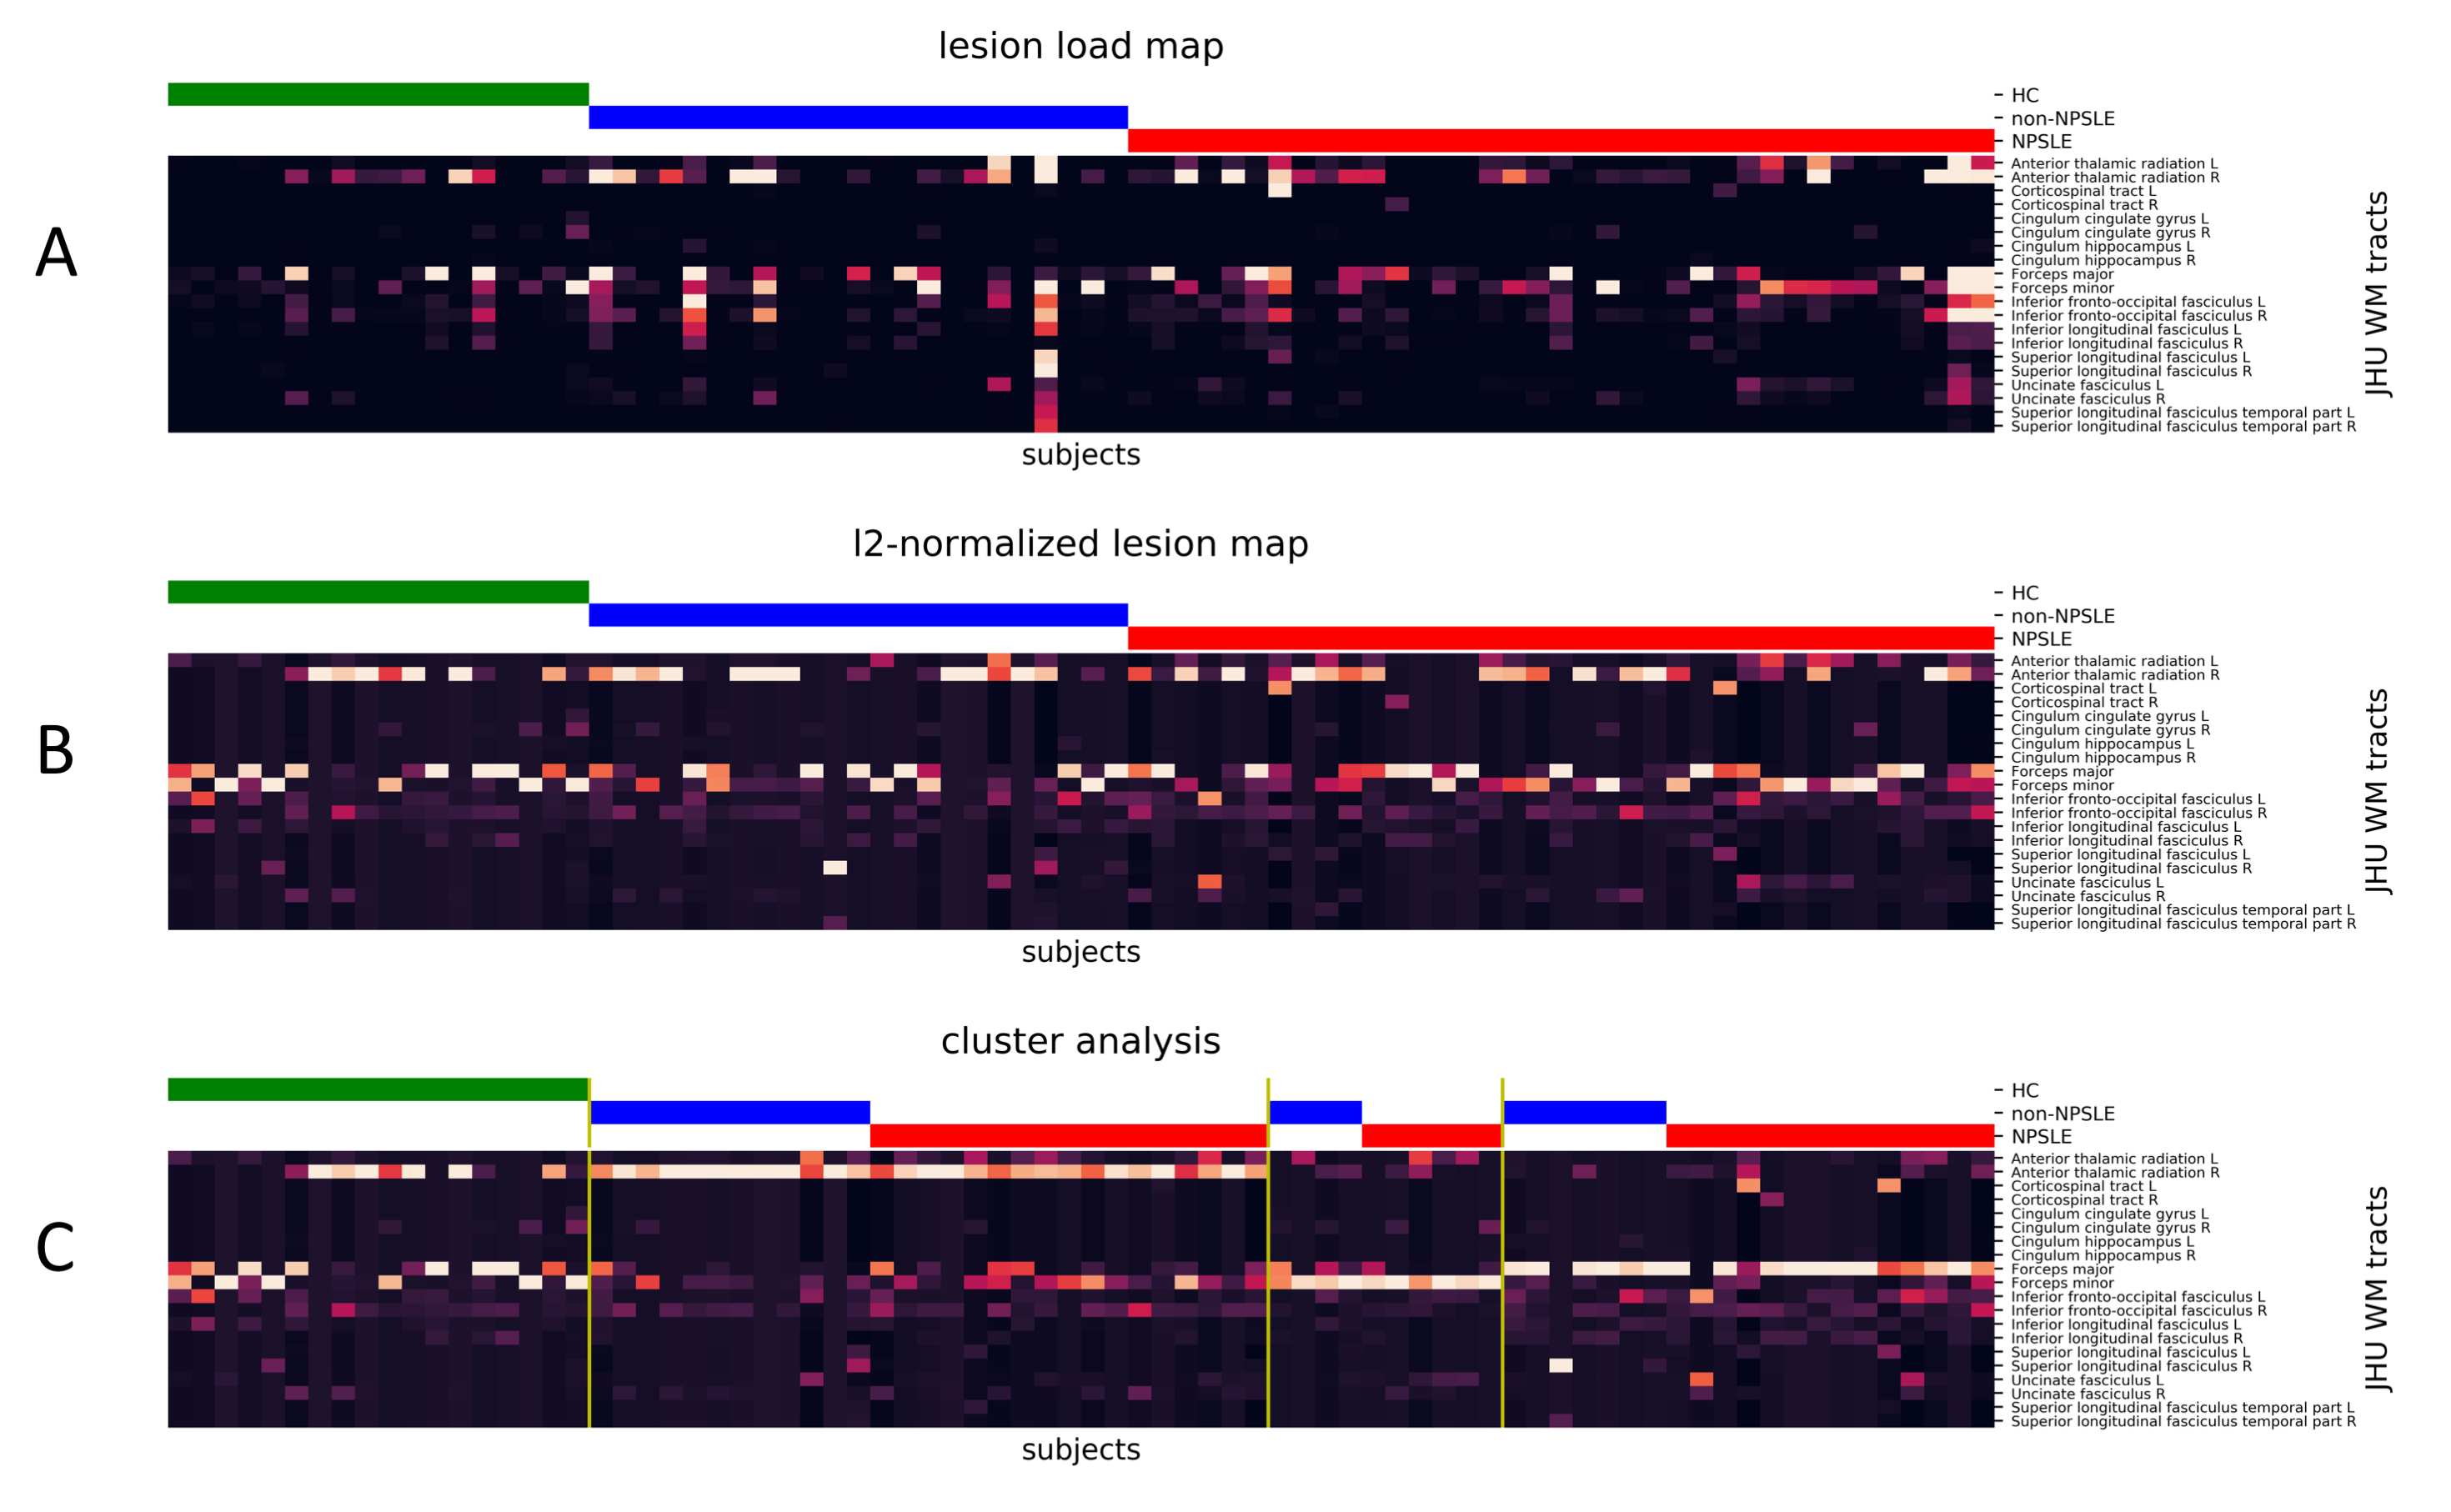
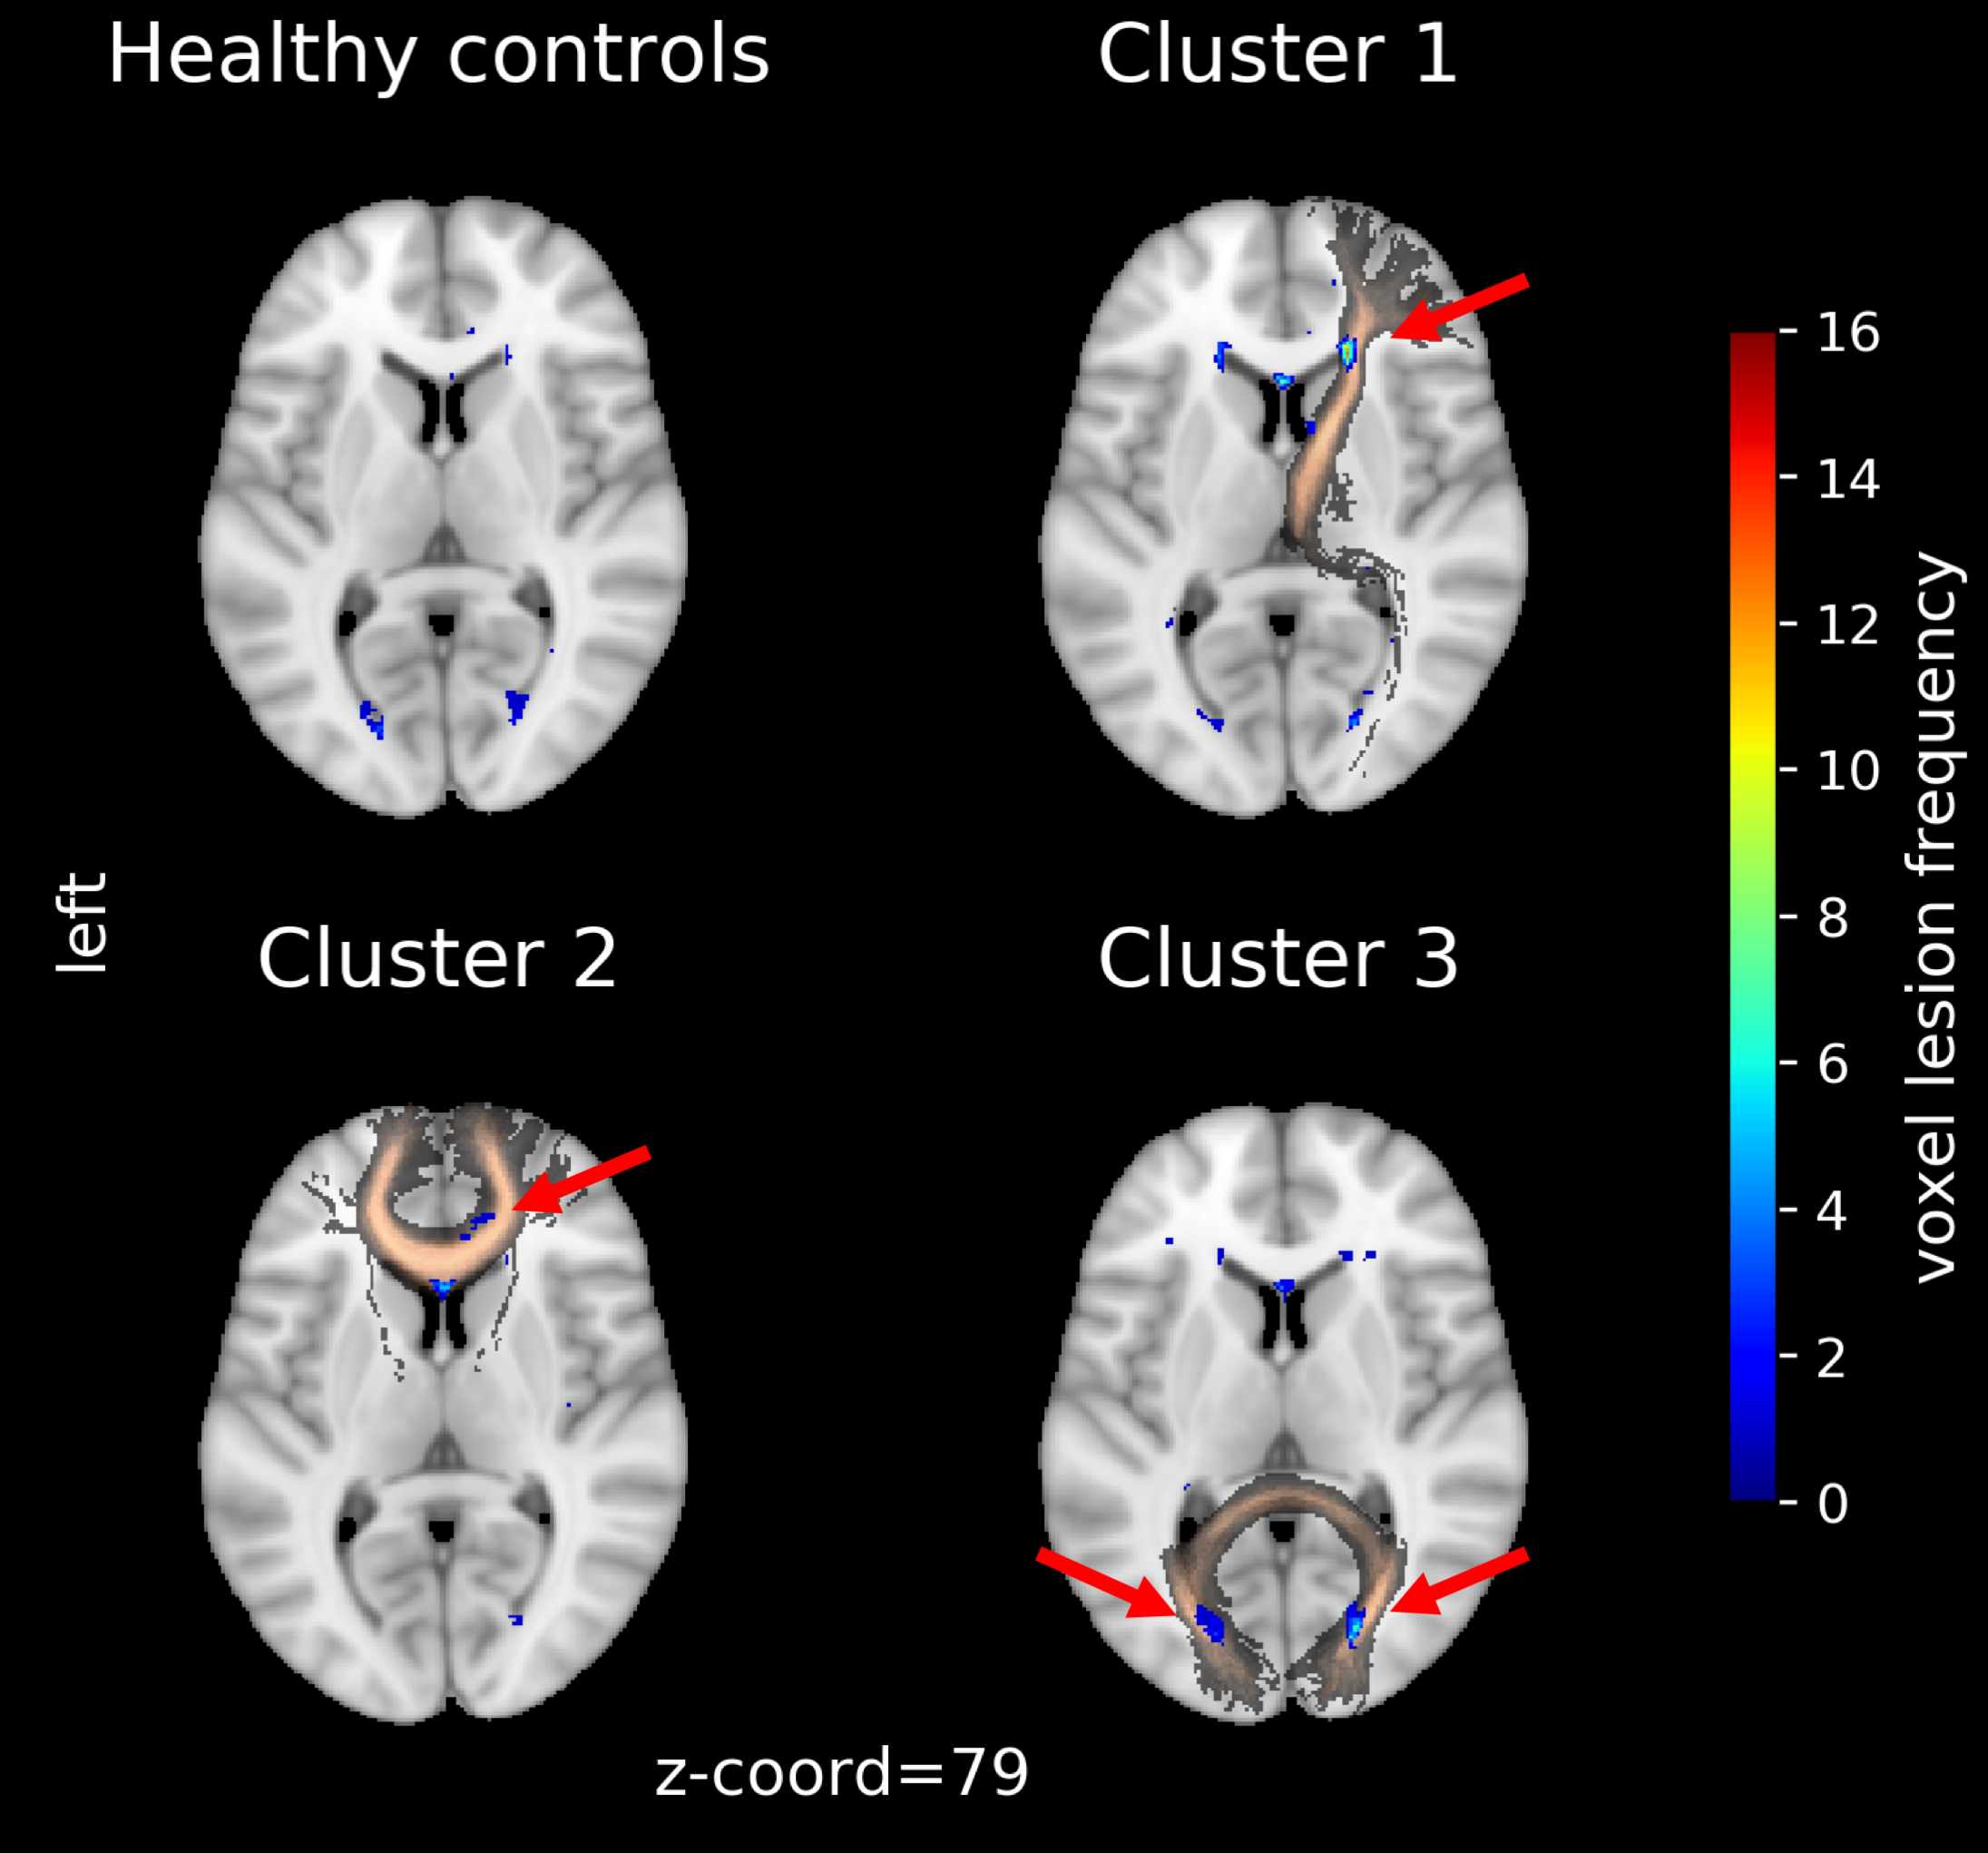
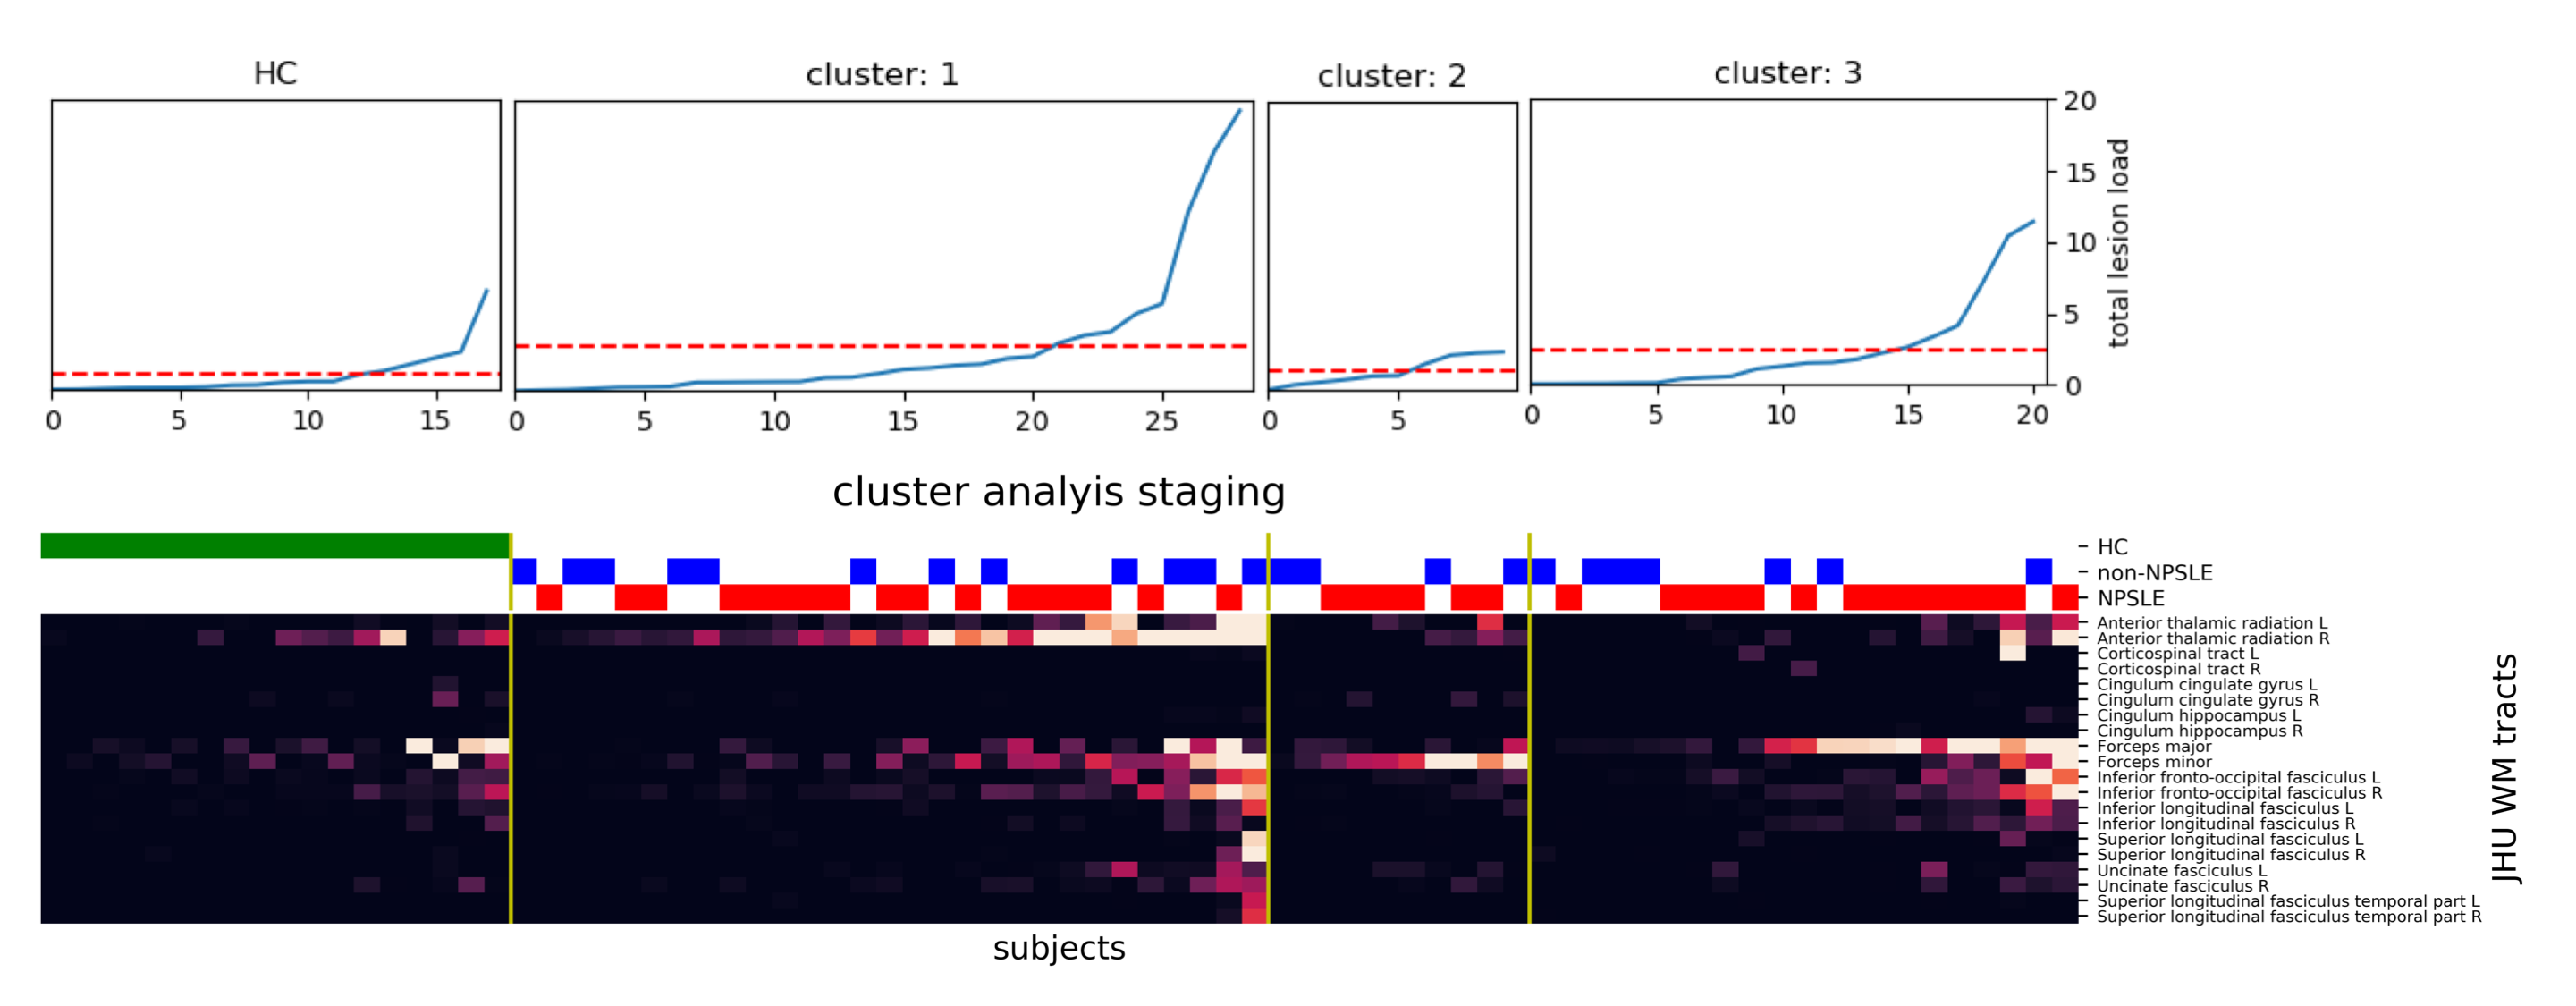
The lesion-load map represents the overlap and spatial distribution of the WMHs on each WM tract for all subjects (Fig. 2). While the non-normalized map maintains quantitative information (Fig. 2A), the normalized emphasize qualitative similarities (Fig. 2B). The cluster analysis resulted in three groups primarily characterized by lesion presence either in the right Anterior Thalamic Radiation, Forceps Major or Forceps Minor (Fig. 2C). This can be also seen in the lesion frequency maps calculated by averaging the binarized subjects WMH maps (Fig. 3). Within each cluster, patients have a qualitative similar damage profile, although each individual has different levels of lesion load. Both aspects can be combined by ordering the subjects within each cluster by their total lesion load over all WM tracts (Fig. 4).Discussion
The results of the cluster analysis highlighted SLE subtypes with spatially distinct WMH damage profiles. These patterns are based on the normalization and emphasize that WMHs aggregate in specific regions for subjects within a cluster. Sorting the qualitatively similar subjects within each group by the total lesion load reveals potential progression staging patterns and their magnitude distribution across the cohorts. In a future step, corresponding phenotypes for each cluster can be determined by taking subjects above a certain total lesion load and examine cognitive test scores and other modalities such as diffusion tensor imaging (DTI).Although WMH load itself in NPSLE is non-specific2, this developed approach combines the magnitudes and spatial distribution present in the WMH maps. Further, limiting it to WM tracts (via the JHU atlas) where disruption of functional and interneural connectivity most likely occur8. The location and spatial distribution of WMHs is more associated with particular cognitive dysfunctions compared to stratifications based on total WMH load8. Longitudinal MRI studies could monitor microstructural changes to evaluate the lesion growth within each cluster.
This study has some limitations. First, only subjects with detected WMH were included in the study. Microstructural changes take place even before a WMH is detectable in MRI images3. Extending our approach with DTI metrics could further enhance the ability to detect subtle changes in the tissue microstructure even before WMHs are visible9. Secondly, smaller WMHs were not detectable due to the low axial resolution of the FLAIR sequence.
Conclusion
This is the first study on spatial specificity of WMHs and applying machine learning on qualitative neuroimaging information in SLE. Our SLE subtypes are identified by providing a link between the size and the spatial information of WMHs. This clustering approach on a multimodal dataset could improve the classification of SLE based on microstructural damage profiles and further extract relevant phenotypes for diagnostic purposes.The presently defined SLE subtypes exhibit characteristics of heterogenous groups but when subjected to objective biomarkers such as MRI it would attain relevant nuances from the machine learning characterization.
Acknowledgements
No acknowledgement found.References
1. Magro-Checa C, Beaart-van de Voorde LJJ, Middelkoop HAM, Dane ML, van der Wee NJ, van Buchem MA, Huizinga TW and Steup-Beekman GM, Outcomes of neuropsychiatric events in systemic lupus erythematosus based on clinical phenotypes; Prospective data from the Leiden NPSLE cohort. Lupus 2017; 26:543-551
2. Hanly JG, Kozora E, Beyea SD, Birnbaum J, Nervous System Disease in Systemic Lupus Erythematosus: Current Status and Future Directions. Arthritis & Rheumatology 2019; 71(1):33-42
3. Magro-Checa C, Steup-Beekman GM, Huizinga TW, van Buchem MA and Ronen I, Laboratory and Neuroimaging Biomarkers in Neuropsychiatric Systemic Lupus Erythematosus: Where Do We Stand, Where To Go? Frontiers in Medicine 2018; 5:340
4. Sibbitt WL, Brooks WM, Kornfeld M, Hart BL, Bankhurst AD and Roldan CA, Magnetic Resonance Imaging and Brain Histopathology in Neuropsychiatric Systemic Lupus Erythematosus. Seminars in Arthritis and Rheumatism 2010; 40(1):32-52
5. Prins ND and Scheltens P, White matter hyperintensities, cognitive impairment and dementia: an update. Nature reviews Neurology 2015; 11(3):157-165
6. Schmidt P, Gaser C, Arsci M, Buck D, Förschler A, Berthele A, Hoshi M, Ilg R, Schmid VJ, Zimmer C, Hemmer B and Muehlau M, An automated tool for detection of FLAIR-hyperintense white-matter lesions in Multiple Sclerosis. Neuroimage 2012; 59(4):3774-3783
7. Avants BB, Tustison NJ, Song G, Cook PA, Klein A, Gee JC, A reproducible evaluation of ANTs similarity metric performance in brain image registration. Neuroimage 2011; 54(3):2033-2044
8. Bolandzadeh N, Davis JC, Tam R, Handy TC and Liu-Ambrose T, The association between cognitive function and white matter lesion location in older adults: A systematic review. BMC Neurology 2012; 12:126
9. Nystedt J, Nilsson M, Jönsen A, Nilsson P, Bengtsson A, Lilja Å, Lätt J, Mannfolk P and Sundgren PC, Altered white matter microstructure in lupus patients: A diffusion tensor imaging study. Arthritis Research and Therapy 2018; 20:21
Figures