1300
Deep Learning Multi-class Segmentation Algorithm is more Resilient to the Variations of MR Image Acquisition Parameters1Department of Radiology, Taipei Medical University - Shuang Ho Hospital, New Taipei, Taiwan, 2Institute of Biomedical Engineering, National Taiwan University, Taipei, Taiwan, 3Department of Radiology, Stanford University, Palo Alto, CA, United States, 4School of Medicine, College of Medicine, Taipei Medical University, Taipei, Taiwan
Synopsis
A huge amount of T2-FLAIR images with appearance of white matter hyperintencities (WMH) were used. 1368 cases from one hospital were selected as the training set. Another 100 cases from the same hospital and 200 cases from the other 2 different hospitals were treated as the independent test set. Based on multi-class U-SegNet approach, it can achieve the highest F1 score (same hospital: 90.01%; different hospital: 86.52%) in the test set compared with other approaches. The result suggested that the multi-class segmentation approach is more resilient to the variations of MR image parameters than the single label segmentation approach.
Introduction
Segmentation of brain tissues and white matter hyperintensities (WMH) is widely described in many literature 1-3. Numerous automatic segmentation methods already exist, with varying performance 4-6 depends for example on MR image acquisition parameters, such as field strength 7, TR/TE, slice thickness from different scanners. In the widely used single label segmentation approach, an optimal cut-off threshold is needed to be selected for best segmentation of the targets. However, images acquired from different image parameters may suitable for different optimal thresholds. The multi-class segmentation approach classifies each pixel to a class label according to the class with the highest probability among all categories instead of selecting an optimal threshold for each data set. We hypothesized that the multi-class segmentation approach can be more resilient to the variations of the MR image parameters and achieve better tissue type identification than the widely used single label segmentation approach.Methods
The MRI scans of 1468 patients from Shuang Ho Hospital (SHH), 100 patients from Taipei Medical University Hospital (TMUH), and 100 cases from Wang-Fang Hospital (WFH) with suspicion for cerebral small vessel disease (cSVD) on neuroimaging (appearance of WMHs) during the past 5 years were recruited (Table 1). The exclusion criteria include: presence of (a) intracranial hemorrhage (b) intracranial spacing occupying lesion (c) non-cSVD related WMH (e.g. multiple sclerosis). 1368 cases from SHH were selected as the training set. At the beginning of each epoch, 1/9 of the images from training set would be randomly split into the validation set for parameter tuning. The remaining 100 cases from SHH as well as the other cases from TMUH and WFH were treated as the independent test set, according to the same ratio of the case number in each Fazekas level as the training set. Lesion annotations were created in a slice-by-slice manner by 6 experienced raters, manually contouring hyper-intense lesions on T2-FLAIR MRI. To ensure the quality of the annotations, the other 2 experienced raters will randomly check all the cases labeled by each rater.Brain-extracted T2-FLAIR images from all subjects were segmented by SPM12. Probability map of brain tissues (gray matter, white matter, and cerebrospinal fluid) were created; then, the ground truth of each tissue class was constructed by binarization of the probability maps with a threshold value of 0.5. The axial slices were rescaled to 512x512 to guarantee a uniform image size for model input. Then, Gaussian normalization was employed to normalize the brain pixel intensity distributions for each axial slice. We use the 2D U-SegNet (Figure 1), a hybrid approach of U-Net 8 and SegNet 9, to achieve multi-class segmentation.
The pre-processed axial slices were fed into the U-SegNet, which consists of an encoding part that shrinks the spatial dimensions, and a decoding part that expands the feature maps. The feature maps were up-sampled through the pooling indices taken from the down-sampling path at the same resolution for better object boundary identification 9. We further proposed a skip connection inspired from U-Net to incorporate fine multi-scale information 8. We performed a novel loss function which is the combination of the dice coefficient loss 10 focusing on the WMH lesion area and the categorical cross-entropy loss 11 benefiting for multi-class segmentation.
Results
The results of WMH segmentation were shown in Figure 2. The multi-class U-SegNet can achieve the highest F1 score in the test set (Table 2; SHH: 90.01%, TMUH: 86.55%, and WFH: 86.49%) among all other methods. The F1 score showed significant difference between single label and multi-class segmentation approaches (t=5.4, p<0.0001). Prediction results from other models may cause false positives in GM due to the similar pixel intensities as WMH (Figure 2B-D). While using multi-class U-SegNet, these pixels will be classified into GM class rather than the WMH lesion class (Figure 2E). Further, the multi-class U-SegNet shows the highest F1 score (Table 2) and least bias (Figure 3) than using the single label segmentation approach or using U-Net alone. The result suggested that the multi-class U-SegNet can greatly reduce the false positives in the area which have similar pixel intensity as WMH.Discussion & Conclusion
A huge amount of T2-FLAIR images with appearance of white matter hyperintencities (WMH) were recruited in this study. 1368 cases from SHH were used for training. The well-trained WMH segmentation models were further test on 100 cases from the same hospital (SHH) and 200 cases from the different hospitals (TMUH and WFH), respectively. The multi-class U-SegNet can achieve the highest F1 score among all subset of the test data (same hospital: 90.01%, different hospital: 86.52%). Further, the F1 score showed significant difference between single label and multi-class segmentation approaches. The result suggested that the multi-class segmentation methods are more resilient to the variations in MR image acquisition parameters compared with the single-label segmentation method, especially from the different data sources.Acknowledgements
This work is partially supported by Ministry of Science and Technology, Taiwan (MOST 107-2634-F-038-001, MOST 106-5420-011-300)References
1. Cees De Groot J, De Leeuw FE, Oudkerk M, et al. Cerebral white matter lesions and cognitive function: the Rotterdam Scan Study. 2000; 47: 145-151.
2. De Bresser J, Reijmer YD, Van Den Berg E, et al. Microvascular determinants of cognitive decline and brain volume change in elderly patients with type 2 diabetes. 2010; 30: 381-386.
3. Ikram MA, Vrooman HA, Vernooij MW, et al. Brain tissue volumes in the general elderly population: The Rotterdam Scan Study. 2008; 29: 882-890.
4. de Boer R, Vrooman HA, Ikram MA, et al. Accuracy and reproducibility study of automatic MRI brain tissue segmentation methods. 2010; 51: 1047-1056.
5. Kuijf HJ, Moeskops P, de Vos BD, et al. Supervised novelty detection in brain tissue classification with an application to white matter hyperintensities. In: Medical Imaging 2016: Image Processing 2016, p.978421. International Society for Optics and Photonics.
6. Sudre CH, Cardoso MJ, Bouvy WH, et al. Bayesian model selection for pathological neuroimaging data applied to white matter lesion segmentation. 2015; 34: 2079-2102.
7. Heinen R, Bouvy WH, Mendrik AM, et al. Robustness of automated methods for brain volume measurements across different MRI field strengths. 2016; 11: e0165719.
8. Ronneberger O, Fischer P and Brox T. U-net: Convolutional networks for biomedical image segmentation. In: International Conference on Medical image computing and computer-assisted intervention 2015, pp.234-241. Springer.
9. Badrinarayanan V, Kendall A, Cipolla RJItopa, et al. Segnet: A deep convolutional encoder-decoder architecture for image segmentation. 2017; 39: 2481-2495.
10. Milletari F, Navab N and Ahmadi S-A. V-net: Fully convolutional neural networks for volumetric medical image segmentation. In: 2016 Fourth International Conference on 3D Vision (3DV) 2016, pp.565-571. IEEE.
11. Murphy KP. Machine learning: a probabilistic perspective. MIT press, 2012.
Figures
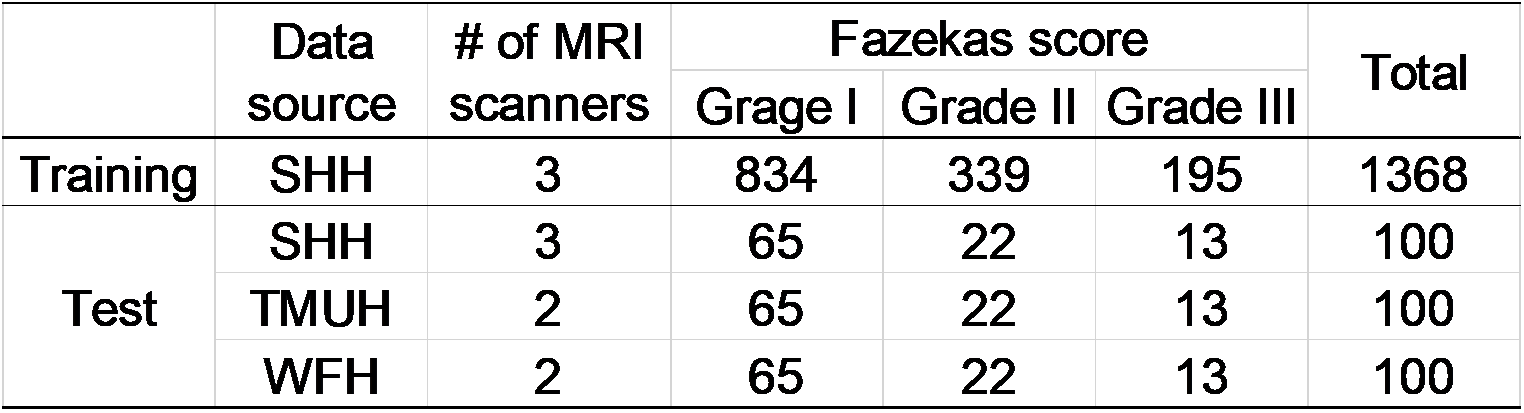
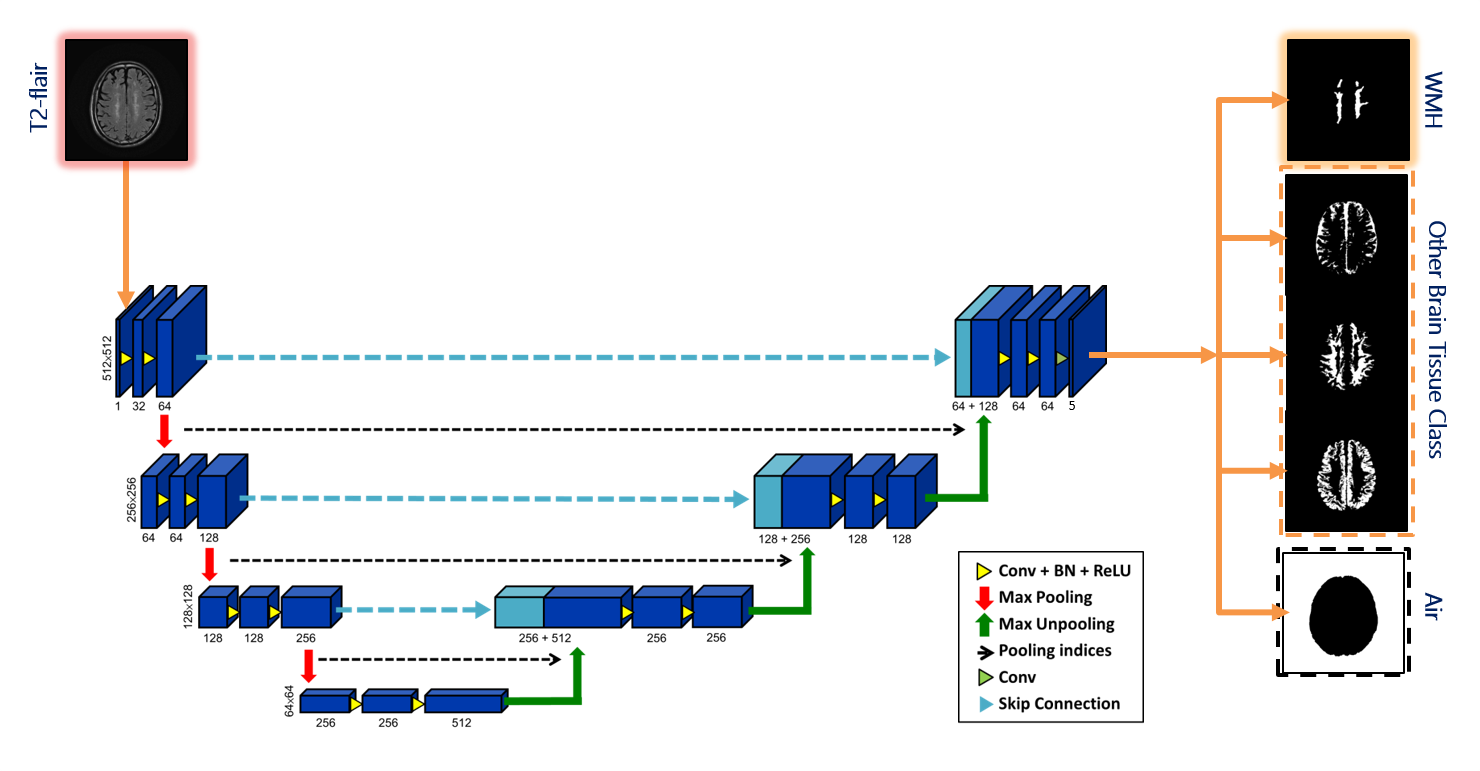
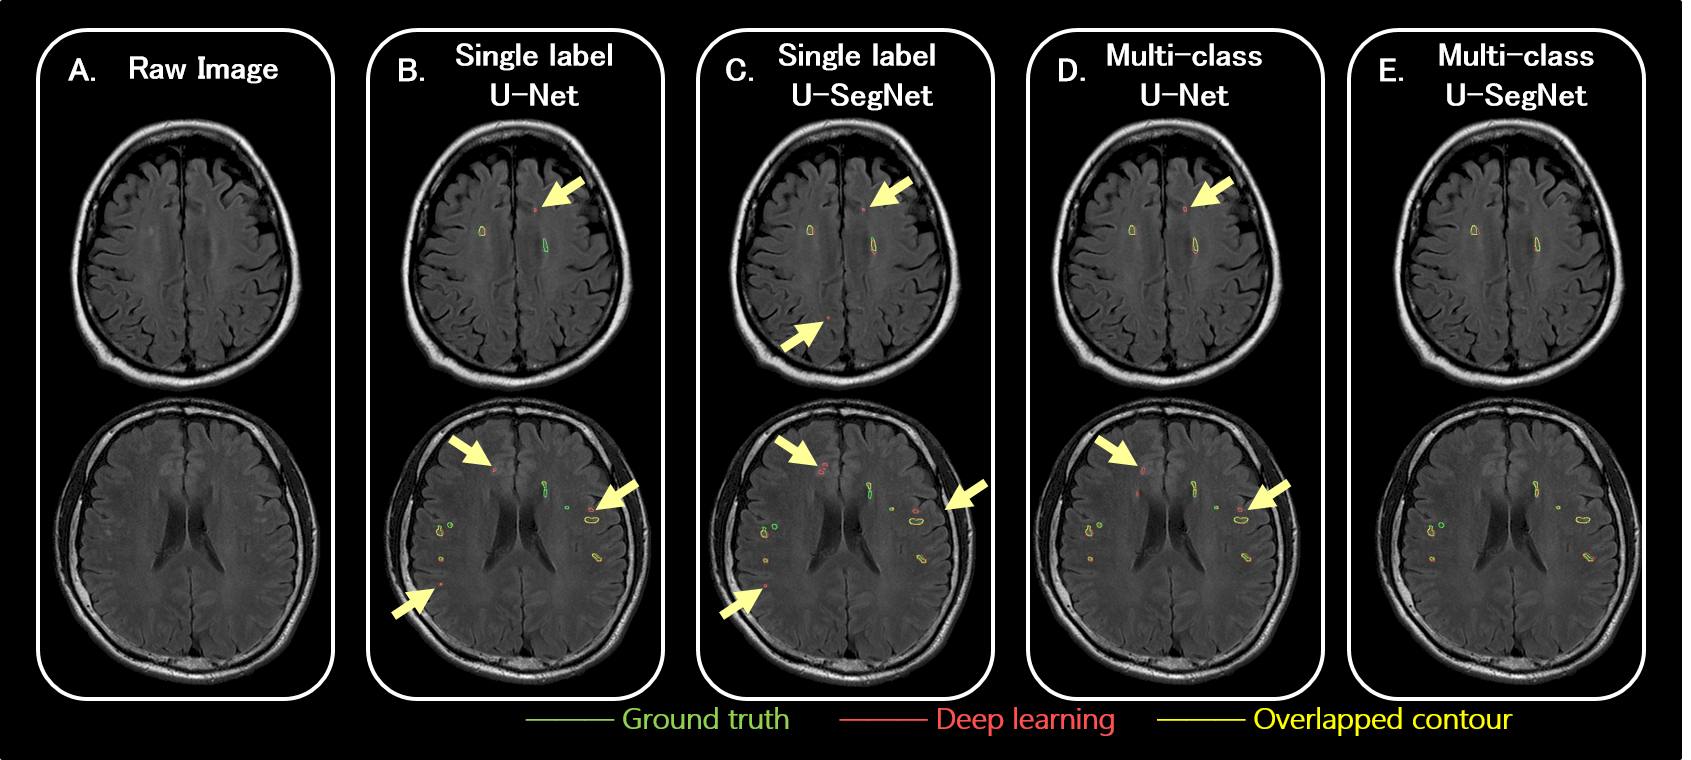
Figure 2 T2-FLAIR raw images and the segmentation results
The area contoured by green line indicated the lesions marked by the physicians as the ground truth.
The area surrounded by pink line indicated the lesion area segmented by the corresponding deep learning algorithm.
The yellow line shows the overlapped contour of the ground truth and model predicted lesions.
The ivory yellow arrows point out the false positives.
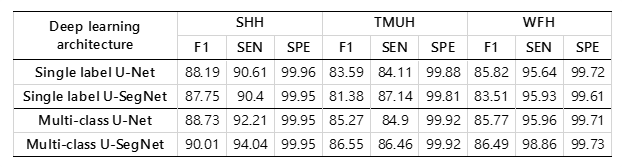
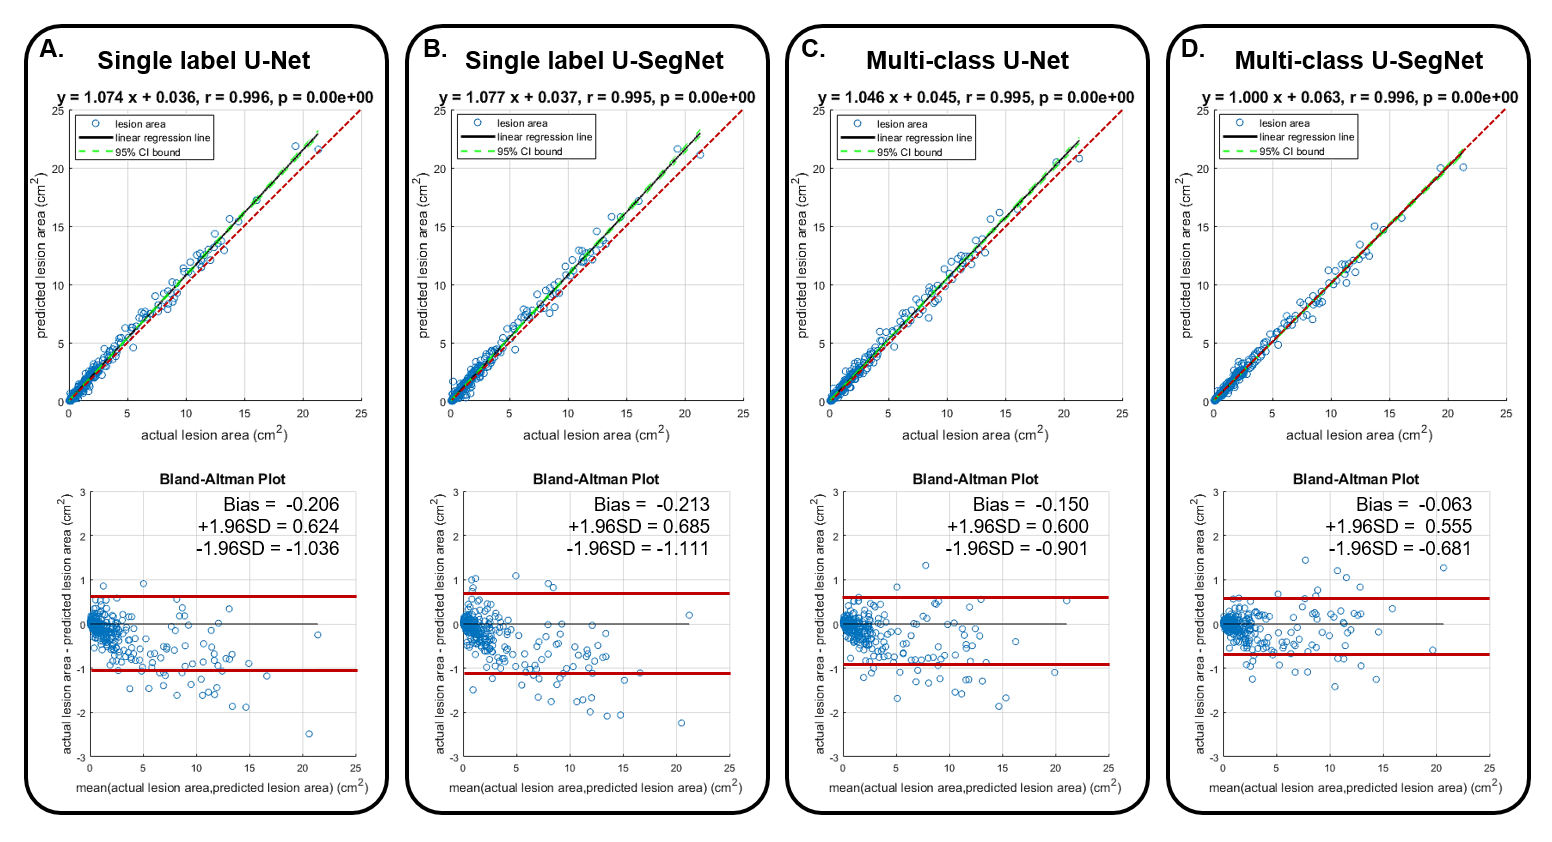
Figure 3 Linear regression relation(Top) and Bland-altman plot (Bottom) of actual lesion area and model predicted lesion area from different deep learning architecture
(A) Single label U-Net
(B) Single label U-SegNet
(C) Multi-calss U-Net
(D) Multi-calss U-SegNet