1289
A deep learning approach for hemodynamic parameter estimation from multi-delay arterial spin-labelled MRI
Nicholas J. Luciw1,2, Zahra Shirzadi2, Sandra E. Black2, Maged Goubran2, and Bradley J. MacIntosh1,2
1Department of Medical Biophysics, University of Toronto, Toronto, ON, Canada, 2Sunnybrook Research Institute, Toronto, ON, Canada
1Department of Medical Biophysics, University of Toronto, Toronto, ON, Canada, 2Sunnybrook Research Institute, Toronto, ON, Canada
Synopsis
Arterial spin-labelled (ASL) MRI is used to quantify cerebral blood flow and arterial transit time. Currently, these parameters are not calculated at the scanner given the time-consuming processing required. Fast, automated parameter estimation is therefore desirable to radiology clinics. Here, we trained a convolutional neural network to estimate cerebral blood flow and arterial transit time from multiple post-label delay ASL. The network produces estimates comparable to other approaches and was designed to evaluate model uncertainty. This fast, automated method is suitable for scan-time generation of accurate hemodynamic maps, important in the assessment of neurological disorders and neurodegeneration.
Introduction
Imaging cerebral blood flow (CBF) is desirable in the context of radiology and neurology. As a core component of brain physiology, CBF data can be used to track progression of brain disease, such as Alzheimer’s disease.1 Arterial spin-labelled (ASL) MRI is a non-invasive method to quantify CBF and, through multiple post-label delay ASL (multi-PLD ASL), arterial transit time (ATT). To expand the clinical use of ASL, there is a need to go beyond cursory outputs — such as a single perfusion-weighted image — that are part of current scanner ASL reconstruction. An ideal clinical ASL scan would automatically produce quantitative CBF and ATT maps, whereas standard procedures for processing multi-PLD ASL require operator oversight and are developed for the research setting.2,3Deep learning has successfully improved ASL quality and quantification accuracy using a multi-contrast input, and has been shown to reduce scan time of ASL sequences designed to combine dynamic and angiographic information.4,5 Here, we trained a deep convolutional neural network to simultaneously estimate CBF and ATT from a multi-PLD ASL acquisition in seconds.
Methods
We collected multi-PLD ASL MRI scans from 29 older adults. Pseudo-continuous ASL images were acquired on a 3T MRI (GE Healthcare). The 2D EPI acquisition parameters were: TR/TE = 3.5-5s/17ms; 64x64x17 matrix; voxel size 3.5x3.5x5.6mm3; labelling duration 1500ms; PLD schedule for the most inferior slice: 100, 500, 900, 1300, 1700, 2100ms; and 12 control-label pairs for each PLD. We trained a 3D convolutional neural network to estimate CBF and ATT from the average difference image at each PLD. All 29 datasets were used for hyperparameter tuning, five of which were set aside for validation. After tuning, the remaining 24 scans were used to assess network performance by training the network using five-fold cross validation. To select the validation set for each fold of training, we randomly partitioned the 24 scans into four sets of 5 scans and one set of 4. Ground-truth parameter maps were estimated through a two-compartment model fitting using the BASIL package.2 Our network was trained to minimize a composite CBF+ATT mean absolute error. We used 500 iterations of Monte Carlo dropout (dropout rate 0.25) to compute an uncertainty heuristic in the network outputs, expressed as a percent variation of the parameter estimate. Uncertainty heuristics were computed for the first validation set only. Finally, we assessed the performance and uncertainty of the network in grey vs. white matter, and in voxels with and without signal contribution from macrovasculature.Results
Mean absolute error of ASL estimates across validation samples are shown in Figure 1; average CBF and ATT errors in grey matter were 10.0±2.2 ml/100g/min and 0.11±0.04 s, respectively. Of the four brain lobes, CBF and ATT errors were lowest in the parietal lobe and highest in the temporal lobe (Figure 1). The best and worst cases of the first validation set (blue points, Figure 1) are shown in Figure 2. Average CBF error was higher in grey matter compared to white matter (t-test p < 0.0001), however, network uncertainty was 32% higher in white matter compared to grey matter (Figure 3). Similarly, average ATT error was higher in grey matter compared to white matter (t-test p < 0.0001). ATT uncertainty was also higher in grey matter. Qualitatively, we observed high uncertainty at edges of the brain, and where estimates include signal absent in ground-truth images (e.g. anterior regions of estimates in Figure 2). CBF uncertainty was significantly lower in voxels with macrovascular contribution compared to those without, but no difference was found in ATT uncertainty (Figure 3).Discussion
We developed a neural network model that uses multi-PLD ASL inputs to simultaneously estimate quantitative CBF and ATT. Average errors of both parameters in grey and white matter are within ASL MRI repeatability estimates of 13.0 ml/100g/min and 0.13 s reported in the literature.6 Although network errors are small in white matter, this is likely due to lower absolute CBF in white compared to grey matter. Indeed, estimating CBF in white matter is known to be difficult with ASL MRI,7 reflected also in higher values of our network uncertainty heuristic.Motivated by low network uncertainty in voxels with microvascular signal, future work will investigate the impact of explicitly estimating arterial blood volume. Further, we will extend the generalizability of our model by training on larger data, sourced from multiple scanners and populations. We will also train on inputs with missing PLDs, thereby accommodating corrupted images and offering parameter estimation in time-constrained settings. Improved performance and generalizability will make this deep learning approach more suitable for medical imaging applications, where near-real-time estimation of quantitative hemodynamic parameters is desired.
Acknowledgements
No acknowledgement found.References
- Alsop DC, Detre JA, Grossman M. Assessment of cerebral blood flow in Alzheimer's disease by spin‐labeled magnetic resonance imaging. Annals of neurology. Jan;47(1):93-100, 2000.
- Chappell MA, Groves AR, Whitcher B, Woolrich MW. Variational Bayesian inference for a non-linear forward model. IEEE Transactions on Signal Processing 57(1):223-236, 2009.
- ExploreASL [Internet]. https://sites.google.com/view/exploreasl
- Guo J, Gong E, Goubran M, Fan AP, Khalighi MM, and Zaharchuk G. Improving Perfusion Image Quality and Quantification Accuracy Using Multi-contrast MRI and Deep Convolutional Neural Networks. In ISMRM, Paris, France, 2018.
- Yousefi S, Hirschler L, van der Plas M, Elmahdy MS, Sokooti H, Van Osch M, Staring M. Fast Dynamic Perfusion and Angiography Reconstruction using an end-to-end 3D Convolutional Neural Network. In International Workshop on Machine Learning for Medical Image Reconstruction, 2019.
- Petersen ET, Mouridsen K, Golay X. The QUASAR reproducibility study, Part II: Results from a multi-center Arterial Spin Labeling test–retest study. Neuroimage 1;49(1):104-13, 2010.
- van Gelderen P, de Zwart JA, Duyn JH. Pittfalls of MRI measurement of white matter perfusion based on arterial spin labeling. Magn Reson Med 59:788–795, 2008.
Figures
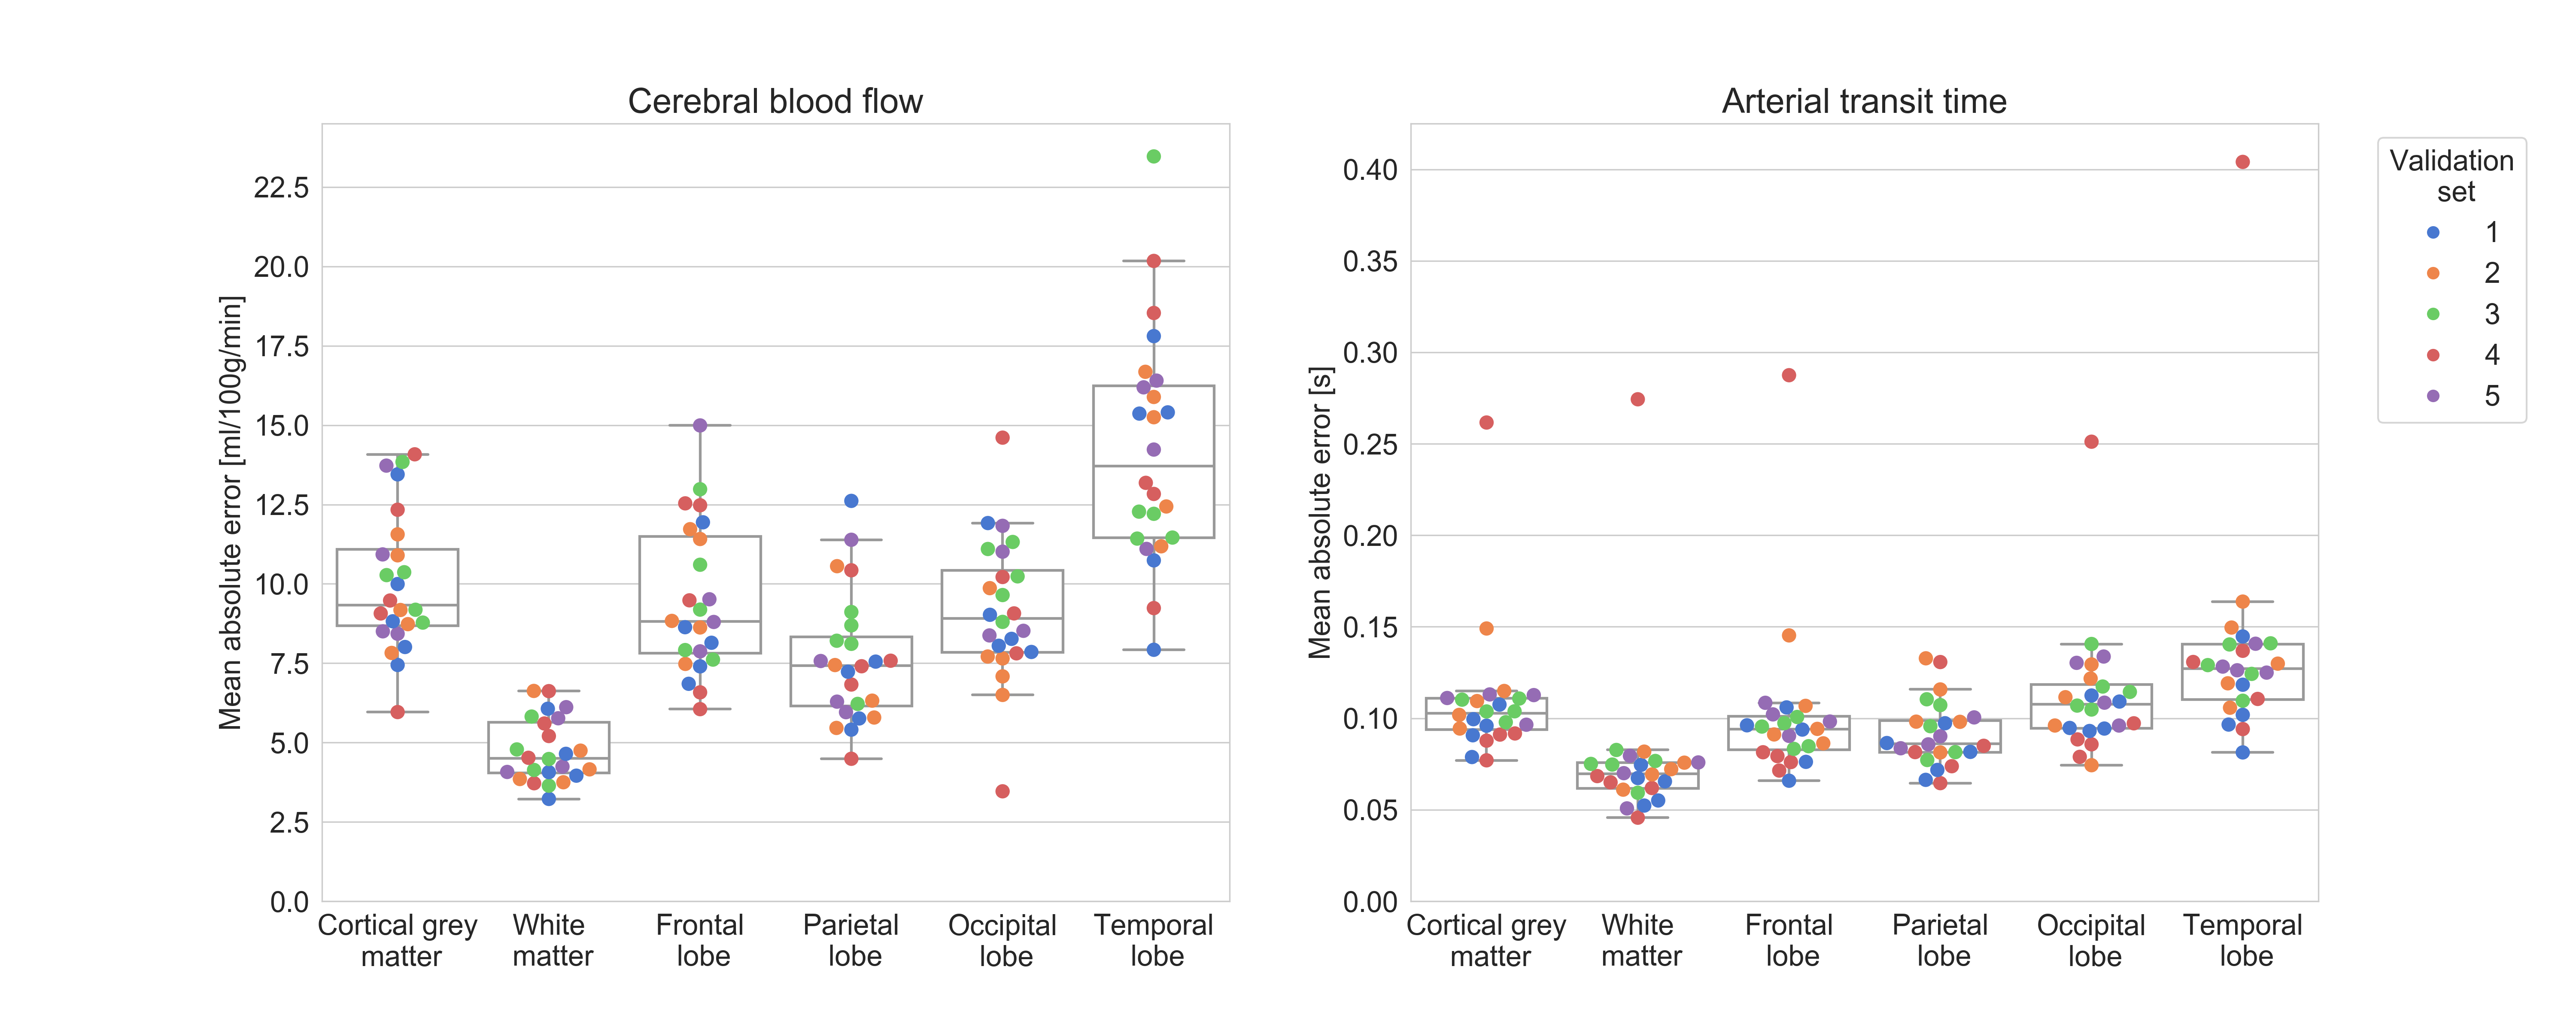
Figure 1. Mean absolute error of test data for each validation set. Colours indicate one of the five sets. Left: mean absolute error of CBF estimate. Right: mean absolute error of ATT estimate. The loss function minimized by our network was an average of normalized CBF and ATT errors.
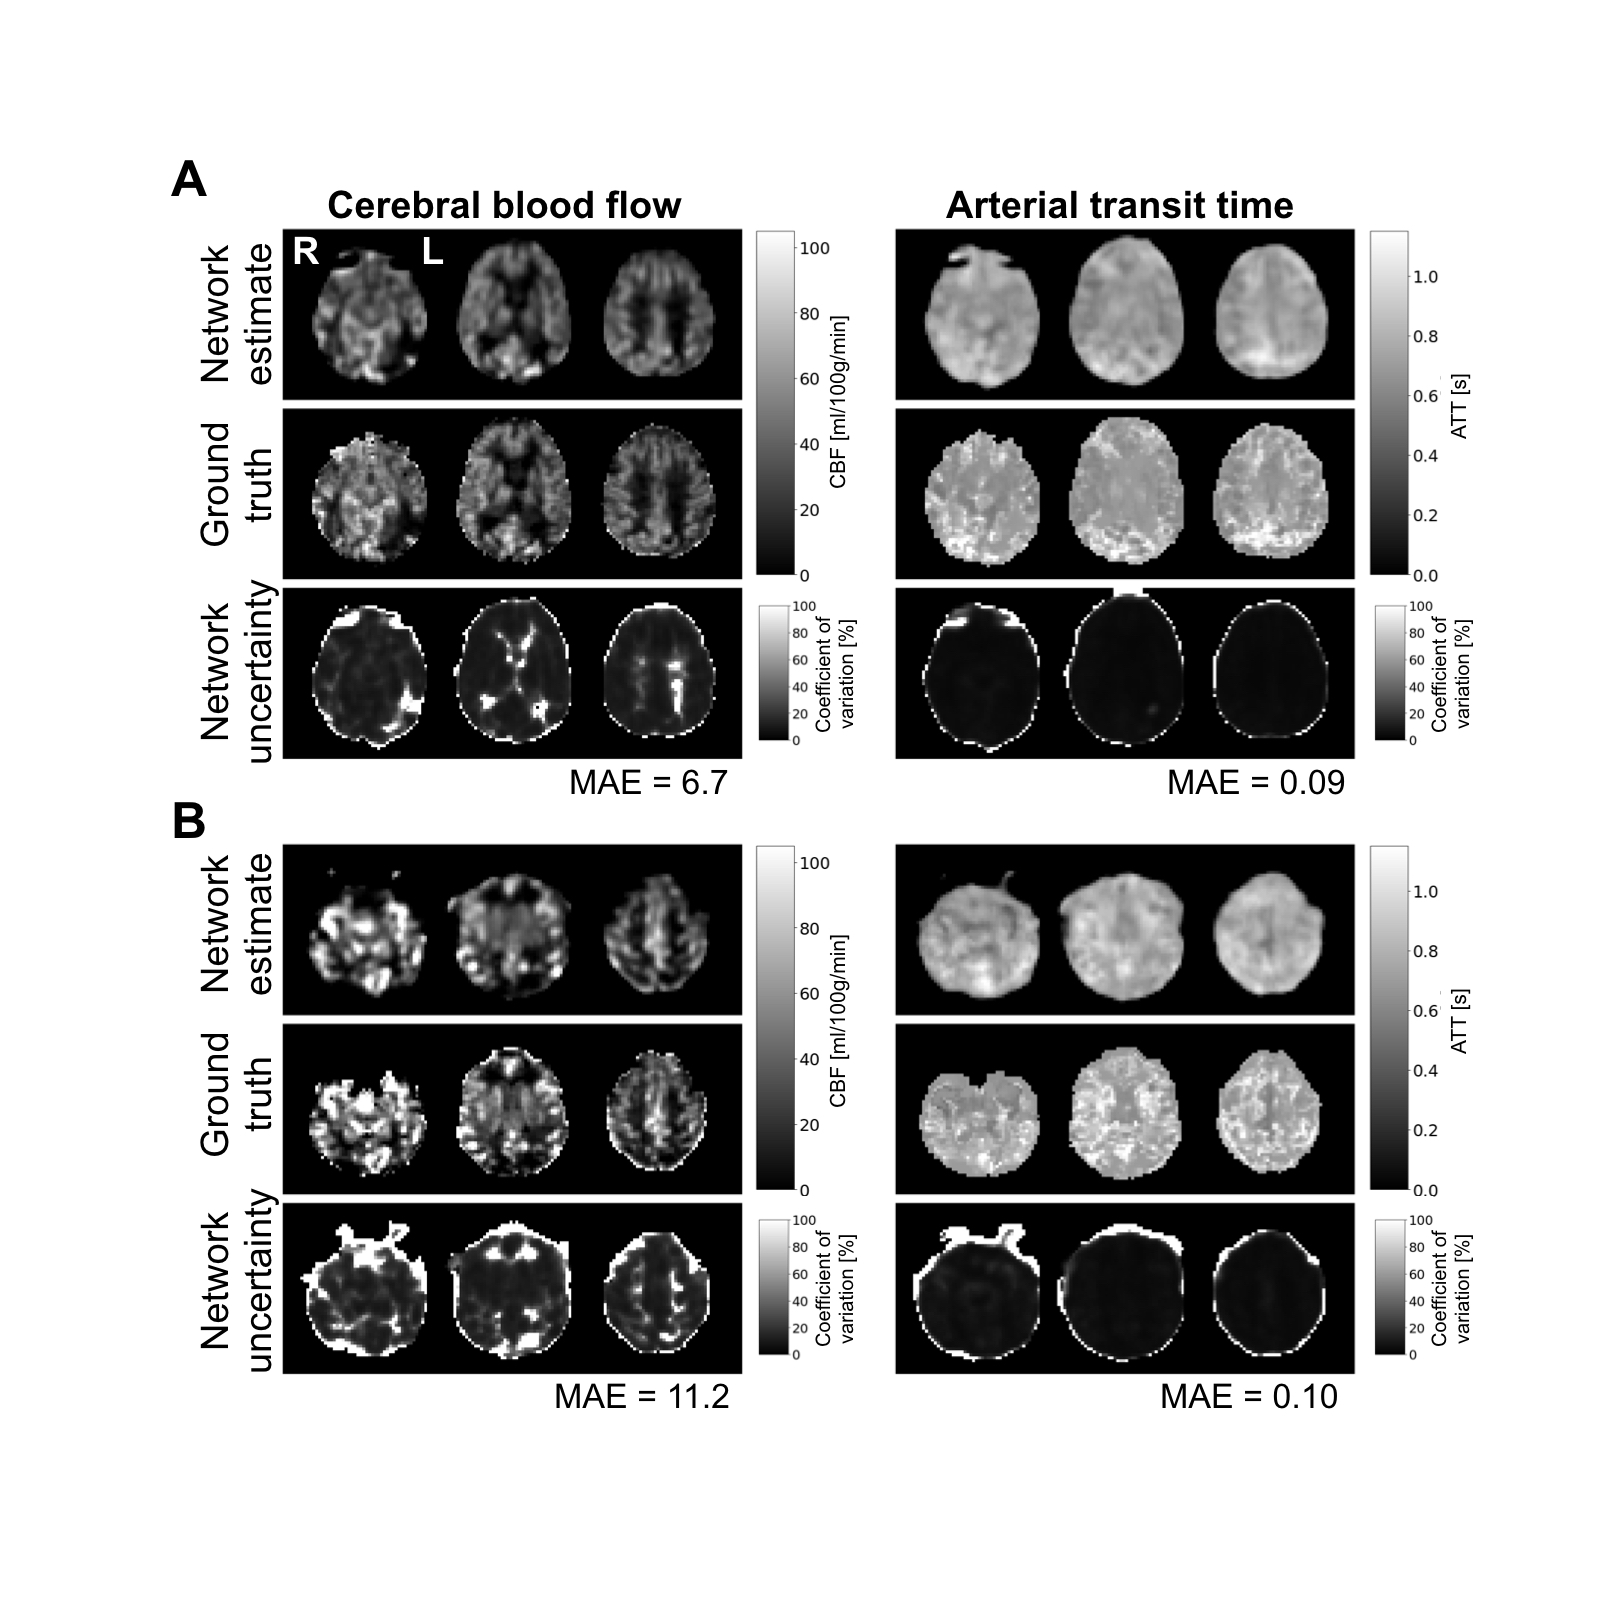
Figure 2. Network estimates, ground-truths, and uncertainty estimates for the individual with the lowest (A) and highest (B) composite CBF+ATT mean absolute error (MAE) from the first validation set. The left column shows CBF and the right column shows ATT. Each row displays three axial slices from the same image.
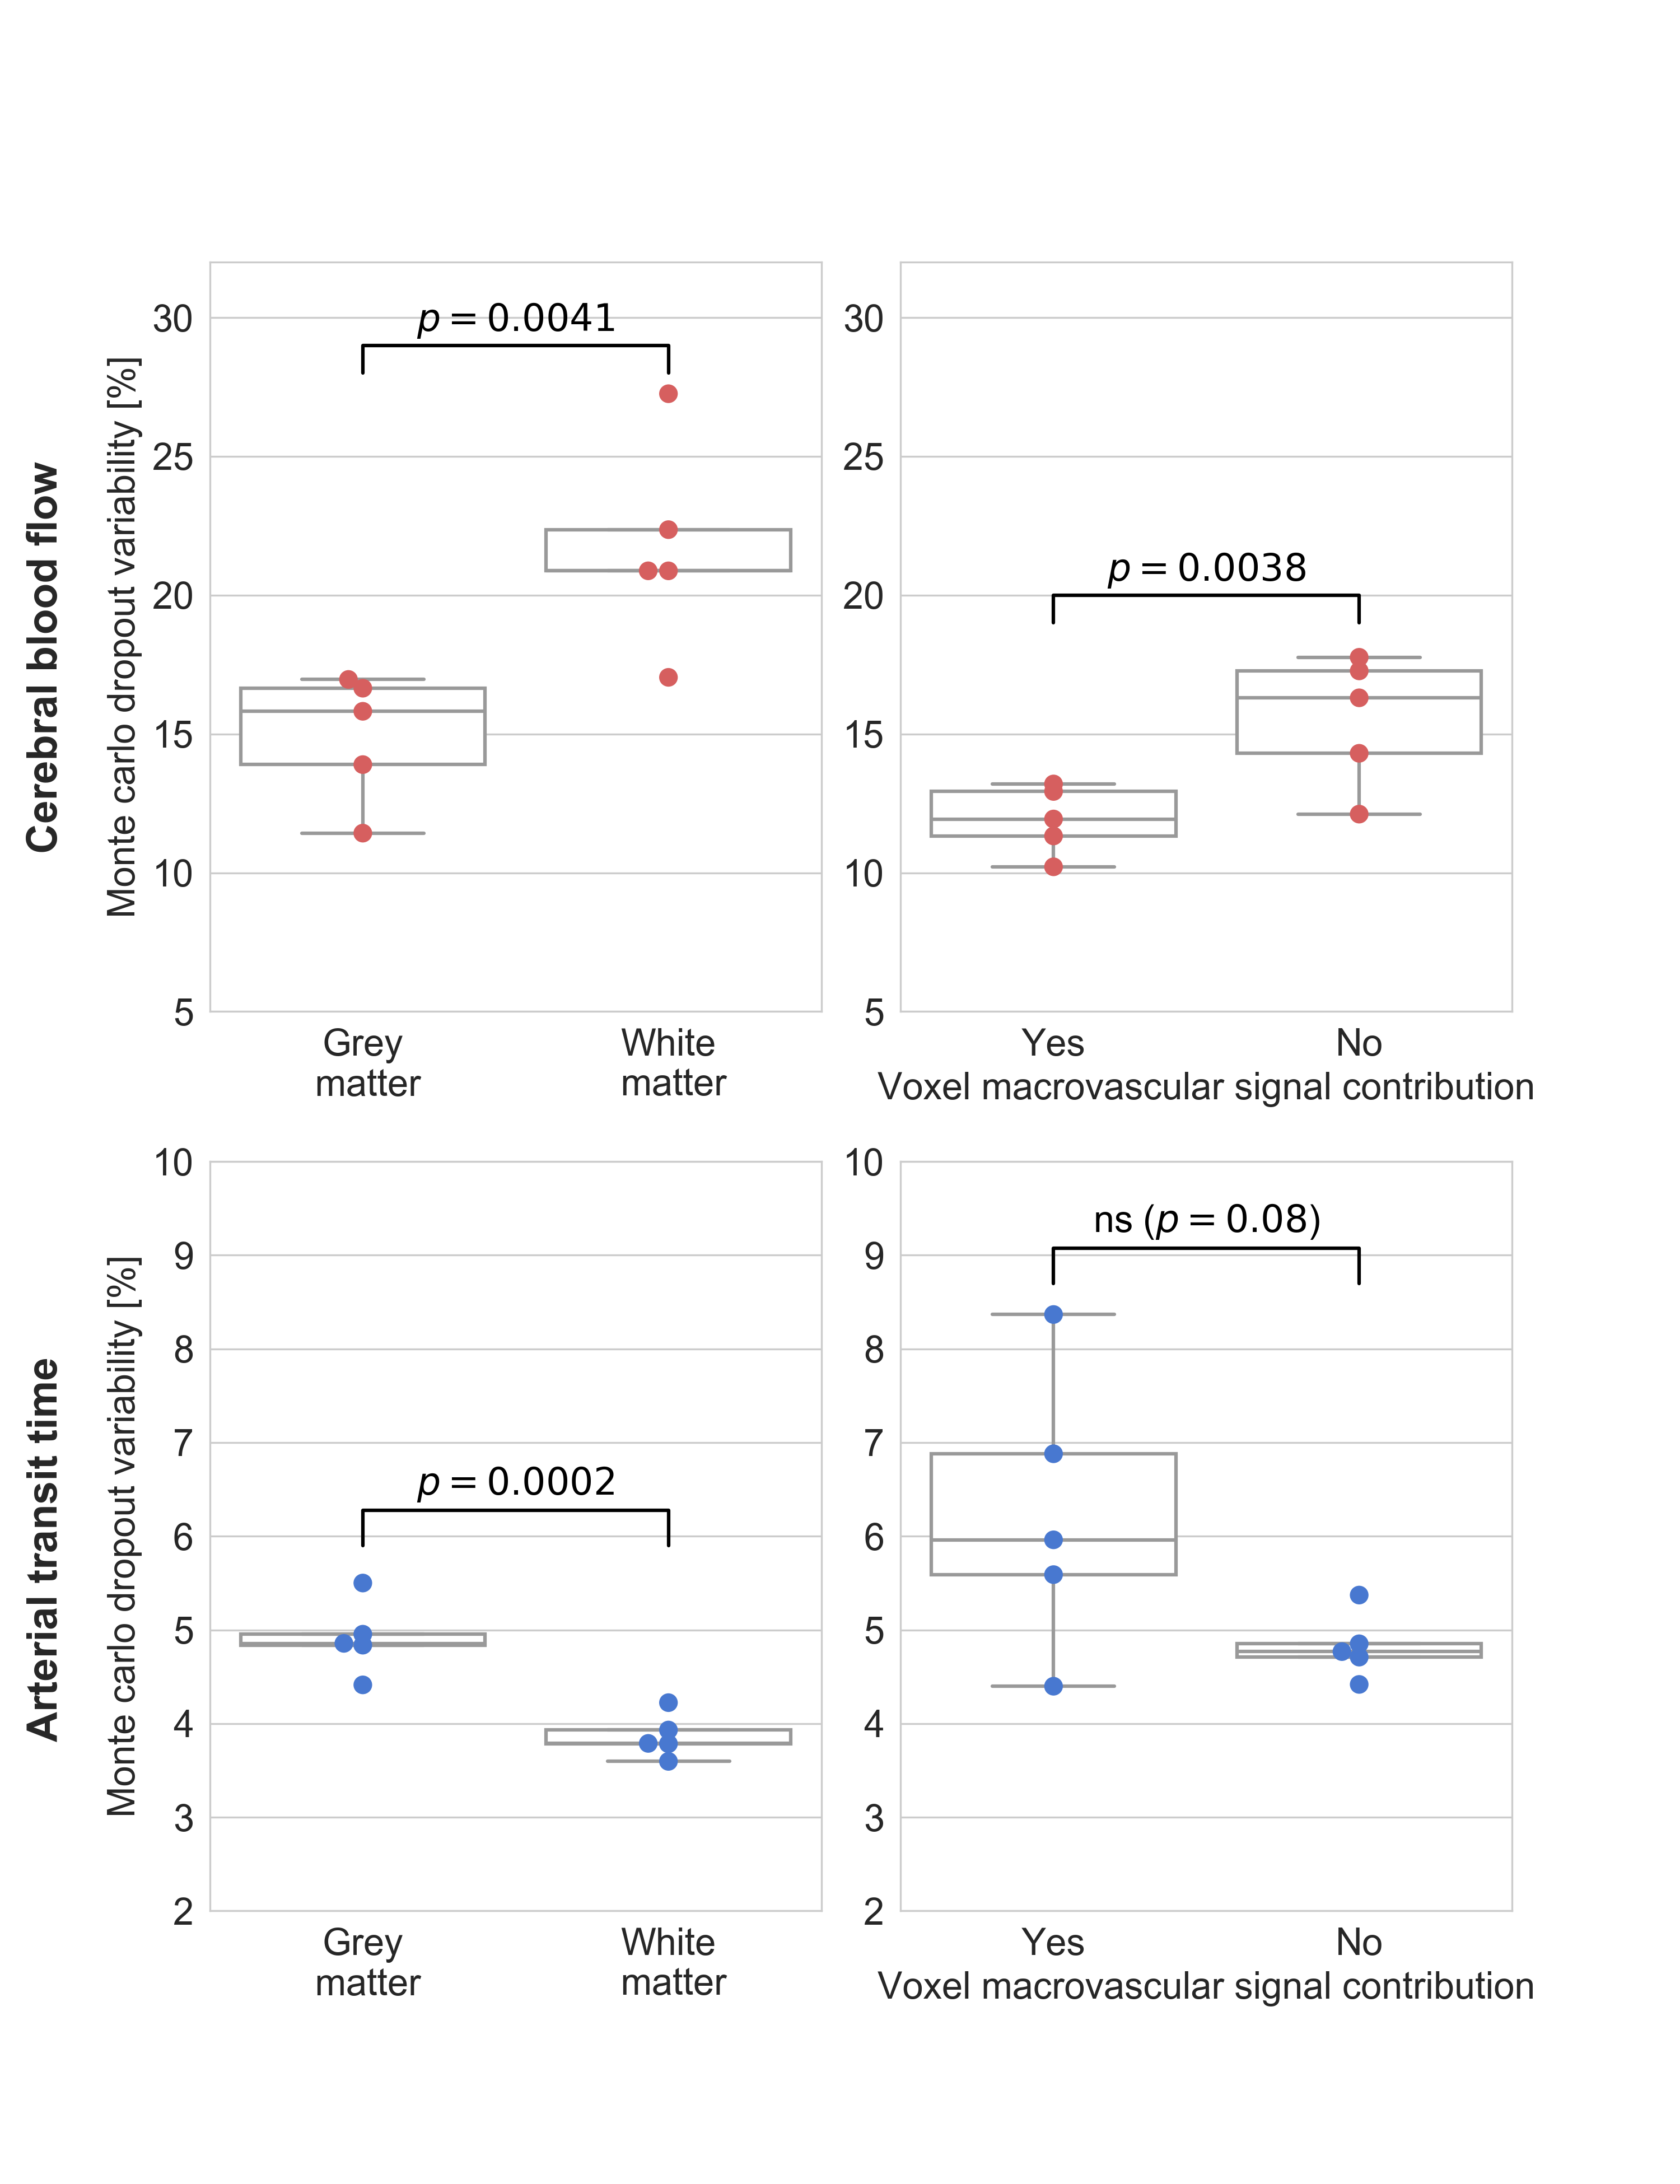
Figure 3. Comparison of CBF (top row) and ATT (bottom row) uncertainty heuristic between grey matter and white matter (left column), and between voxels with and without signal contribution from macrovasculature (right column). Statistical results are from two-sided paired t-tests. ns == not significant