1287
Estimating the capillary input function using deep learning approach for Dynamic Contrast-Enhanced MRI assessment of blood brain barrier1Sackler Institute of Graduate Biomedical Science,NYU School of Medicine, New York, NY, United States, 2Radiology, Center for Advanced Imaging Innovation and Research, New York, NY, United States, 3Icahn School of Medicine at Mount Sinai, New York, NY, United States, 4Center for Advanced Imaging Innovation and Research, New York, NY, United States, 5Center for Biomedical Imaging, NYU, New York, NY, United States
Synopsis
This study proposes a deep learning approach of estimating the capillary level of input function for kinetic model analysis on dynamic contrast enhanced (DCE)-MRI data. Our deep-learning network was trained with the numerically synthesized data generated with a wide range of contrast kinetic dynamics with different arterial input function (AIF). We hypothesize that the voxel level capillary input functions would be more accurate input functions for pharmacokinetic analysis. This hypothesis was tested with the DCE-MRI data of healthy subjects.
Purpose
Dynamic contrast enhanced (DCE)-MRI have been used as a quantitative tool for investigating tissue microstructures asociated with various brain pathologies, such as brain tumor, stroke, and multiple sclerosis.1 When analyzing the DCE-MRI data, pharmacokinetic models (PKM), such as the extended-Tofts or the Patlak model, are often used to estimate the pharmacokinetic (PK) parameters that would quantify the micro-environment of tissues. All of these PKM require an input function, generally referred as the arterial input function (AIF). Most studies typically use a global AIF (Ca), either measured at the artery level from the data or from a population-based model. This selection of AIF is often very difficult to reproduce, and the variability in the AIF directly result in errors in estimation of PK parameters.2 Furthermore, using a global AIF assumes the same input function for all voxels in the tissue, which may not hold true if the model does not incorporate the flow with delay and dispersion from the artery to the tissue compartment. This study endeavors to develop a deep learning network that could predict the pixel-level capillary input function (CIF) (Cp) to aid more accurate PK estimation without using AIF. The proposed method was applied to assess the blood brain barrier (BBB) permeability.Methods
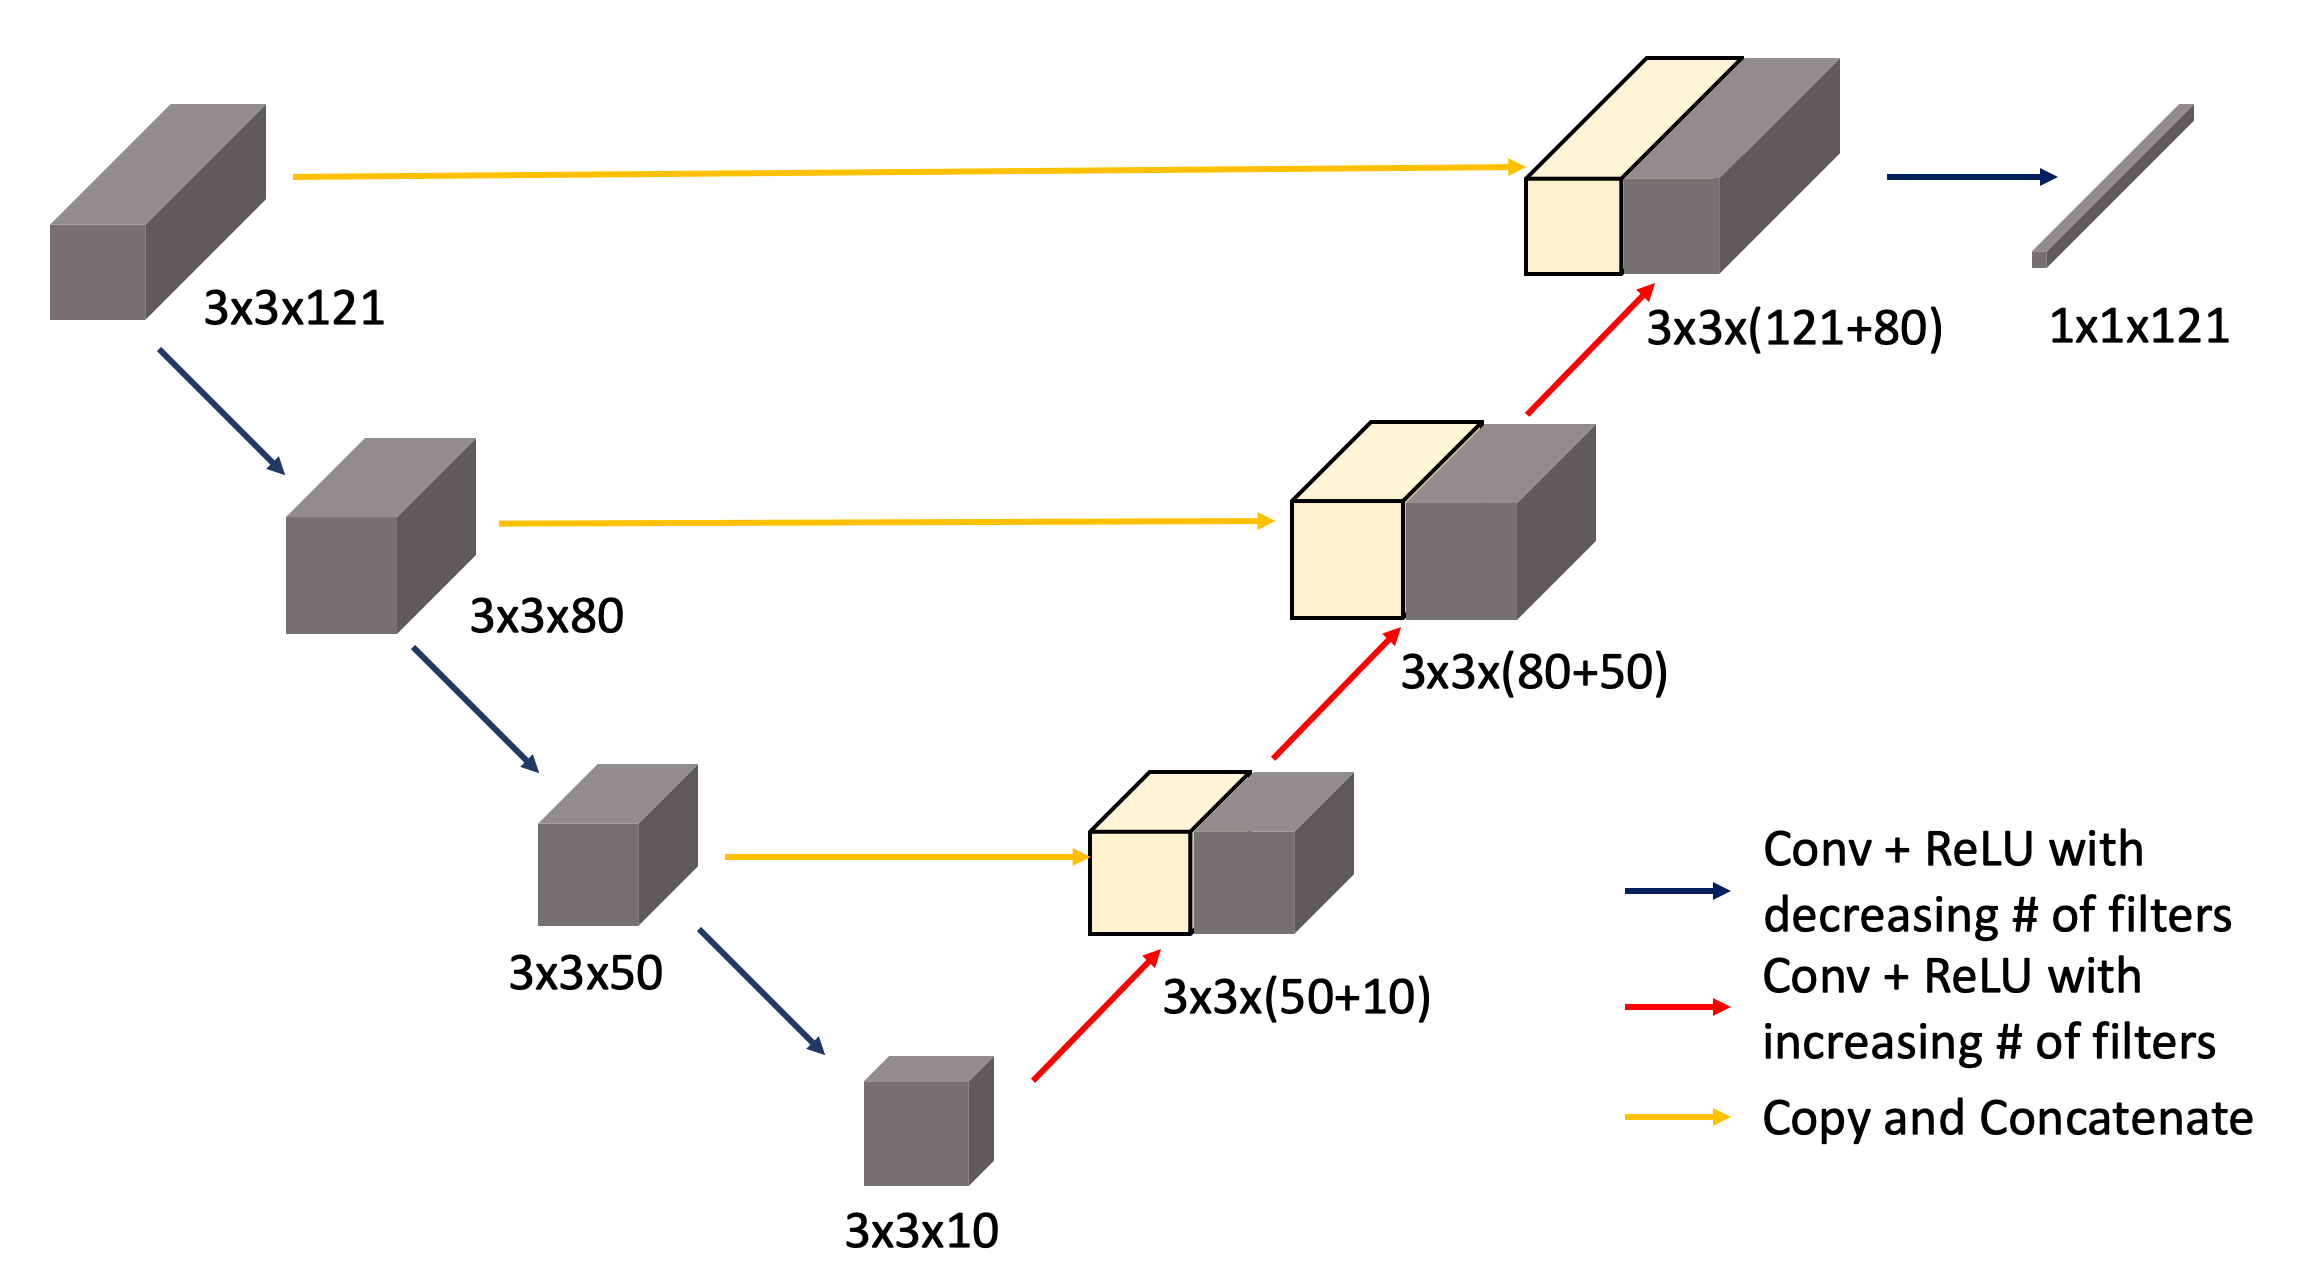
Deep Learning Network: A U-Net like structure was adopted to estimate the CIF with a set of DCE-MRI data from a small patch as the input. As depicted in Figure 1, there are 3 blocks of convolutional layers paired with ReLU activation for descending direction, where the number of filters decrease. Then in the ascending track, the skipping connections were made just like in the original U-Net structure. The training data were synthesized using a PKM with a wide range of PKM parameters and different variations of the population-based AIF suggested by Parker et.al.3 First, the CIF was calculated, assuming a single compartment model with transfer from the artery to the capillary. This was served as the ground-truth when training the network. Then the extended Tofts model4 was used to simulate 10-min long tissue dynamics for a small patch with the size of 3-by-3 voxels. For each patch, specific tissue type such as the gray-matter, white-matter, and randomly placed vascular voxels and its' associated PK value were assigned in accordance with the values found in literatures. The total of 50,000 patches were generated, of which 45,000 were used as the training data and 5,000 patches were used as the validation data.GRASP-Pro: The DCE-MR signal in a normal brain tissue shows only a small enhancement, due to the intact BBB. Measurement of such small enhancement is not trivial, since the low enhancement is often obscured by the noise and hinders the PK estimation. The GRASP-Pro, recently developed by Li. et al5, has been adopted to improve the temporal characteristics. The GRASP-Pro approach improves the reconstructed image quality using the temporal bases selected from the principal component analysis of low-resolution GRASP reconstruction.
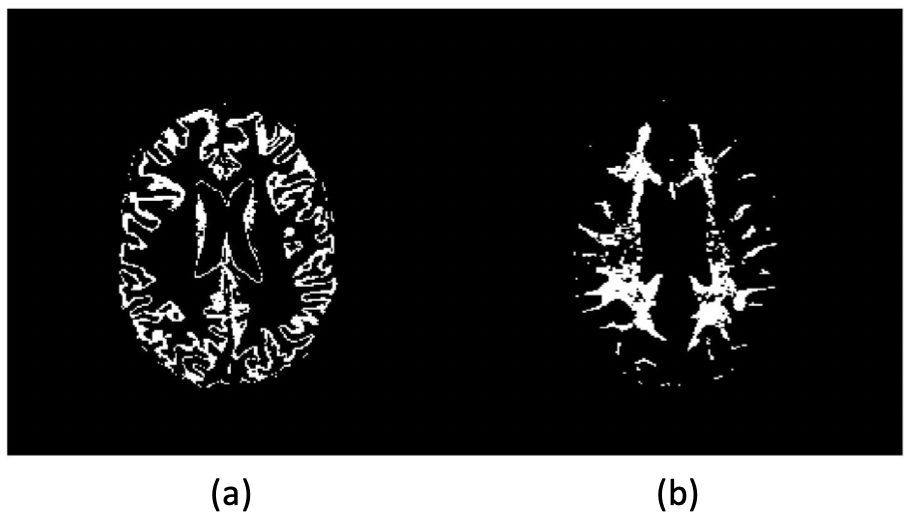
Clinical Study: To evaluate the performance of the network, we compared the PK estimation from the DCE-MRI data acquired at 3T. Healthy volunteers (n=6; ages of 30~78) were recruited for DCE-MRI scan of 28 minutes long. The data were cropped to the first 10 minute, to match the similar temporal window as the training data and also to assess whether the data with a shorter duration can be used to measure the BBB permeability. The raw k-space data were reconstructed with GRASP-Pro. The Cp for each voxel was predicted using the trained deep learning network. For the PKM analysis, the graphical Patlak model (GPM)6 was used to estimate the volume fraction of plasma (Vp) and the permeability surface area product (PS). The GPM analysis was conducted with both Cp from the trained network and Ca measured from the middle cerebral artery from the image. From the estimated Vp and PS maps, the average plasma volume fraction and PS of the gray and white matters were calculated using the masks shown in Figure 3.
Result
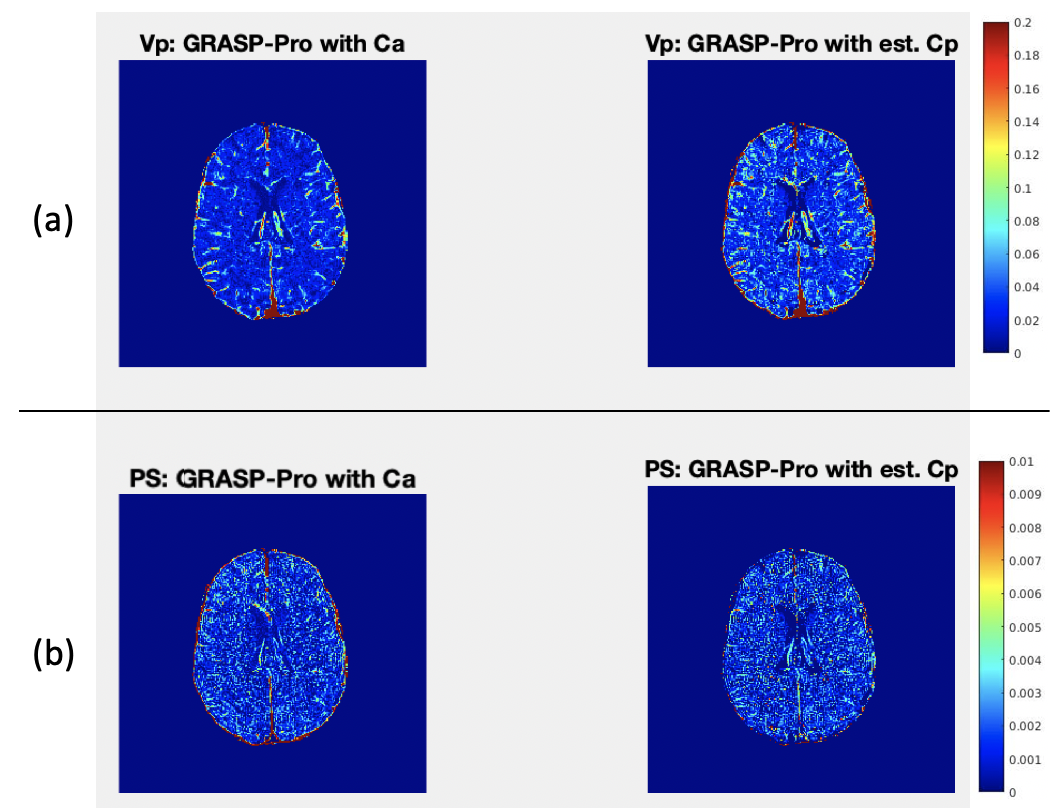
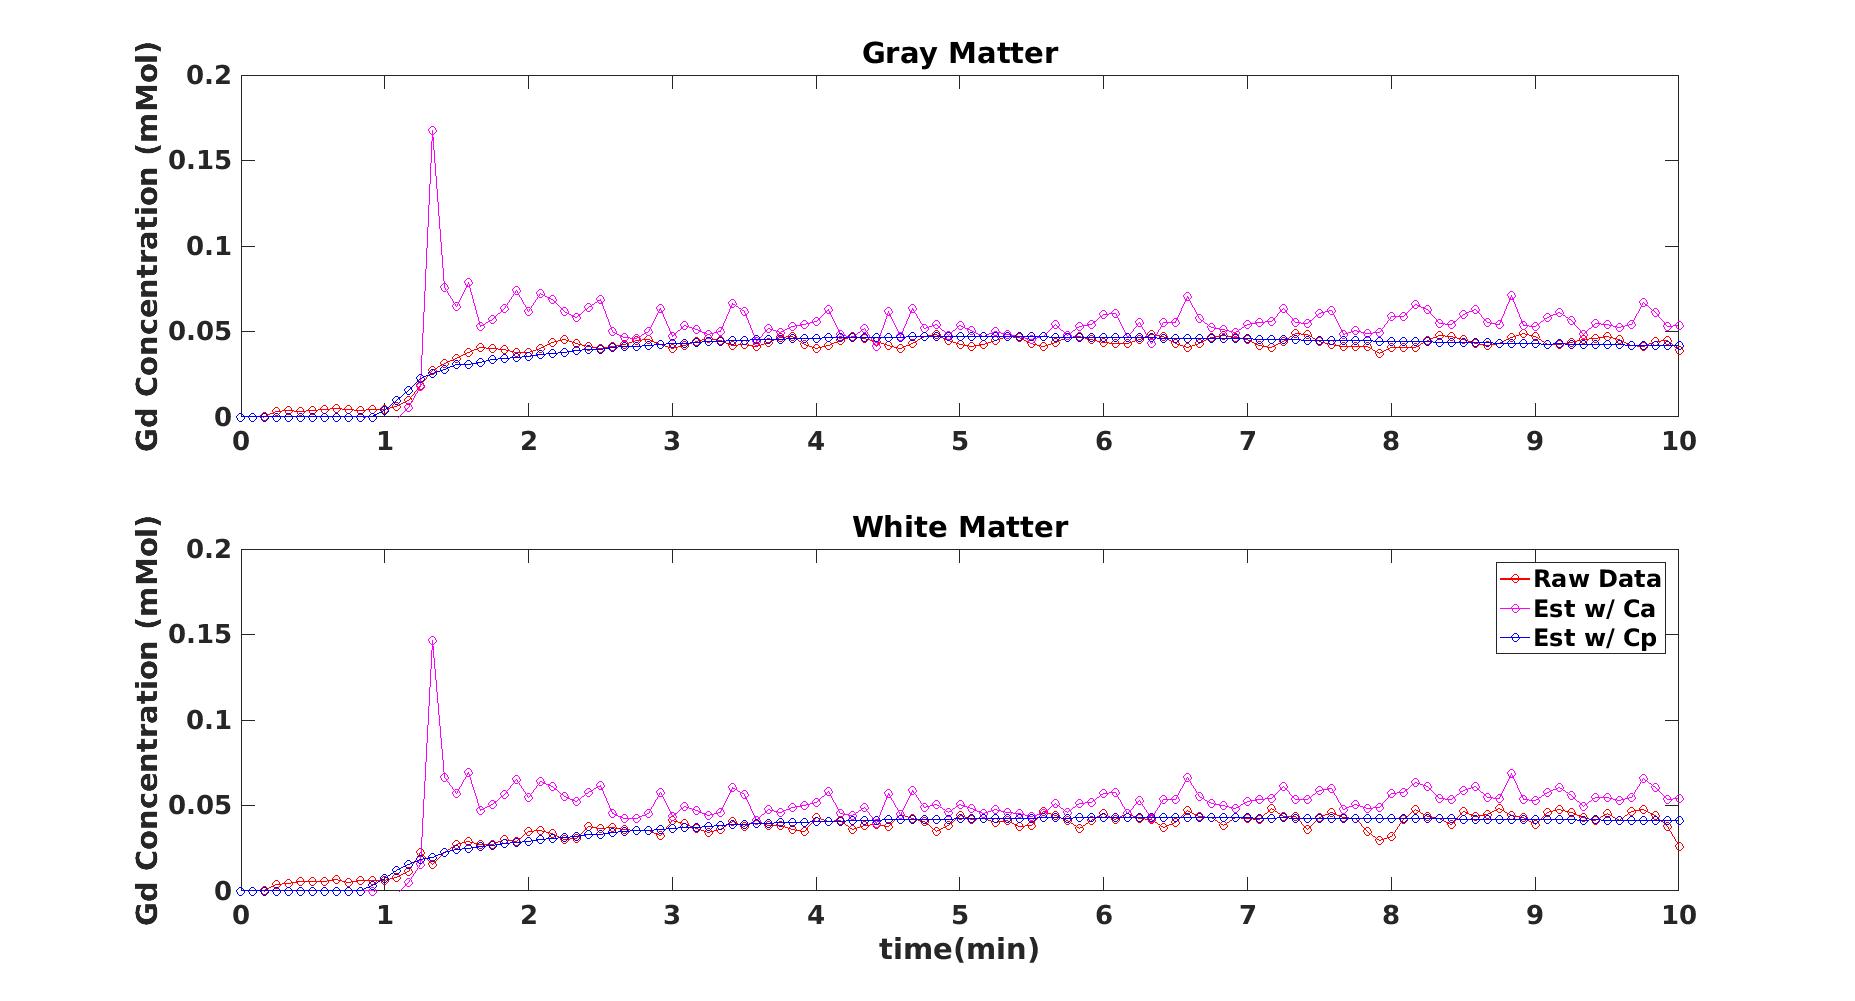
Figure 2 shows the estimated Vp maps using both Ca and predicted Cp. The Vp values estimated with Ca seems to be underestimated than those values estimated with Cp. The average Vp values of both GM and WM are underestimated with Ca as compared to the literature values.7 In contrast, the GPM analysis with Cp, provides the blood volume closer to the literature values. Figure 4 demonstrates a sample fit of GM and WM voxel. The fit using Cp shows clearly a better fit than the fit using Ca.Discussion and Conclusion
The proposed deep-learning network to estimate the CIF has demonstrated promising performance for accurately estimating PK parameters. As expected, the global AIF measured in the artery is not valid for the assumptions underlying in the some of the PKM, such as the Patlak model, that the GBCA concentration in the capillary is same as AIF. This assumption is more challenged when the scan time is reduced, as demonstrated in this study. The proposed deep-learning based approach of generate CIF also removes the need to measure AIF, which can reduce the variability in the outcome and yields higher reproducibility.Acknowledgements
Alzheimer’s Association Grant AARF-17-533484, NIH R01CA160620, R01CA219964, and UG3CA228699.References
1. Heye AK, Culling RD, Valdes Hernandez Mdel C, Thrippleton MJ, Wardlaw JM. Assessment of blood-brain barrier disruption using dynamic contrast-enhanced MRI. A systematic review. NeuroImage Clinical. 2014;6:262-74. doi: 10.1016/j.nicl.2014.09.002. PubMed PMID: 25379439; PubMed Central PMCID: PMC4215461.
2. Azahaf M, Haberley M, Betrouni N, Ernst O, Behal H, Duhamel A, et al. Impact of arterial input function selection on the accuracy of dynamic contrast‐enhanced MRI quantitative analysis for the diagnosis of clinically significant prostate cancer. Journal of Magnetic Resonance Imaging. 2016;43(3):737-49.
3. Parker GJ, Roberts C, Macdonald A, Buonaccorsi GA, Cheung S, Buckley DL, Jackson A, Watson Y, Davies K, Jayson GC. Experimentally-derived functional form for a population-averaged high-temporal-resolution arterial input function for dynamic contrast-enhanced MRI. Magnetic resonance in medicine. 2006;56(5):993-1000. doi: 10.1002/mrm.21066. PubMed PMID: 17036301.
4. Tofts PS. Modeling tracer kinetics in dynamic Gd‐DTPA MR imaging. Journal of magnetic resonance imaging. 1997 Jan;7(1):91-101.
5. Feng L, Wen Q, Huang C, Tong A, Liu F, Chandarana H. GRASP‐Pro: imProving GRASP DCE‐MRI through self‐calibrating subspace‐modeling and contrast phase automation. Magnetic resonance in medicine. 2020 Jan;83(1):94-108.
6. Patlak CS, Blasberg RG, Fenstermacher JD. Graphical evaluation of blood-to-brain transfer constants from multiple-time uptake data. J Cereb Blood Flow Metab. 1983;3(1):1-7. doi: 10.1038/jcbfm.1983.1. PubMed PMID: 6822610.
7. Leenders KL, Perani D, Lammertsma AA, Heather JD, Buckingham P, Jones T, Healy MJ, Gibbs JM, Wise RJ, Hatazawa J, Herold S. Cerebral blood flow, blood volume and oxygen utilization: normal values and effect of age. Brain. 1990 Feb 1;113(1):27-47.
Figures