1285
Predicting brain function from anatomy with geometric deep learning using high-resolution MRI data1School of Psychology, University of Queensland, Brisbane, Australia, 2Queensland Brain Institute, University of Queensland, Brisbane, Australia, 3Centre for Advanced Imaging, University of Queensland, Brisbane, Australia
Synopsis
Whether it be in a man-made machine or a biological system, form and function are often directly related. In the latter, however, this particular relationship is often unclear due to the intricate and involved nature of biology. Here we developed a geometric deep learning model capable of exploiting the actual structure of the cortex to learn the complex relationship between brain function and anatomy from structural and functional MRI data. Our model was not only able to predict the functional organization of human visual cortex from anatomical properties alone, but it was also able to predict nuanced variations across individuals.
Introduction
Deep learning has proven to be a powerful approach for predictive modeling. Until very recently, however, there has been no way to apply deep learning to any data not represented in a simple two- or three-dimensional Euclidean space. This has severely limited its potential, as a great deal of data is not best represented in such a regular domain. Fortunately, over the past few years there has been an effort to generalize deep neural networks to non-Euclidean spaces such as surfaces and graphs – with these techniques collectively being referred to as geometric deep learning1. Here we demonstrate the power of these algorithms by using them to predict brain function from anatomy using MRI data.Using geometric deep learning, we developed a neural network capable of predicting the detailed functional organization of the human visual hierarchy with unprecedented accuracy. The visual hierarchy is comprised of a number of different cortical visual areas, nearly all of which are organized retinotopically. That is, the spatial organization of the retina is maintained and reflected in each of these cortical visual areas. This retinotopic mapping is known to be similar across individuals; however, considerable inter-subject variation does exist, and this variation has been shown to be directly related to variability in cortical folding patterns and other anatomical features2,3. It was our aim, therefore, to develop a neural network capable of learning the complex relationship between the functional organization of visual cortex and the underlying anatomy.
Methods
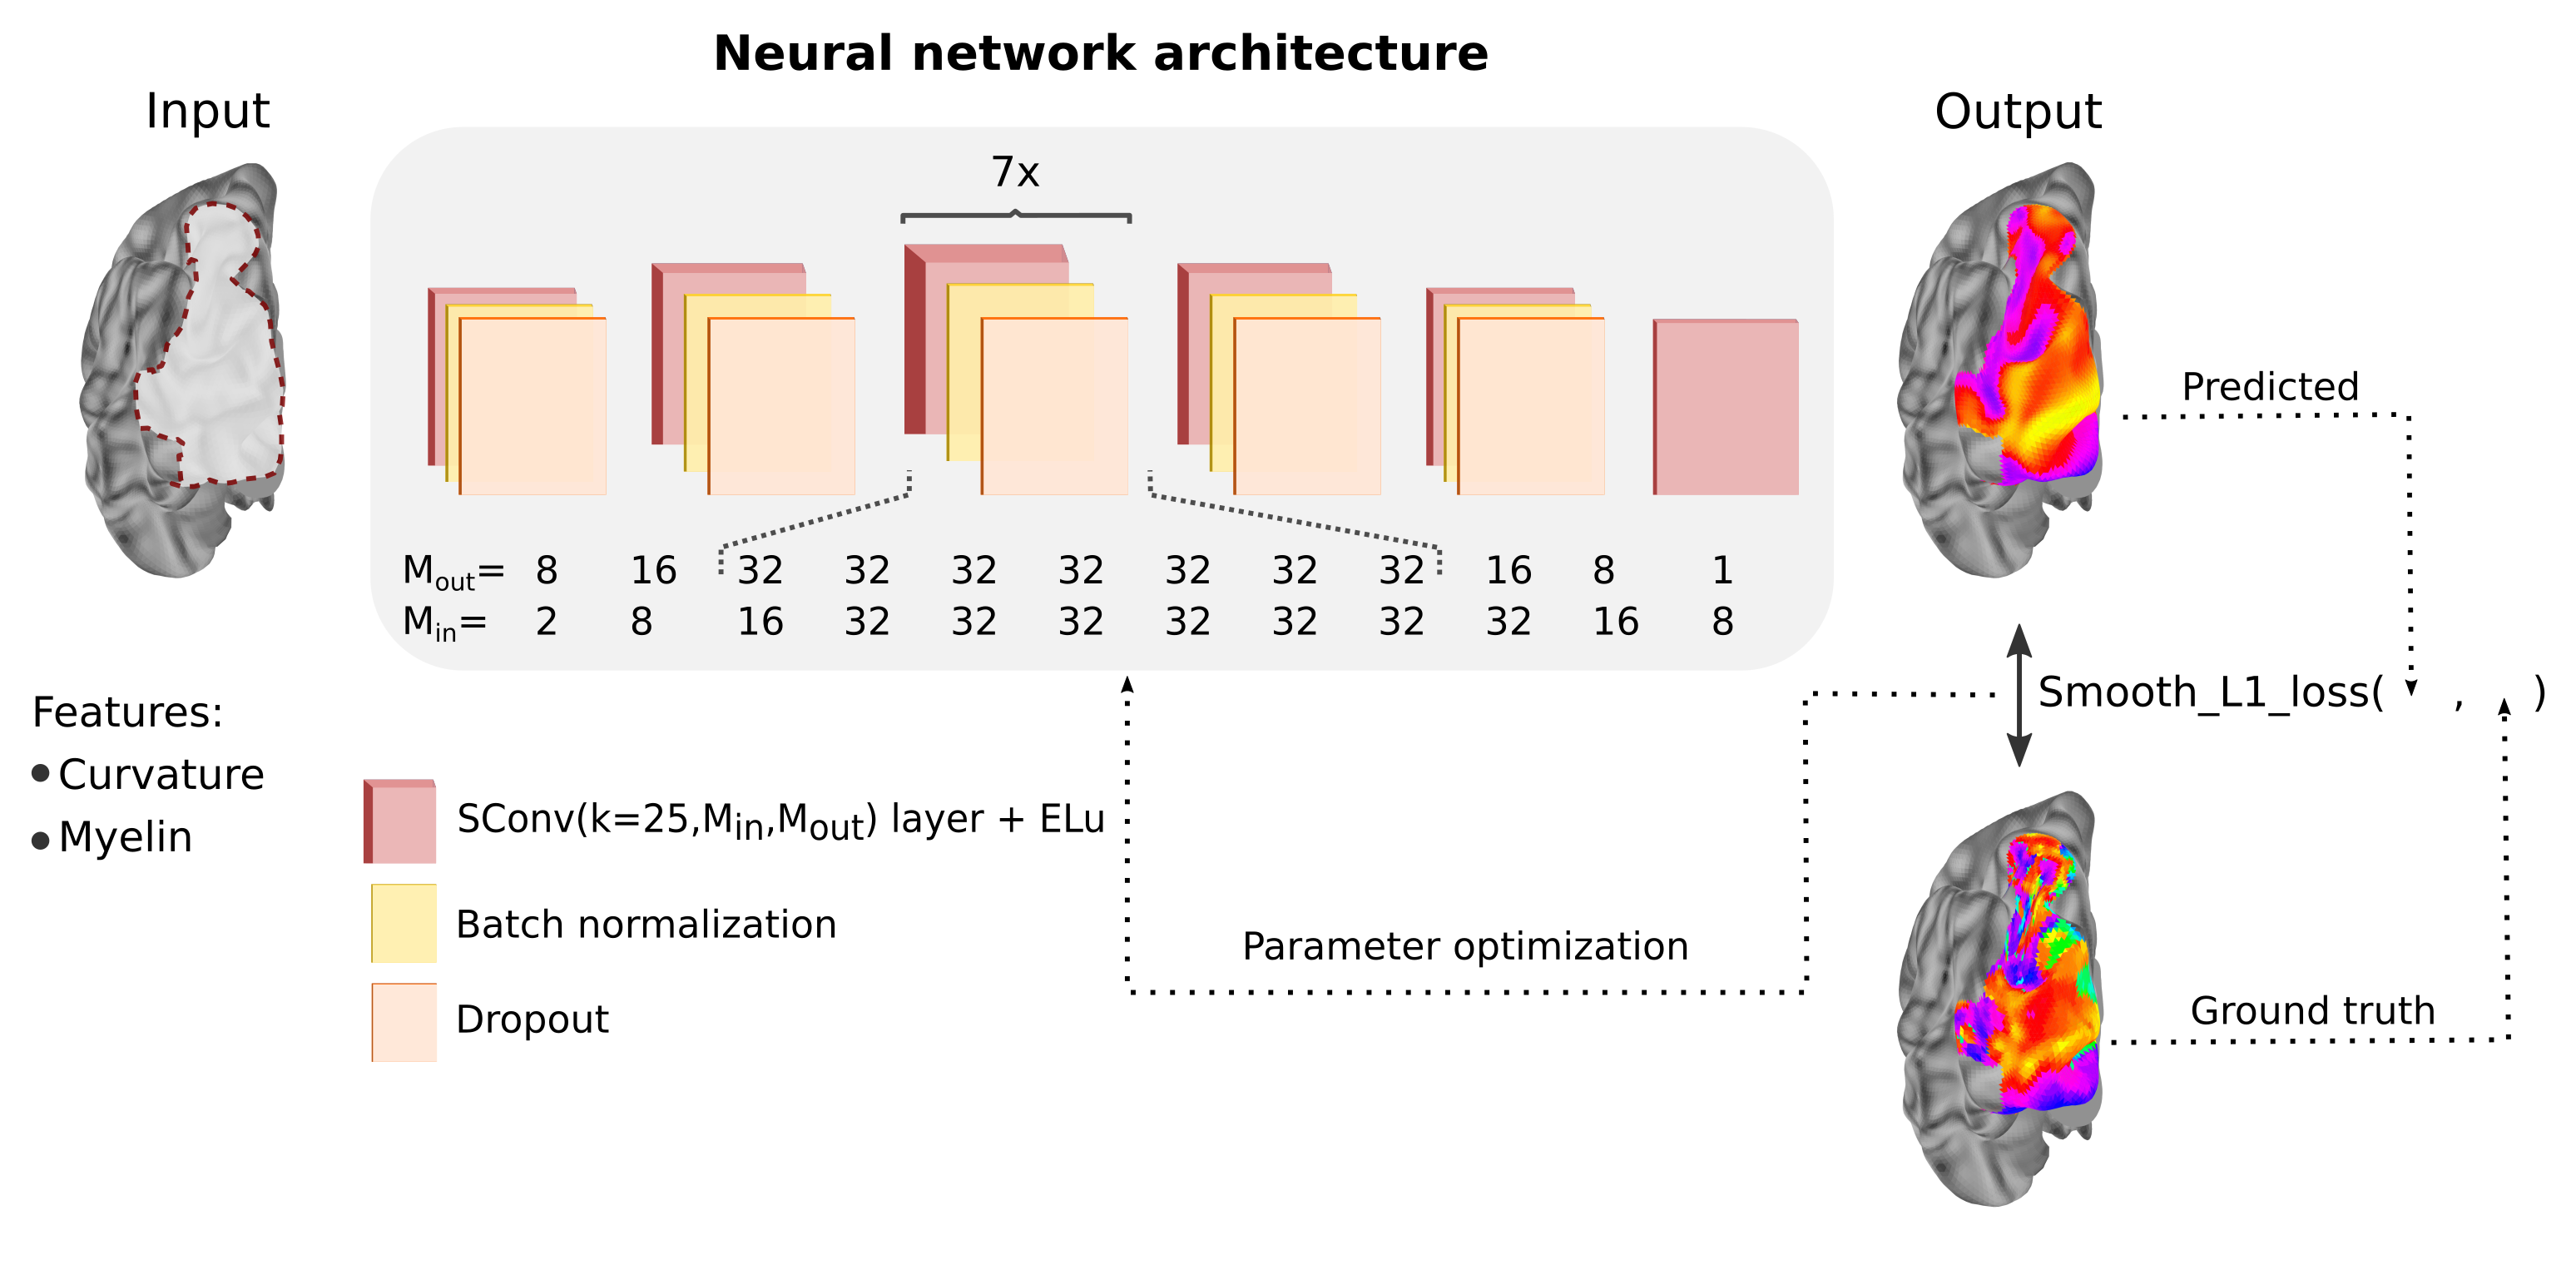
To build our geometric deep learning model, we used the open-source 7T MRI retinotopy dataset from Human Connectome Project4. This dataset includes 7T fMRI retinotopic mapping data of 181 participants along with their anatomical data represented on a cortical surface model. The data serving as input to our neural network included curvature and myelin values as well as the connectivity among vertices forming the cortical surface and their spatial disposition. The output of the network was the retinotopic mapping value (i.e., polar angle or eccentricity) for each vertex of the cortical surface model.Developing a deep learning model involved three main steps: (1) training the neural network, (2) hyperparameter tuning, and (3) testing the model. During training, the network learned the correspondence between the retinotopic maps and the anatomical features by exposing the network to each example in a training dataset. Model hyperparameters were then tuned by inspecting model performance using a development dataset. Finally, once the final model was selected, the network was tested by assessing the predicted maps for each individual in a test dataset (previously not seen by the network nor the researchers). Models were implemented using Python 3.7.3, Pytorch 1.2.0, and geometric PyTorch5, a geometric deep learning extension of PyTorch. Training was performed using NVIDIA Tesla V100 Accelerator units.
Our final model included 12 spline-based convolution layers6 (Figure 1), interleaved by batch normalization and dropout. We trained our model for 200 epochs with batch size of 1, learning rate at 0.01 for 100 epochs and that was then adjusted to 0.005, using Adam optimizer. Our models’ learning objective was to reduce the difference between predicted retinotopic map and ground truth. This mapping objective is measured by the smooth L1 loss function. Models were optimized to concomitantly reduce error (difference between predicted map and ground truth) and increase individual variability (difference between predicted maps).
Results
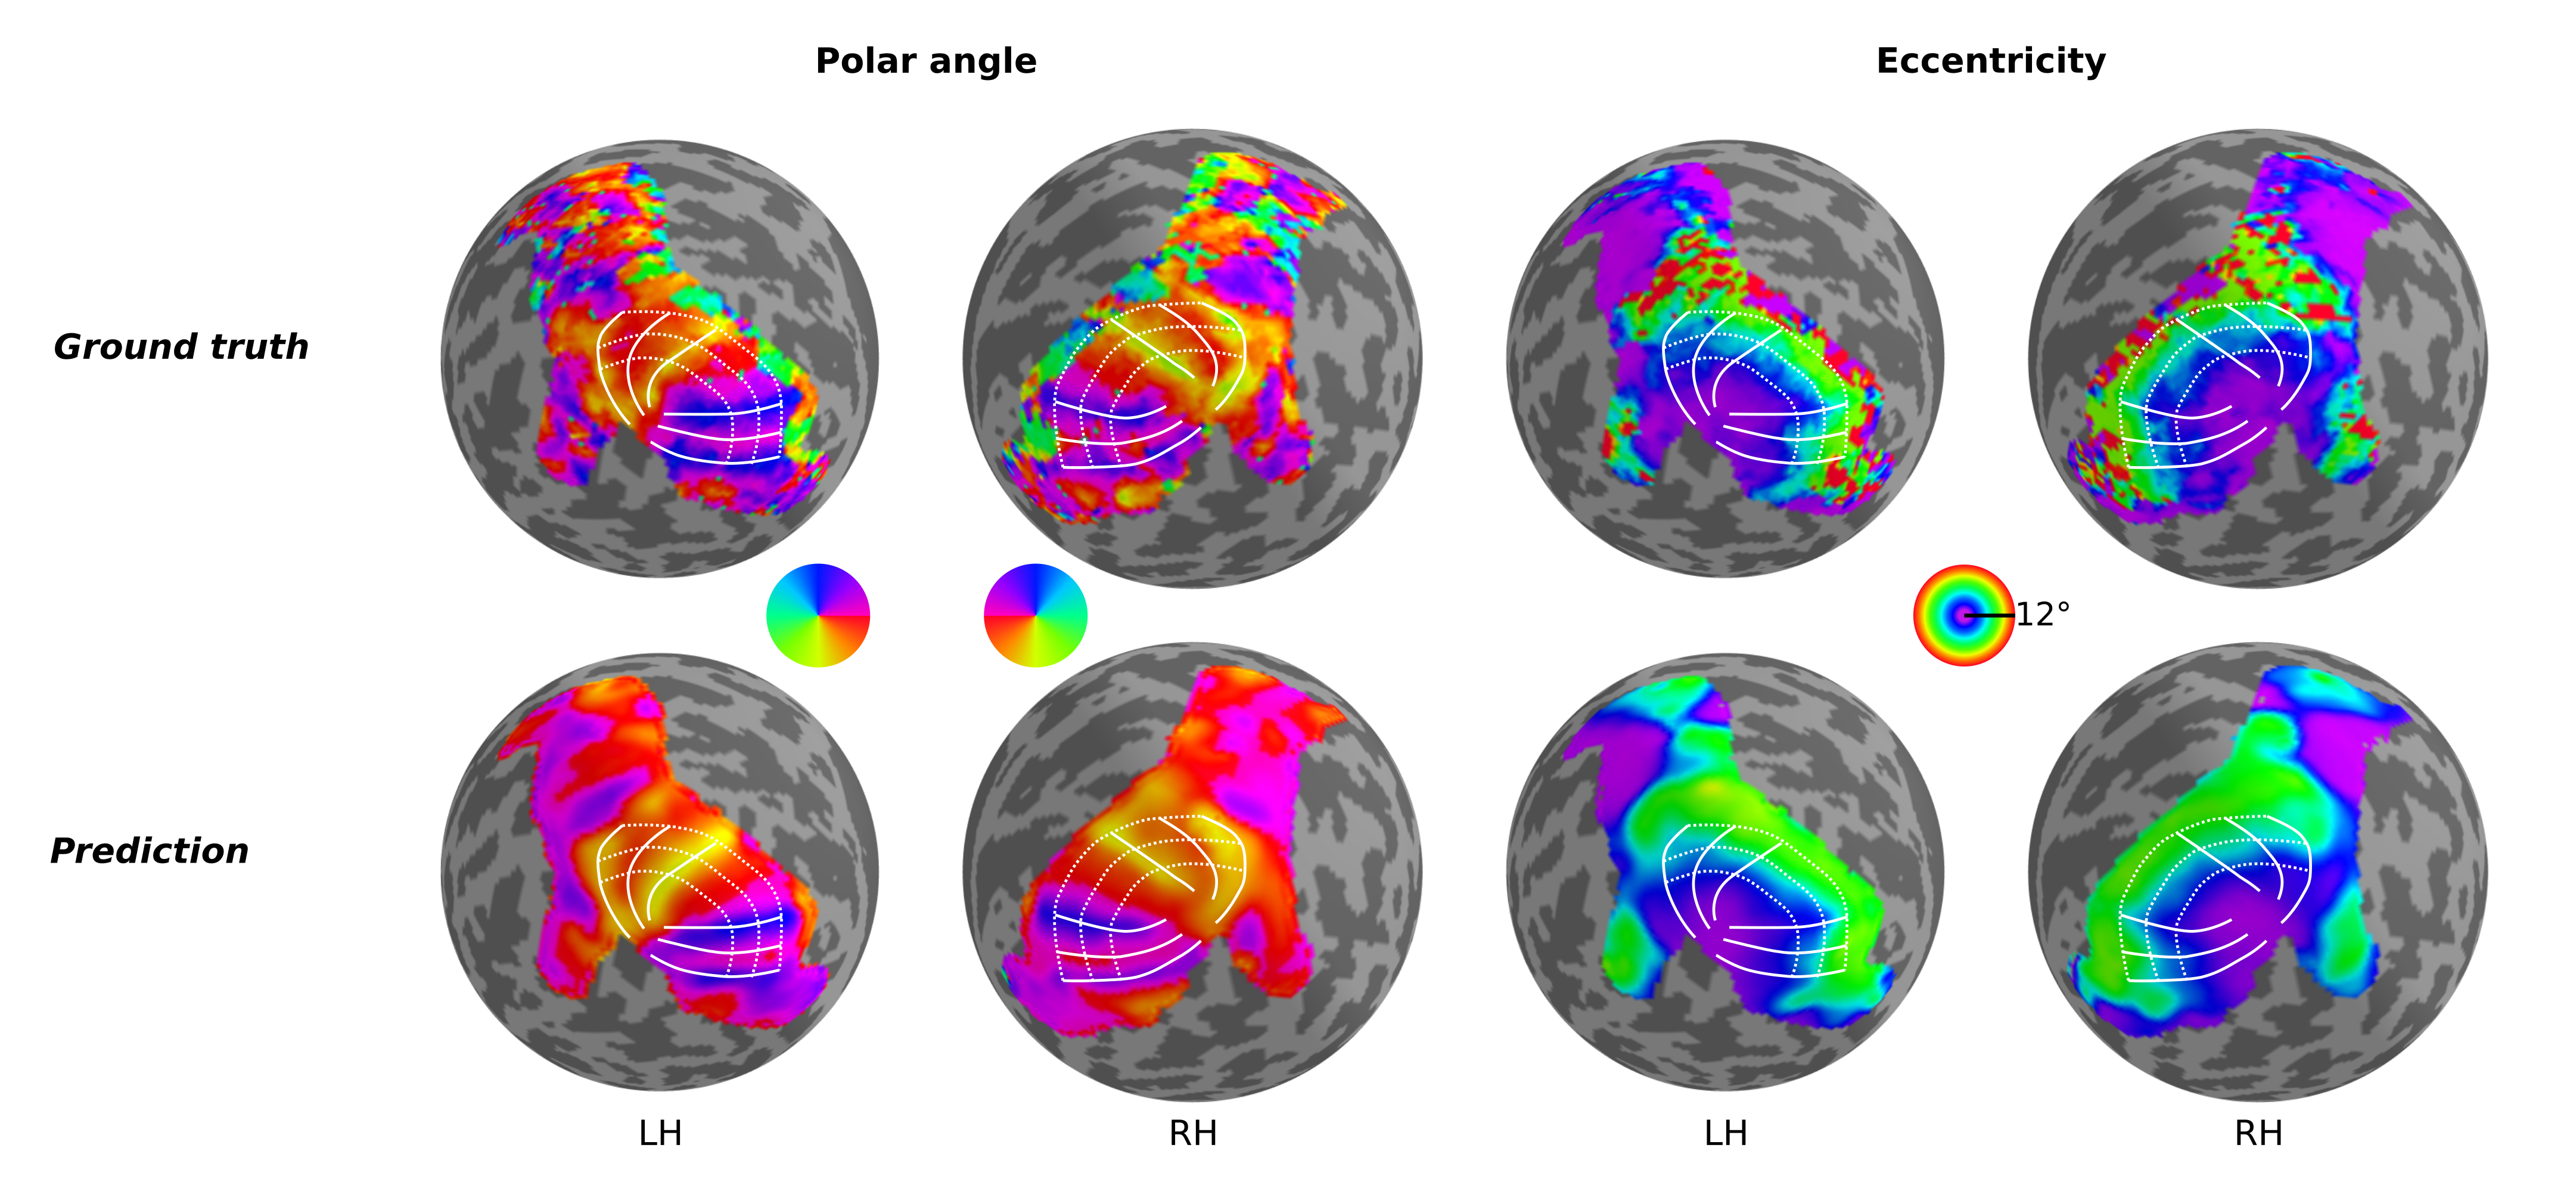
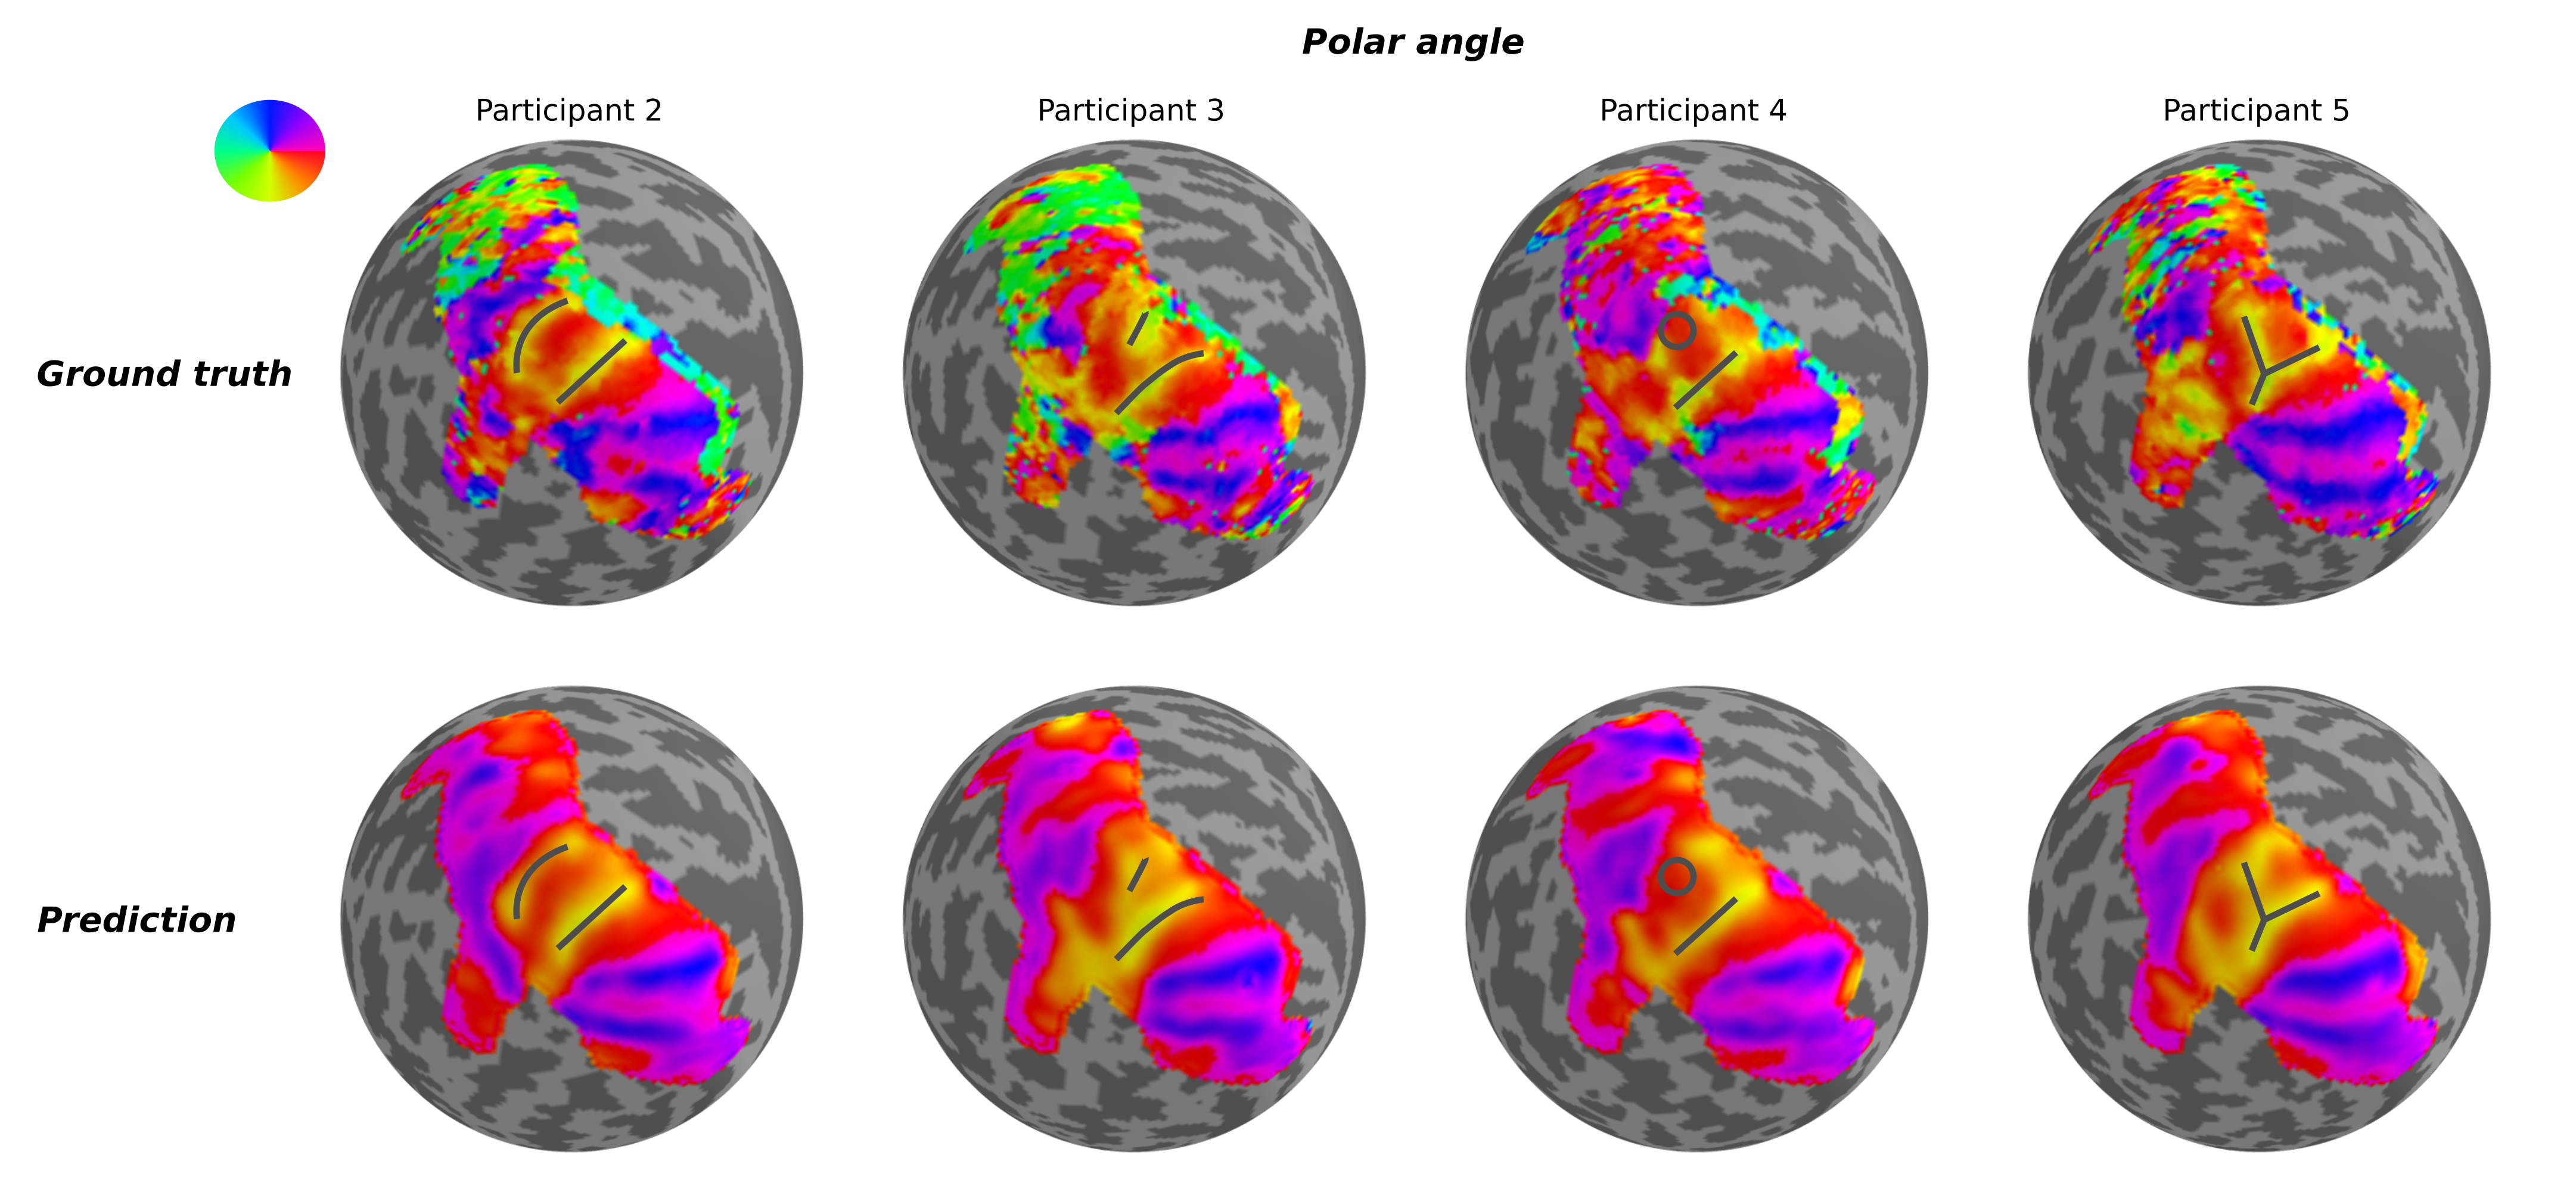
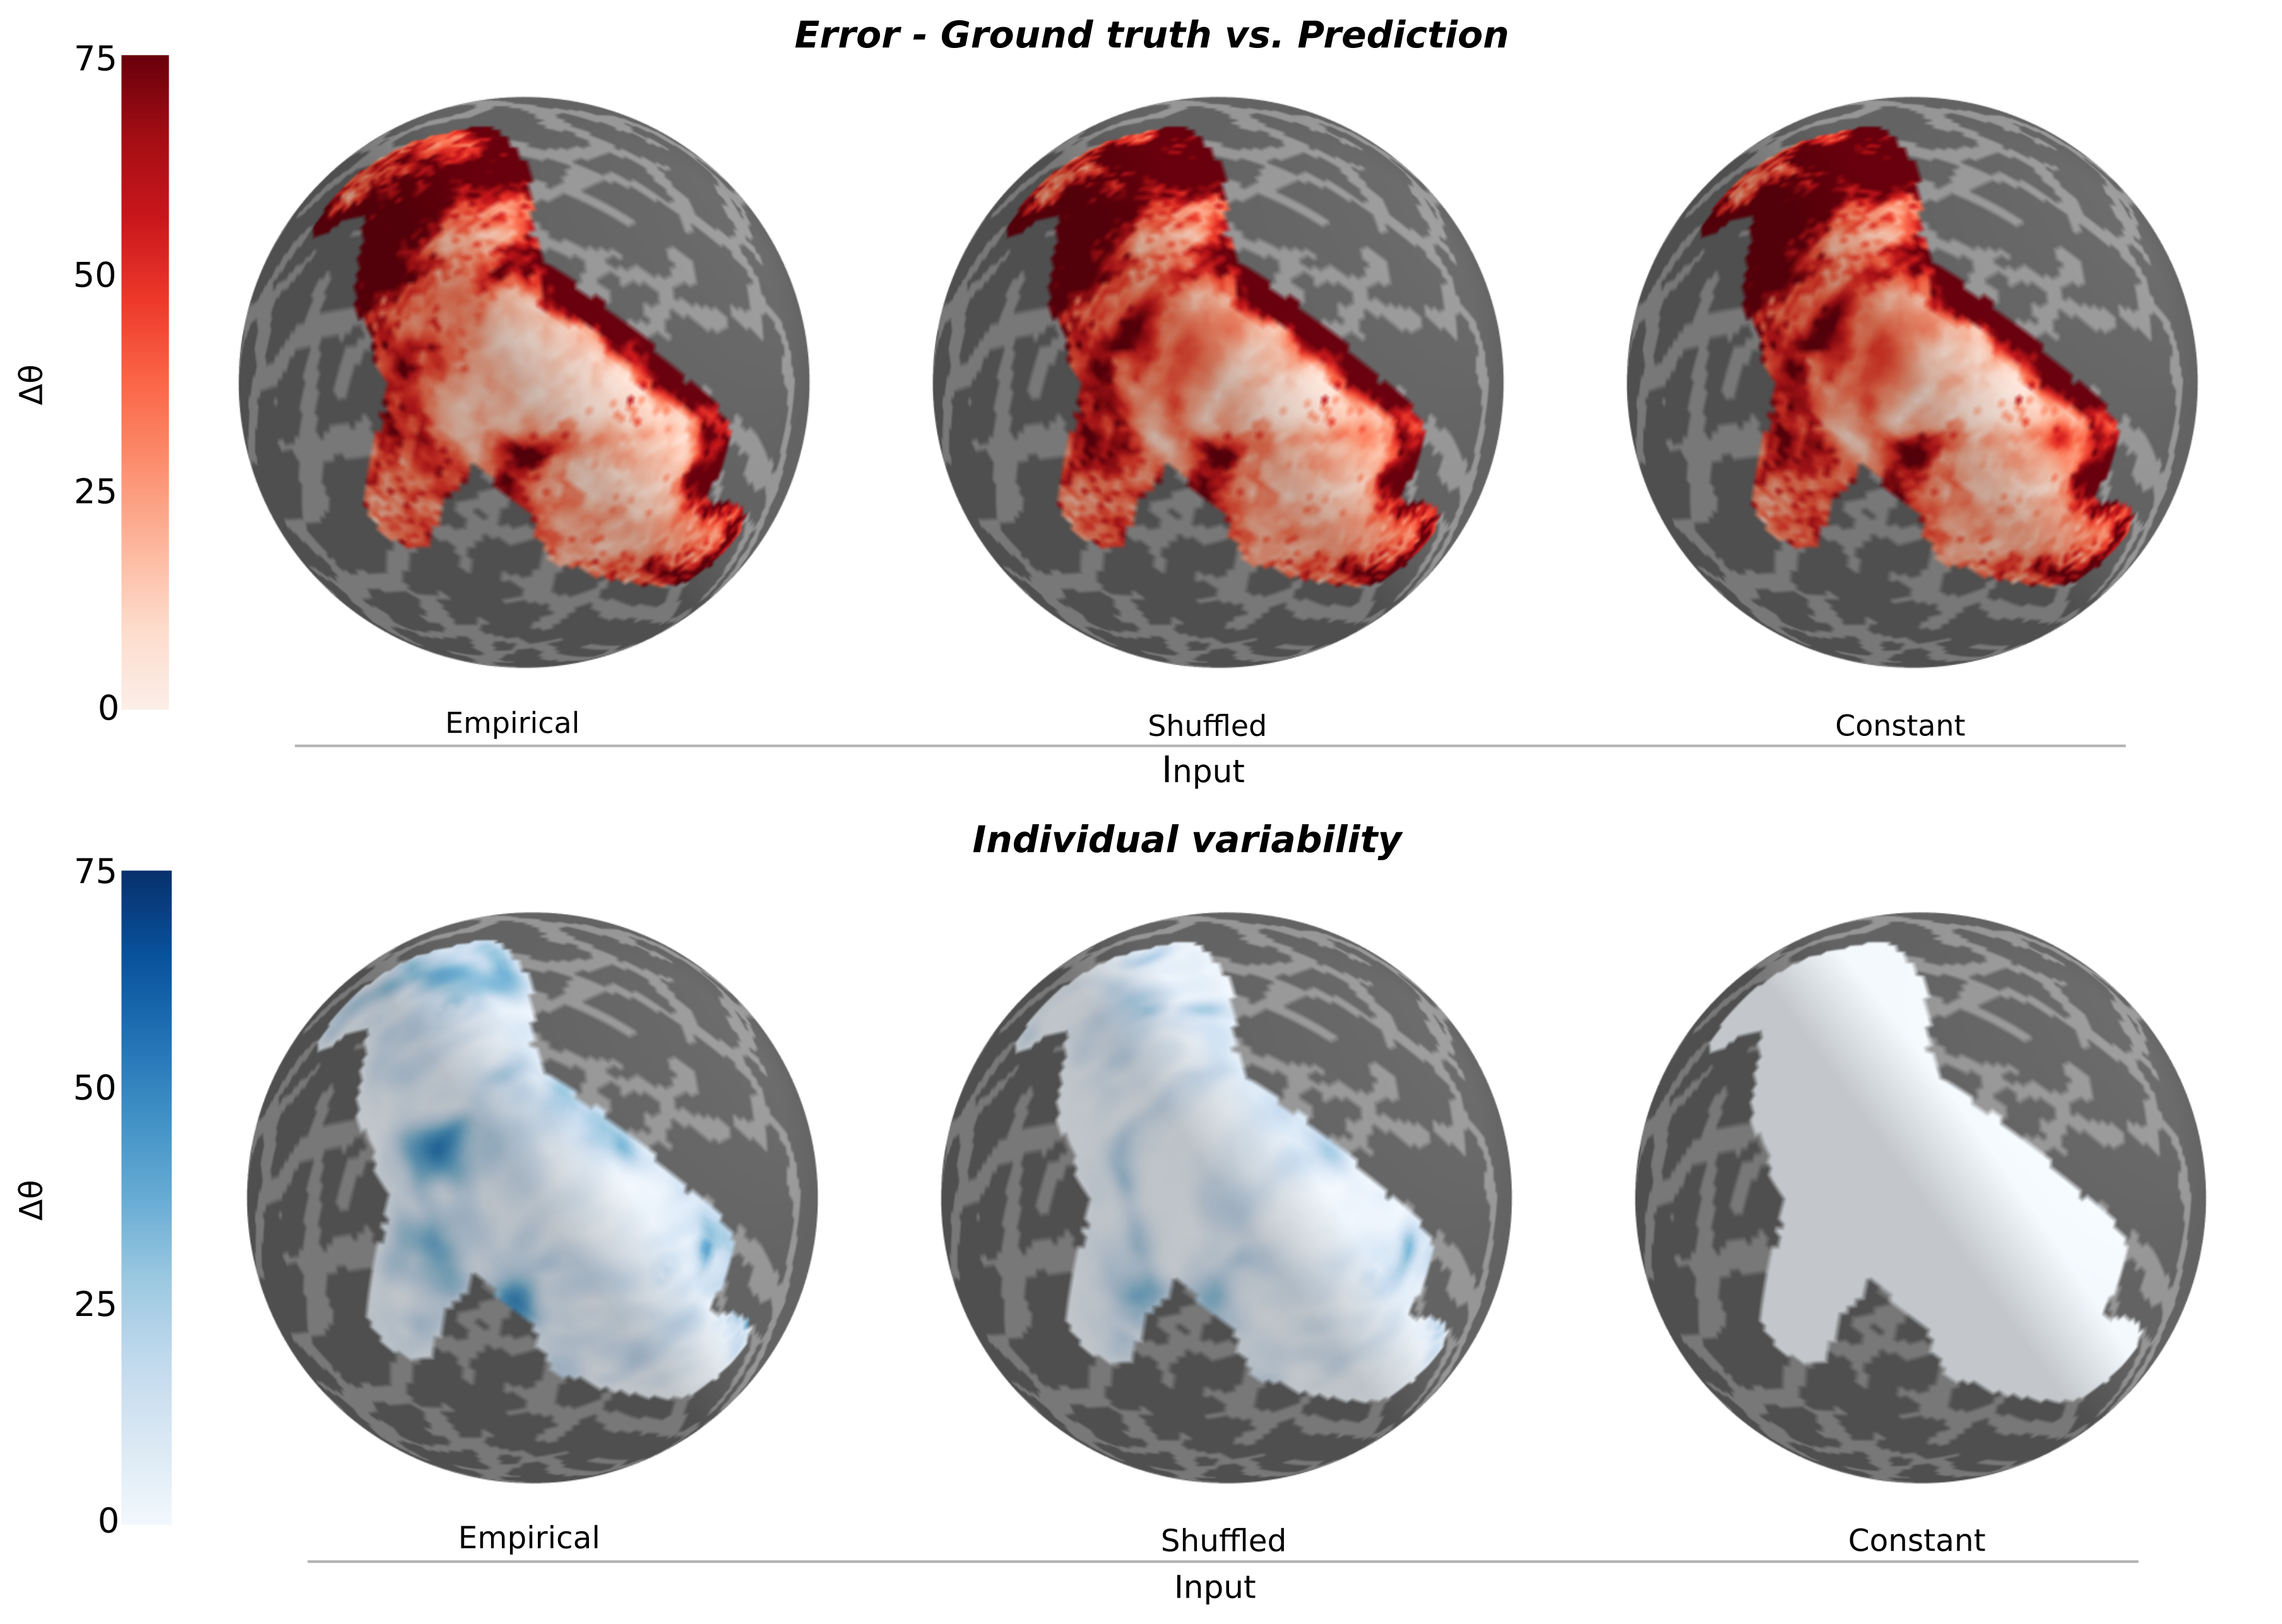
Using geometric deep learning and MRI-based neuroimaging data, we were able to predict the detailed functional organization of human visual cortex from anatomical properties alone. Our neural networks accurately predicted the main features of both polar angle and eccentricity retinotopic maps (Figure 2). For example, it appropriately predicted polar angle reversals throughout the visual cortical hierarchy (Figure 2), which is particularly useful for sub-dividing visual cortex into its functionally distinct areas. Perhaps more impressive yet, we show that our neural network is able to predict nuanced variations in the retinotopic maps across individuals (Figure 3). Finally, our results indicate that the individual variability seen across the predicted maps is guided by anatomical features, as disrupting the spatial organization of these features increased the error and reduced the individual variability (Figure 4) of the predicted maps.Discussion
This study shows that deep learning can be used to predict the detailed functional organization of visual cortex from anatomical features. Remarkably, our model was able to predict unique features in these maps showing sensitivity to individual differences. Previous work has been done to map the correspondence between brain anatomy and retinotopic maps in individuals by warping an atlas or template2,3 according to their specific anatomical data. While these approaches are able to provide reasonable estimates of their retinotopic maps, they have not – when using anatomical information alone – been able to capture the detailed idiosyncrasies seen in the actual measured maps of those individuals. By not assuming a prior structure-function relationship our deep learning framework provides a more flexible approach, able to produce more specific retinotopic maps.Although we demonstrate its utility for modeling visual cortex, geometric deep learning is flexible and well-suited for a range of other applications involving data structured in non-Euclidean spaces, such as surfaces and graphs.
Acknowledgements
This work was supported by the Australian Research Council (DE180100433).References
1. Bronstein, M. M., Bruna, J., Lecun, Y., Szlam, A. & Vandergheynst, P. Geometric Deep Learning: Going beyond Euclidean data. IEEE Signal Process. Mag. 34, 18–42 (2017).
2. Benson, N. C. & Winawer, J. Bayesian analysis of retinotopic maps. Elife 7, 1–29 (2018).
3. Benson, N. C., Butt, O. H., Brainard, D. H. & Aguirre, G. K. Correction of Distortion in Flattened Representations of the Cortical Surface Allows Prediction of V1-V3 Functional Organization from Anatomy. PLoS Comput. Biol. 10, (2014).
4. Benson, N. C. et al. The Human Connectome Project 7 Tesla retinotopy dataset : Description and population receptive field analysis Essen. J. Vis. 18, 1–22 (2018).
5. Fey, M. & Lenssen, J. E. Fast Graph Representation Learning with PyTorch Geometric. Prepr. http//arxiv.org/abs/1903.02428 1–9 (2019)
6. Fey, M., Lenssen, J. E., Weichert, F. & Muller, H. SplineCNN: Fast Geometric Deep Learning with Continuous B-Spline Kernels. Proc. IEEE Comput. Soc. Conf. Comput. Vis. Pattern Recognit. 869–877 (2018).
Figures