1284
The neural network model that can consider the inhomogeneity of the judgements between different annotators: implementation for MRA diagnosis1Applied MRI Research, Department of Molecular Imaging and Theranostics, National Institute of Radiological Sciences, QST, Chiba, Japan, 2MNES corporation, Tokyo, Japan, 3Medical Check Studio Ginza Clinic, Tokyo, Japan, 4Medical Informatics Section, QST Hospital, QST, Chiba, Japan, 5Department of Molecular Imaging and Theranostics, National Institute of Radiological Sciences, QST, Chiba, Japan
Synopsis
The neural network model was designed to judge the existence of aneurysms from brain MR angiography images. On the hypothesis that each radiologist (annotator) has a unique bias for decision, the network was designed so that it accepts input of who the annotator was as an additional information to compute the output. The hypothesis might be reasonable, and the model design might be useful because the accuracy of the trained model (area under the curve (AUC) in receiver operating characteristic (ROC) analysis) elevated significantly (P<.0001, DeLong test) by adding the information of who the annotator was.
Introduction
It is now commonly understood in the deep learning field that great amount of data is required besides an adequate network design to obtain a model with high-performance. On this basis, many large databases are being constructed around the world. However, the inhomogeneity of the data is recently discussed as a new problematic point, because such background is usually not considered during the training. In diagnostic tasks, the difference in the criteria or policies for diagnosing between different radiologists can be hypothesized as an important example of such inhomogeneity. To avoid this being problematic, consent of the judgement is made between several radiologists in some studies, but more technical solution might become necessary because such process is not realistic in upcoming larger databases. In this study, brain aneurysm diagnosis using MR angiography was selected as a target, and a network model that can learn and consider the difference between the radiologists during the training was designed. The purpose of this study was to evaluate whether this model can improve the accuracy of the final judgement.Methods
Time-of-flight MR angiography image series acquired from 3423 subjects for health screening were included in this study. Each case was diagnosed (primary reading before being double-checked) by one of the four board-certified radiologists (annotators) assisted by an established deep learning-based aneurysm detection system (CAD) [1]. The CAD suggests zero to five areas for each series as brain aneurysm suspicious regions, and the radiologist can make the decision for each of them, positive of negative. In addition, the radiologist can also add new regions as aneurysms. Fraction of the subjects judged as having one or more aneurysms (Fsub), as well as the fraction of the positive judgments for the CAD-based suggested areas (FCAD) were recorded to visualize the difference between radiologists. In addition, the positions and the final judgement of the suggested / added regions, and the judged size of the aneurysm if positive, were recorded for training and testing the models.The task of the model in this study was to classify the suggested or added areas into each final decision. The subjects were divided into training and testing groups by 8:2 fractions. Then, nine-channel images consisted from nine patch MIP images each were created for each target position similarly to the previous study [2] to consist the input data (Fig.1). Data augmentation was performed during this step for the training data to increase the data and also to decrease the difference of the sample size between the annotators. Numbers of positive and negative labeled inputs were balanced for each annotator in the training data to avoid the model learning the difference of positive probability among annotators.
The network architecture is summarized in Fig.2. Resnet [3] and attention system [4] were used as parts of this network. Of note, the network accepts the input of who the annotator was in addition to the nine-channel image (Fig.2). To assess the usefulness of inputting the annotator information, models with and without annotator information input (Ma and M0) were both prepared.
The models were trained using the training data, three times each according to the three-fold rule. RAdam [5] was used as the optimizer, and max epoch was set to 200. To obtain the final output for testing the models, the testing data was inputted to the three trained patterns of each model, and the square root of the main output values were averaged [6]. The judging accuracy was compared between M0 and Ma based on receiver operating characteristic (ROC) analysis. DeLong test was applied for statistical comparison (P<.05 considered as significant). The comparison was done using all the testing data at once, and additionally for each annotator separately.
Results
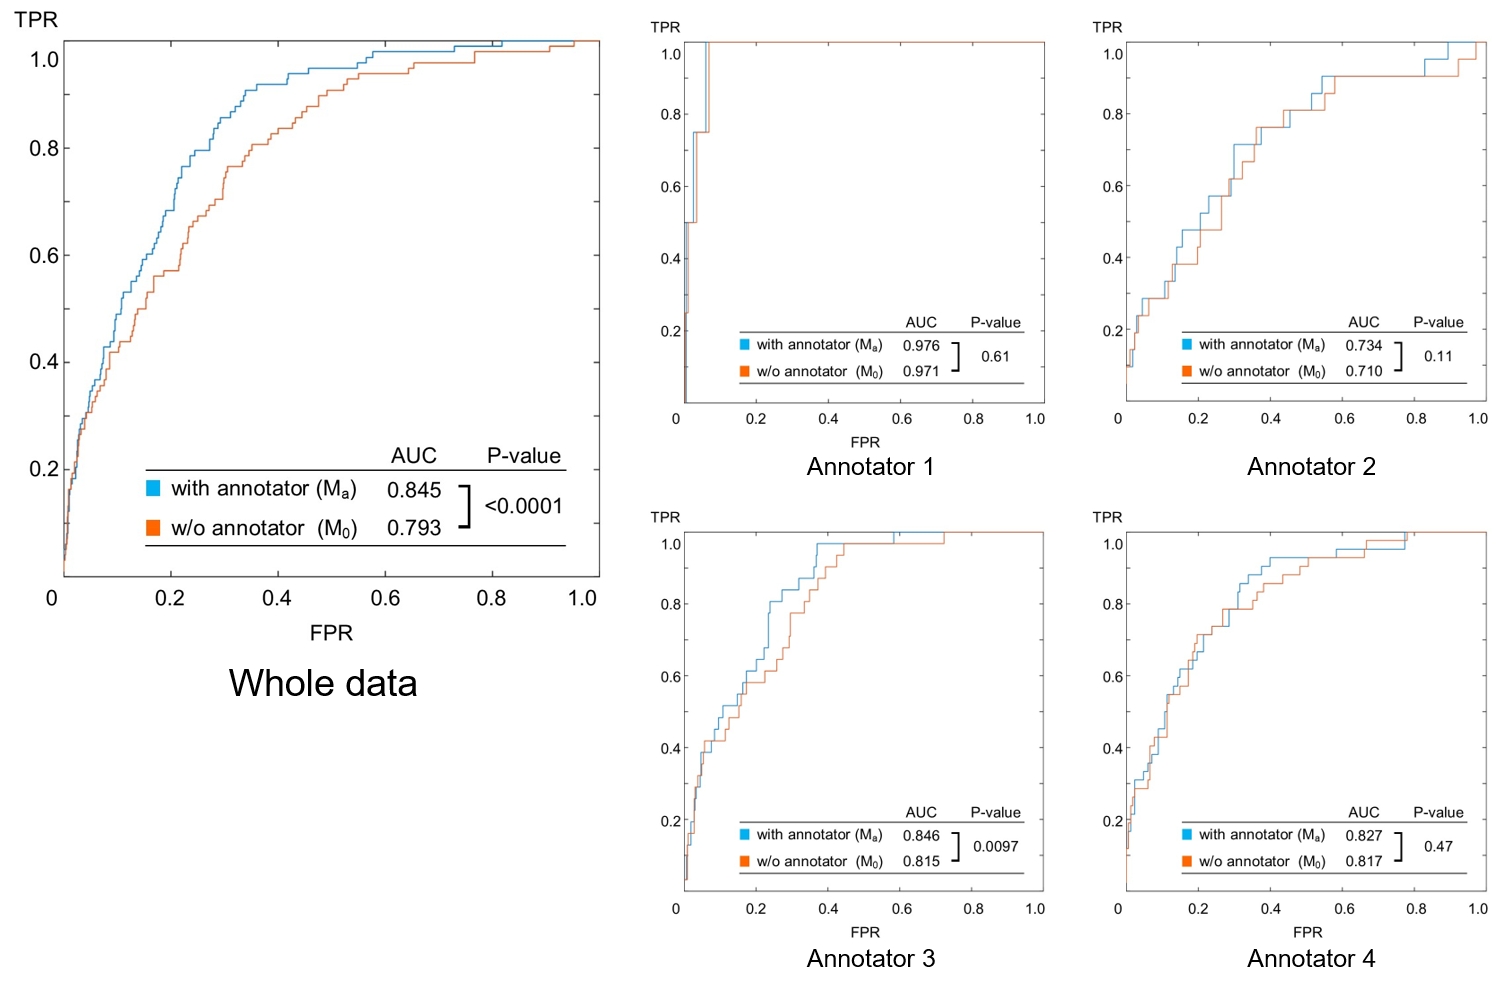
The sample size, Fsub and FCAD are summarized in Fig.3. Both Fsub and FCAD was lowest in annotator1 and highest in annotator 4. Annotator 2 and 3 were intermediate. The results of the ROC analysis are summarized in Fig.4. Area under the curve (AUC) was always larger in Ma than in M0, and the difference was significant in the whole data comparison (P<.0001) and in annotator 3 (P=0.0097). Examples of outputs are shown in Fig.5.Discussion
The fact that Fsub and FCAD were different between annotators (Fig.3) supports the hypothesis that annotators are providing biased judgements due to the different criteria or policies for judgement, because population of the patients and the CAD-based suggestions might be homogeneous. Furthermore, the result of the ROC analysis (Fig.4) suggests that such bias can be taken into account by using the proposed model because the AUC was significantly larger in Ma in the whole data analysis. The AUC of Ma was not significantly larger than M0 in all annotators. This might due to the small sample size, large AUC in M0 (i.e. annotator1), or simply because the converged parameters in M0 happened to be close to those in Ma. The model can output estimated judgement for each annotators (Fig.5) that might help understanding the confidence of the suggested diagnosis.Conclusion
The proposed model is useful to improve the accuracy of the judgement because it can learn and consider the difference between the annotators.Acknowledgements
This research was supported by a Grant-in-Aid for Scientific Research (Kakenhi #17K10385) from the Japan Society for the Promotion of Science (JSPS) and Japanese Government.
The authors appreciate the assistance of Toshiyuki Morito, Hiroko Kamada, and Etsuko Mitsui during the study.
References
1. Ueda, D., et al., Deep Learning for MR Angiography: Automated Detection of Cerebral Aneurysms. Radiology, 2019. 290(1): p. 187-194.
2. Nakao, T., et al., Deep neural network-based computer-assisted detection of cerebral aneurysms in MR angiography. J Magn Reson Imaging, 2018. 47(4): p. 948-953.
3. He, K., et al., Deep Residual Learning for Image Recognition, in arXiv e-prints. 2015.
4. Vaswani, A., et al. Attention Is All You Need. arXiv e-prints, 2017.
5. Liu, L., et al. On the Variance of the Adaptive Learning Rate and Beyond. arXiv e-prints, 2019.
6. do not average in ensemble, use temperature shaping. [cited 2019 Nov. 6]; Available from: https://www.kaggle.com/c/severstal-steel-defect-detection/discussion/107716.
Figures
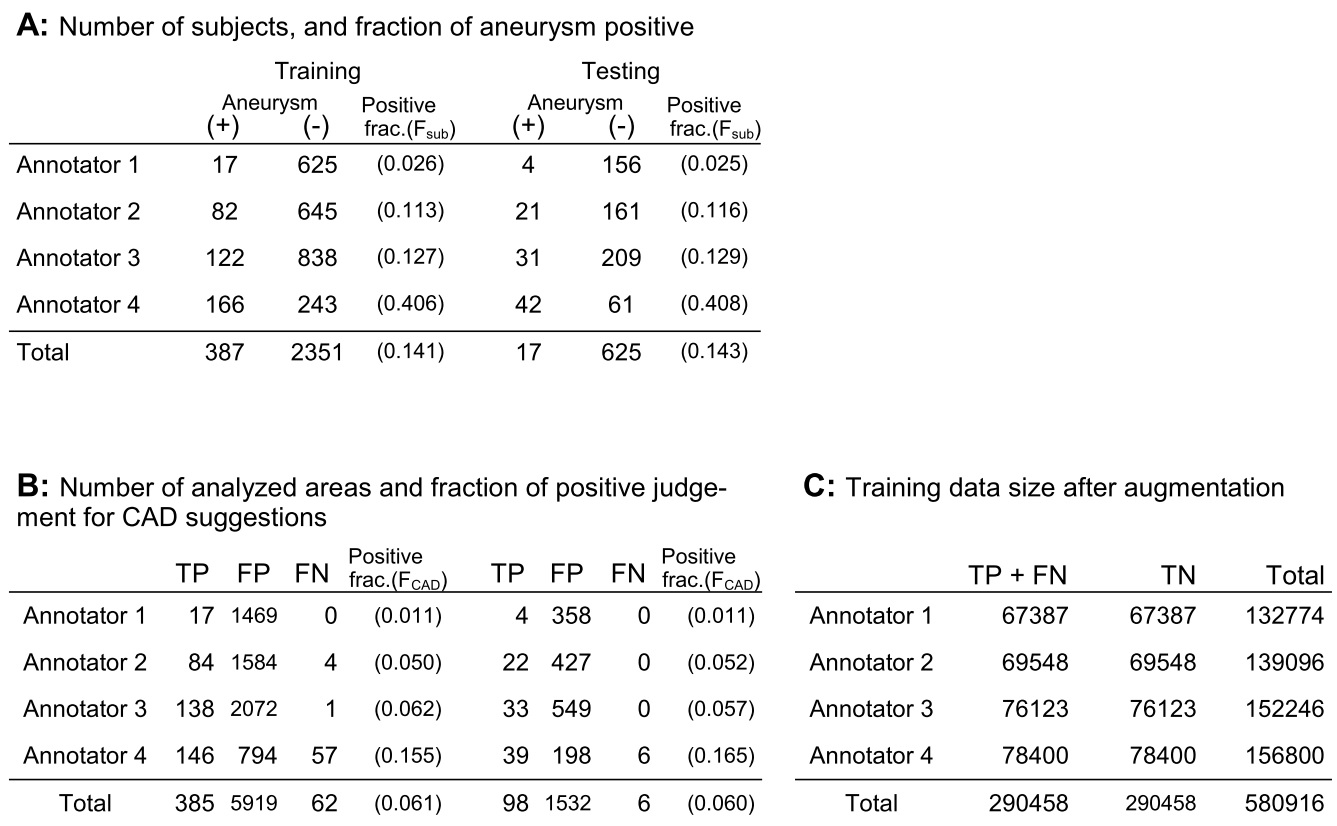
Figure 1: Summary of the data. A: The fraction of the subjects judged as having one ore more aneurysms(Fsub) was different between annotators. Training and testing data was consisted so that Fsub was similar in both groups. B: The positive fraction in analysed areas (FCAD = TP/(TP+FP), See below) was also different between the annotators. C: Data augmentation was done for the training data. TP: true positive and FP: false positive, are the areas picked up by the CAD and were judged as positive or negative by the annotators. FN: false negative are the areas added by the annotators as aneurysms.
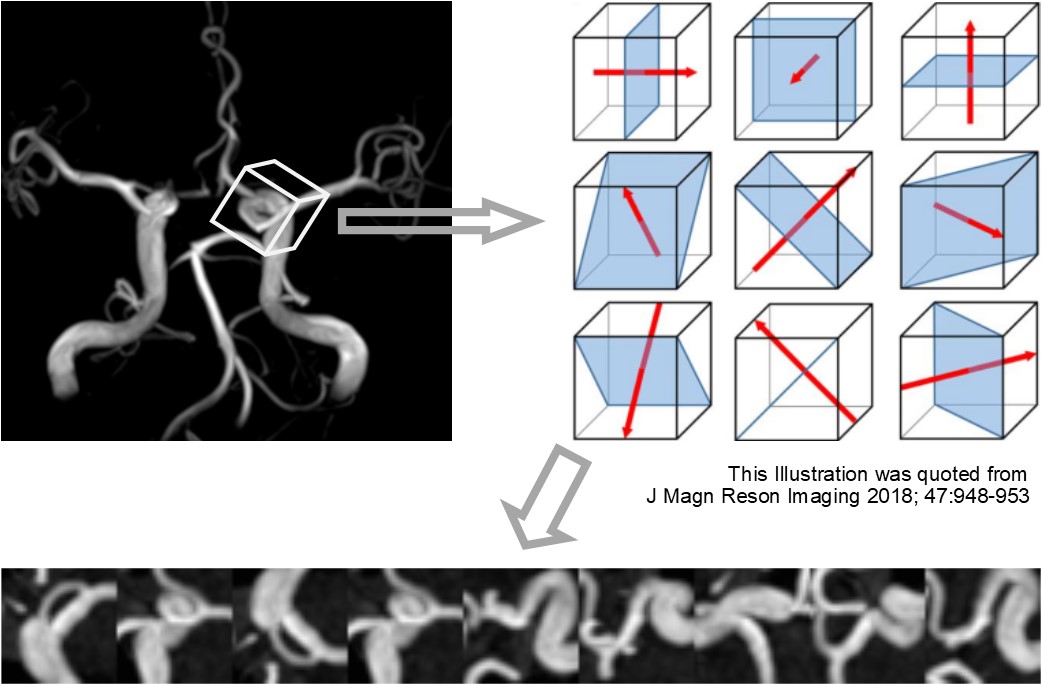
Figure 2: Data processing to create input image data. A voxel of interest (VOI, 32 x 32 x 32 pixels) was designed around each target, and then nine MIP images were created from the VOI as illustrated. The MIP images were bundled to form a nine-channel image as an input data (the nine channels are arranged side by side in this figure for visualization). Data augmentation for the training data was done by repeating this subsampling after randomly shifting and rotating the VOI in 3 dimensions each time.