1281
Multi-Channel RF Power and Phase Supervision Systems Technology for Thermal Magnetic Resonance: Development, Evaluation and Application1Berlin Ultrahigh Field Facility (B.U.F.F.), Max Delbrück Center for Molecular Medicine in the Helmholtz Association, Berlin, Germany, 2IHP – Leibniz-Institut für innovative Mikroelektronik, Frankfurt (Oder), Germany, 3Institute of Computer Science, Humboldt-Universität zu Berlin, Berlin, Germany, 4Experimental and Clinical Research Center (ECRC), a joint cooperation between the Charité Medical Faculty and the Max Delbrück Center for Molecular Medicine, Berlin, Germany, 5MRI.TOOLS GmbH, Berlin, Germany
Synopsis
Thermal Magnetic Resonance makes use of the physics of radio frequency waves applied at ultrahigh field-MRI. To achieve precise energy focal point formation, accurate thermal dose control and safety management, the transmitted RF signal amplitude and phase need to be supervised and regulated in real-time. In this work, a multi-channel power and phase supervision module was developed, evaluated and applied as an integral part of the Thermal MR hardware system. Preliminary experiments were conducted to demonstrate that the proposed module is suitable and essential for RF heating using a hybrid Thermal MR approach.
Introduction
Thermal Magnetic Resonance (Thermal MR) integrates radio frequency (RF) induced thermal intervention and in vivo temperature mapping using MR thermometry to permit supervised targeted in vivo temperature modulation1. There are two key requirements for conducting thermal interventions: 1) the system should be able to accurately control the thermal dose delivered to the object under investigation, 2) the energy focal point governed by the radiation pattern of the single RF transmit element, the RF antenna count and the thermal intervention radiofrequency of the RF applicator should be precisely formed to target the intended volume and position. To meet these requirements, the transmitted RF signal amplitude and phase of the RF applicators used for MRI and RF heating need to be supervised and regulated in real-time. Previous work implemented supervision modules,2, 3, 4 however these implementations only monitor the RF signal power level for specific absorption rate (SAR) supervision. Here we propose a multi-channel power and phase supervision module, which provides real-time RF power and phase monitoring and regulation as an integral part of the Thermal MR hardware system.Methods
Our hardware implements four RF input channels and a reference signal input channel and supports a frequency range of 10MHz to 2.7GHz. Figure 1 shows the block diagram. The RF input signals and the reference signal were conditioned to fit the range in which the RF power meter chips operate with the highest linearity. The reference signal was split into five length- and impedance-matched routes; four fed to the input B of four gain and phase meter chips AD8302 (Analog Devices, MA, USA) and one connected to a logarithmic power detector ADL5513 (Analog Devices, MA, USA). Each RF input signal was routed to the input A of an AD8302 chip and an ADL5513 chip. The additional power detectors were added to increase the reliability of the system. All voltage outputs from the detectors/meters were fed to a 16-channel, 16-bit analog-to-digital converter AD7616 (Analog Devices, MA, USA). The whole system is managed by a field programmable gate array chip XC7Z020 (Xilinx, CA, USA) which is the core of a system-on-module unit AES-Z7MB-7Z020-SOM-I-G (Avnet, AZ, USA).A graphical user interface (Figure 2) was developed to monitor the measured RF power and phase information, and to configure the signal conditioning settings. The phase meters were calibrated with a 4-channel arbitrary waveform generator (M8190A, Keysight, CA, USA) and verified with the evaluation kit of AD8302 (EVAL-AD8302, Analog Devices, MA, USA). The power meters were calibrated using a power signal generator (SMGL, R&S, Munich, Germany) and verified with a power sensor (NRP18T, R&S, Munich, Germany). The supervision module was integrated with a home-built 32-channel RF signal generator,5 a home-built power amplifier and a directional coupler (BDC0810-50/1500, BONN Elektronik, Holzkirchen, Germany) to form a feedback control loop. Basic proportional-integral-derivative (PID) controllers were implemented to regulate the power amplifier so that its output maintains a stable power level and phase. Ten minute tests were conducted with the control loop open and closed to examine the ability of the supervision module.
Heating experiments were conducted with the control loop either open or closed. An ultra-wideband antenna6 was applied to an agarose phantom placed into the isocenter of a 7.0T MR scanner (Magnetom, Siemens Healthineers, Erlangen, Germany). The heating paradigm (Fin=400MHz, Pin=42.5dBm at the port of the antenna) was applied for 10 minutes for each experiment. MR thermometry using the PRFS approach (TR=99ms, TE1=2.7ms, TE2=6.7ms, Voxel size=1x1x5mm3) at 298MHz was conducted before and after heating.
Results
Figure 3 illustrates the supervision module hardware and its operation with the RF signal generator and the RF power amplifier in RF heating experiments. After calibration and verification, the supervision module demonstrated a power detecting range of 100dBm (-70dBm to 30dBm) with a ±0.2dB linearity dynamic range of 79dBm (-52dBm to 27dBm) and a phase detecting range of 180° (0° to 180°) with a ±0.5° linearity dynamic range of 85° (45° to 130°). Figure 4 highlights the power and phase monitoring/regulating results from two 10-min tests. When the loop was open, there were large spikes (>1.5dBm) and substantial deviations over time from the setting point (45dBm). For the closed-loop experiment, the power level was stabilized around the setting point (45dBm), with a maximum deviation of 0.5dBm. The signal phases stayed stable for both open- and closed-loop experiments.Proof-of-principle was demonstrated in RF heating experiments using a phantom setup. Figure 5 shows the MR thermometry results. The applied RF heating paradigm induced maximum temperature increases of 7.04°C and 8.51°C with the control loop open and closed, respectively, in an area close to the antenna. A temperature rise difference of 1.47°C was observed.
Discussion and Conclusion
This work shows that the proposed multi-channel RF power and phase supervision module is suitable for Thermal MR. Higher precision measurements were achieved by signal pre-conditioning and by using a higher resolution ADC chip. Early applications using a phantom setup at 7.0T demonstrate the module’s feasibility and efficiency for real-time monitoring and regulation of RF power and phase. This provides the technological basis for a Thermal MR hardware system using an integrated RF applicator for anatomical imaging, temperature mapping and RF heating.Acknowledgements
This project has received funding from the European Research Council (ERC) under the European Union's Horizon 2020 research and innovation programme under grant agreement No. 743077 (ThermalMR).
References
1. Winter, L., et al., Thermal magnetic resonance: physics considerations and electromagnetic field simulations up to 23.5 Tesla (1GHz). Radiat Oncol. 2015 Sep 22;10:201. doi: 10.1186/s13014-015-0510-9
2. Orzada S, Solbach K, Gratz M, Brunheim S, Fiedler TM, et al. (2019) A 32-channel parallel transmit system add-on for 7T MRI. PLOS ONE 14(9): e0222452. https://doi.org/10.1371/journal.pone.0222452
3. Yan, X., et al., A Multi-Channel Real-Time Power Monitoring System for SAR Estimation Using FPGA in High Field MRI. Proc Intl Soc Mag Reson Med, 2016, #3662
4. El-Sharkawy, A. M., Qian, D. , Bottomley, P. A. and Edelstein, W. A. (2012), A multichannel, real‐time MRI RF power monitor for independent SAR determination. Med. Phys., 39: 2334-2341. doi:10.1118/1.3700169
5. Han, H., et al., Design, evaluation and application of a 16-channel Frequency Synthesizer Module for Thermal Magnetic Resonance. Proc Intl Soc Magn Reson Med, 2019, #5204
6. W.Eigentler, T., et al., Ultra-Wideband Self-Grounded Bow-Tie Antenna Building Block for Thermal Intervention, Diagnostic MRI and MR Thermometry at 7.0 Tesla, Proc Intl Soc Magn Reson Med, 2019, #6021
Figures
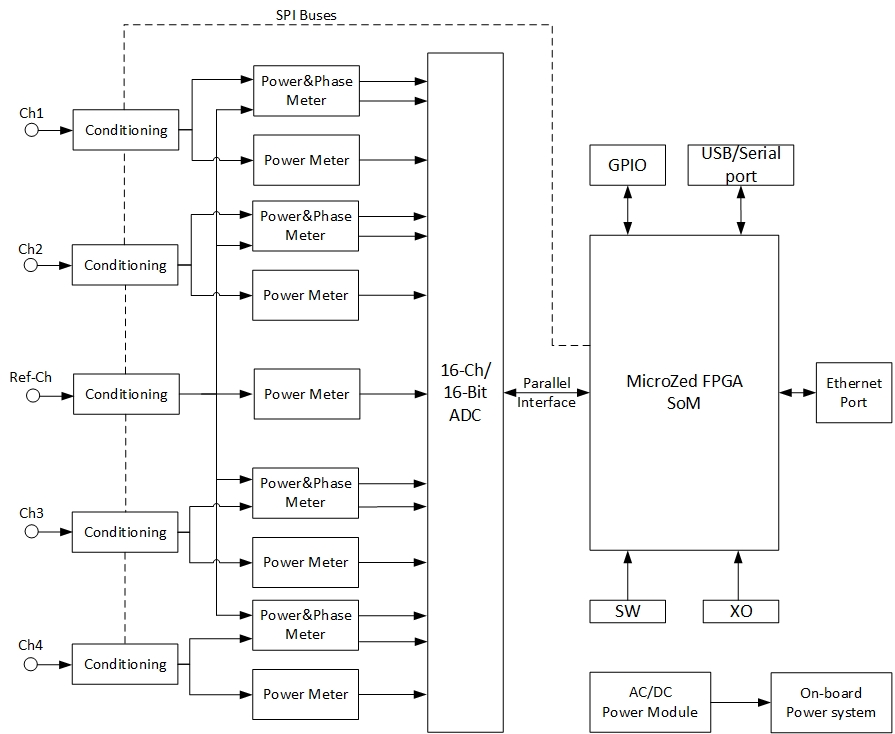
Figure 1: System block diagram. There is no difference on the signal propagation delay between the four RF input signals. Two serial peripheral interface (SPI) buses were routed from the FPGA to the conditioning chips (ADL5330, AD5683, Analog Devices, MA, USA; F1956, IDT, CA, USA) for configuration. Customized FPGA logic utilizing direct memory access (DMA) was developed to interface the ADC chip. Digital low-pass filters were also implemented in the FPGA. The data was transferred through the Ethernet port using user datagram protocol (UDP).
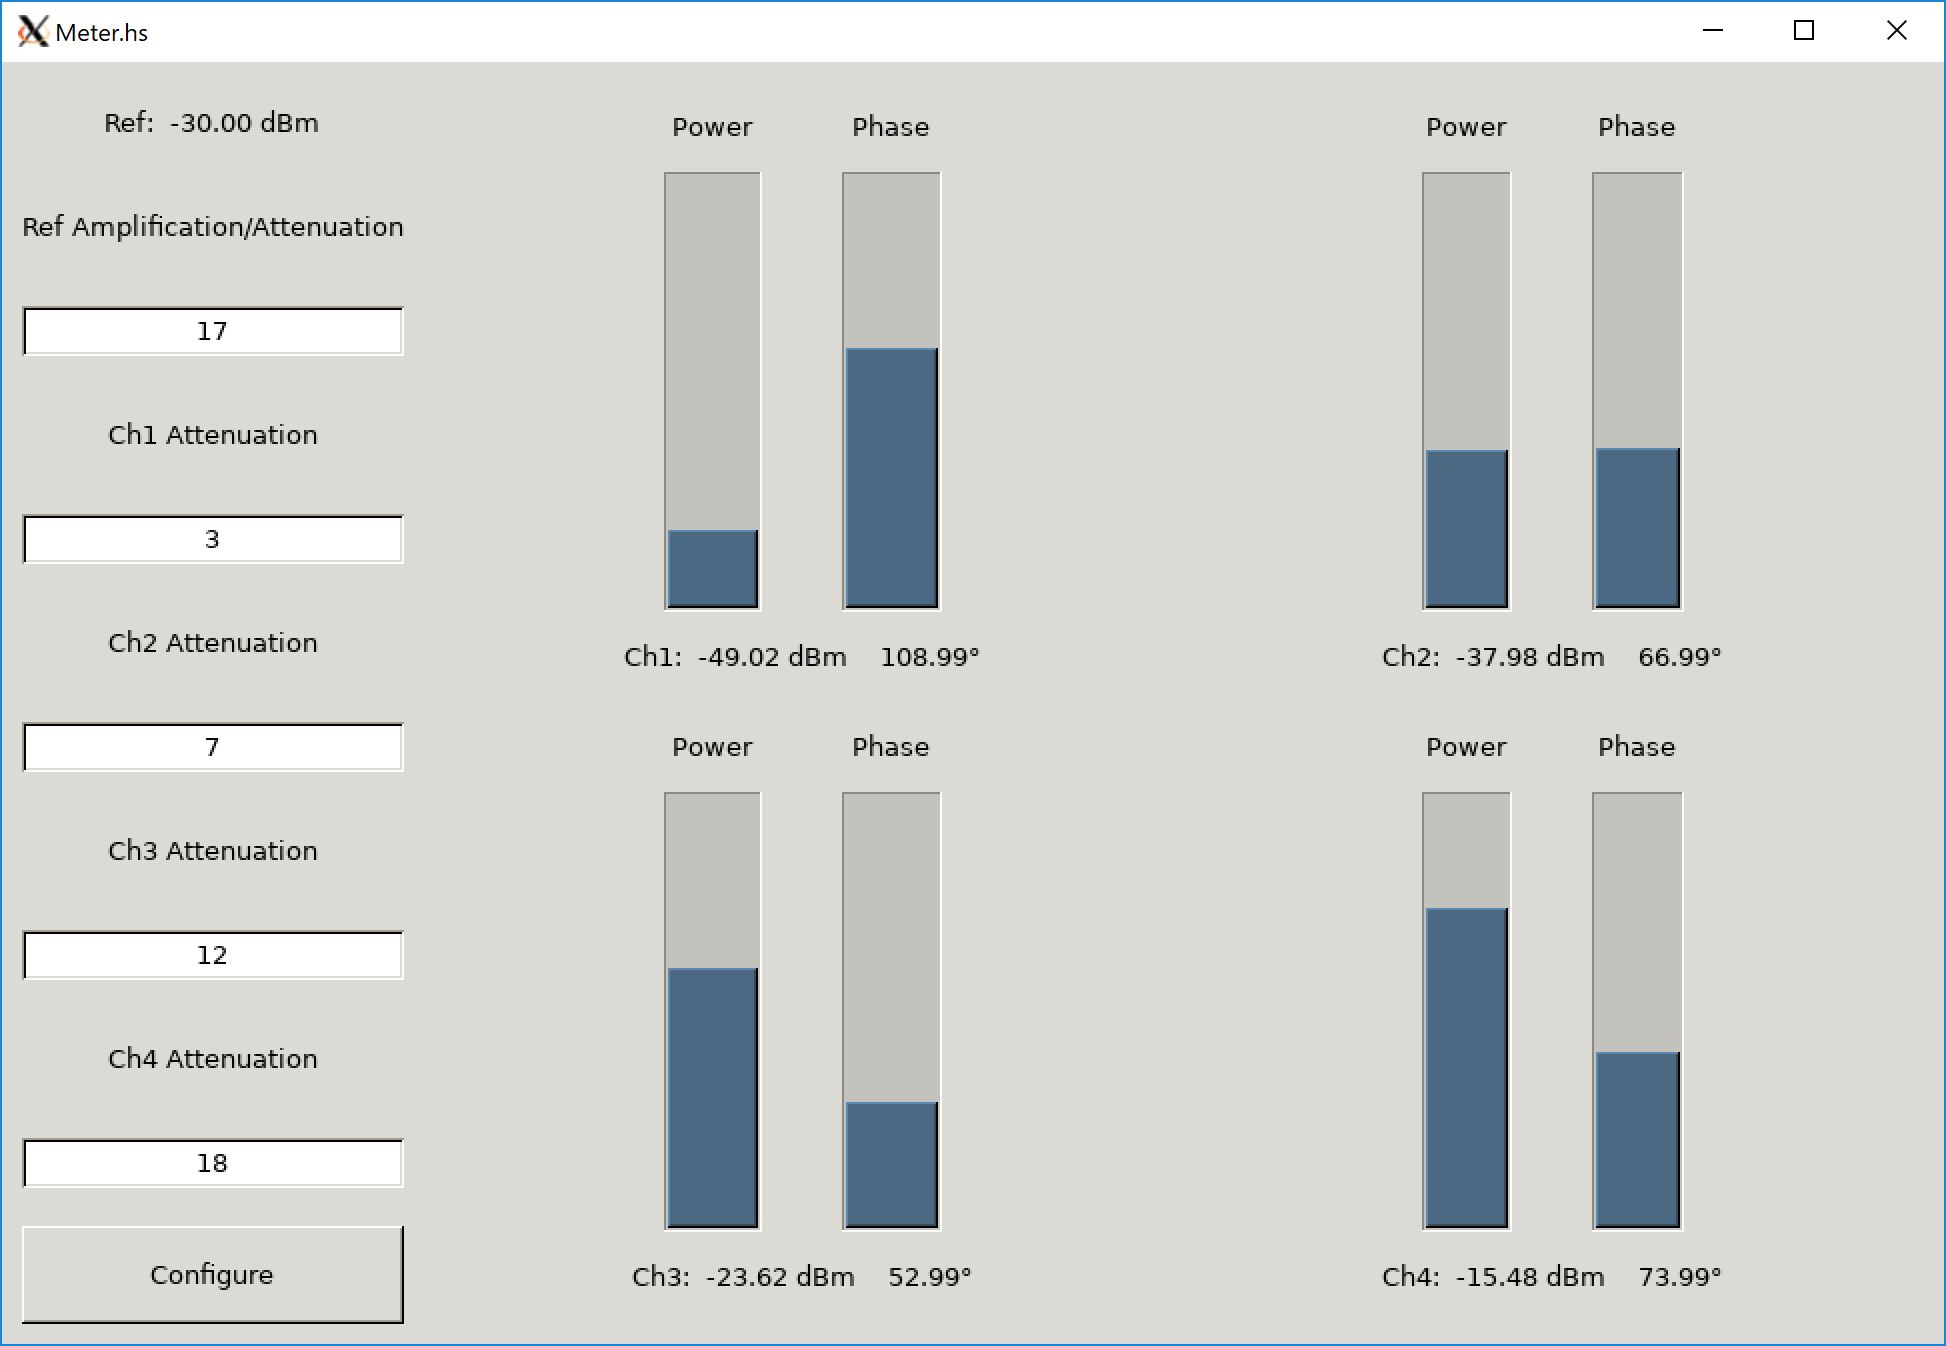
Figure 2: Graphical user interface (GUI). The GUI was developed in Haskell and runs on the host computer for monitoring the measurements, and communicates with the supervision module through an Ethernet connection. There is a UDP sever running on the ARM processer inside the FPGA on the supervision module. Users can configure the conditioning chips on the left side of the GUI. The RF power and phase information is displayed on the right of the GUI. Progress bars were used to show the relative relationship between channels.
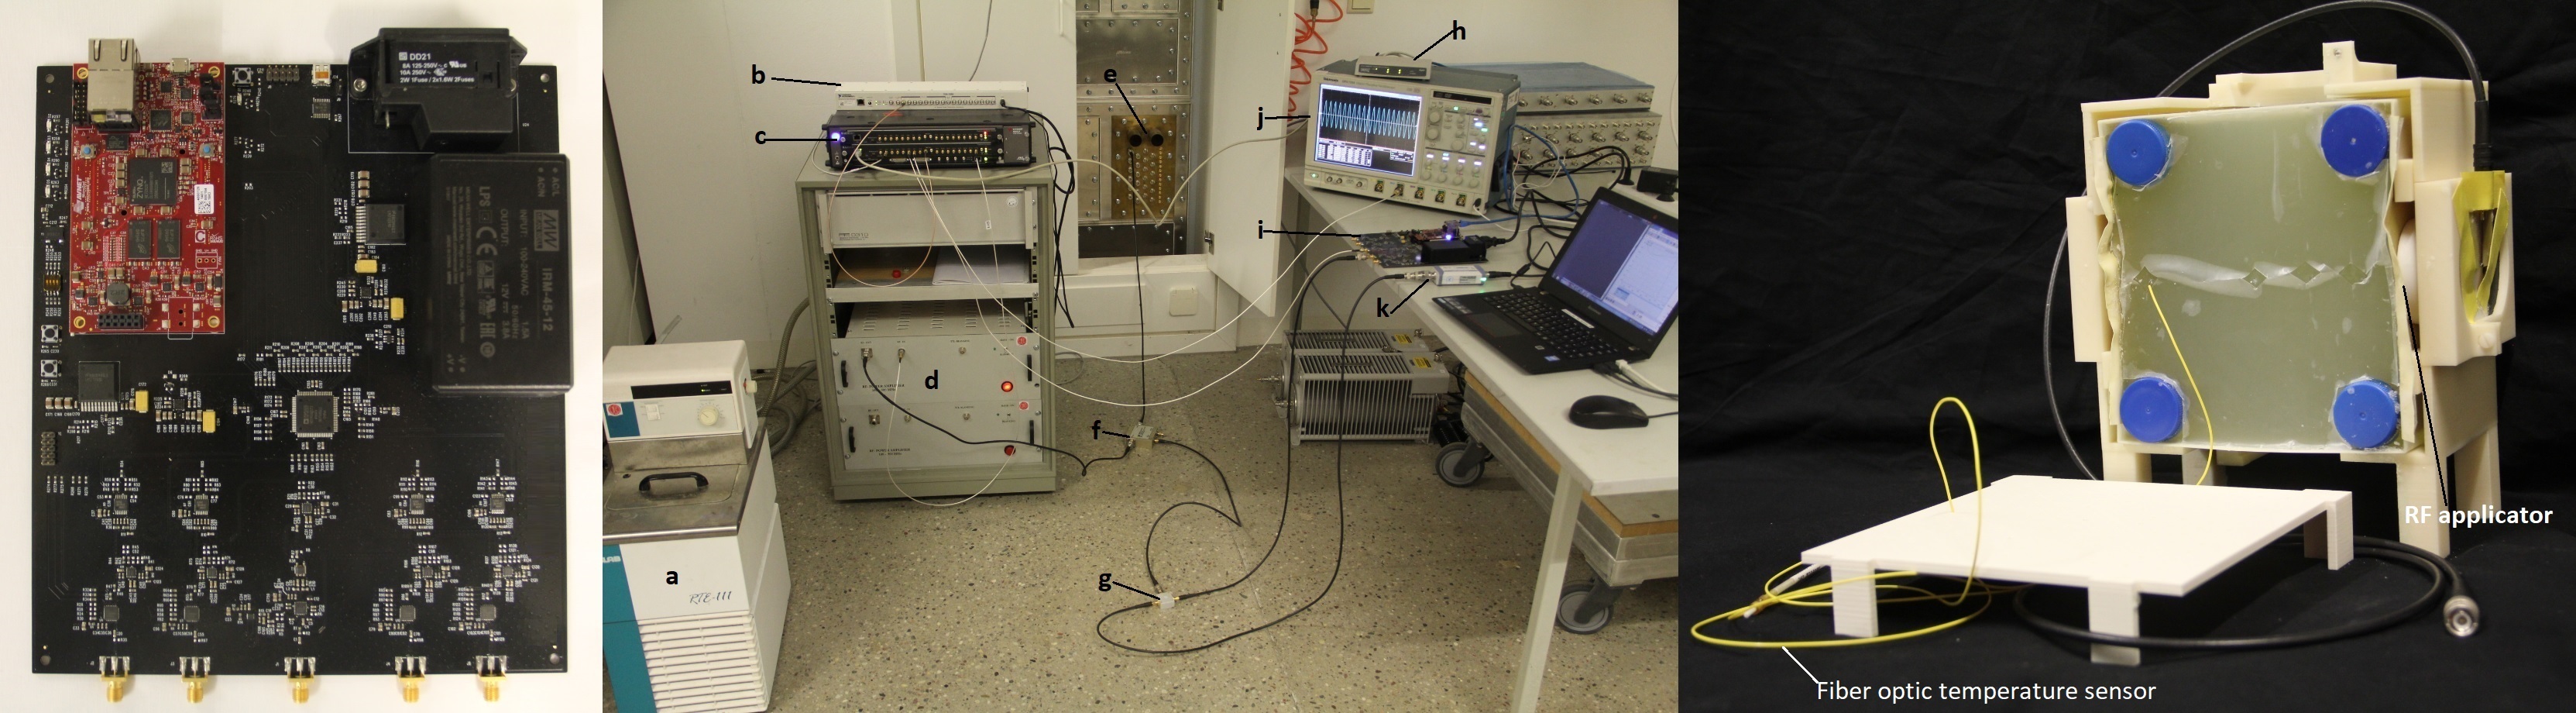
Figure 3: The supervision module (left). The heating experiment setup (middle): a) water cooling system, b) 8-channel clock distributor (CDA-2990, National Instruments, TX, USA), c) RF signal generator, d) RF power amplifier, e) panel filter, f) directional coupler (BDC0810-50/1500, BONN Elektronik, Holzkirchen, Germany), g) power splitter (ZFSC-2-1W-S+, Mini-Circuits, NY, USA), h) network router, i) supervision module, j) oscilloscope (DPO7254, Tektronix, OR, USA), k) power sensor (NRP18T, R&S, Munich, Germany). The rectangular phantom (178x163x116 mm3) (right).
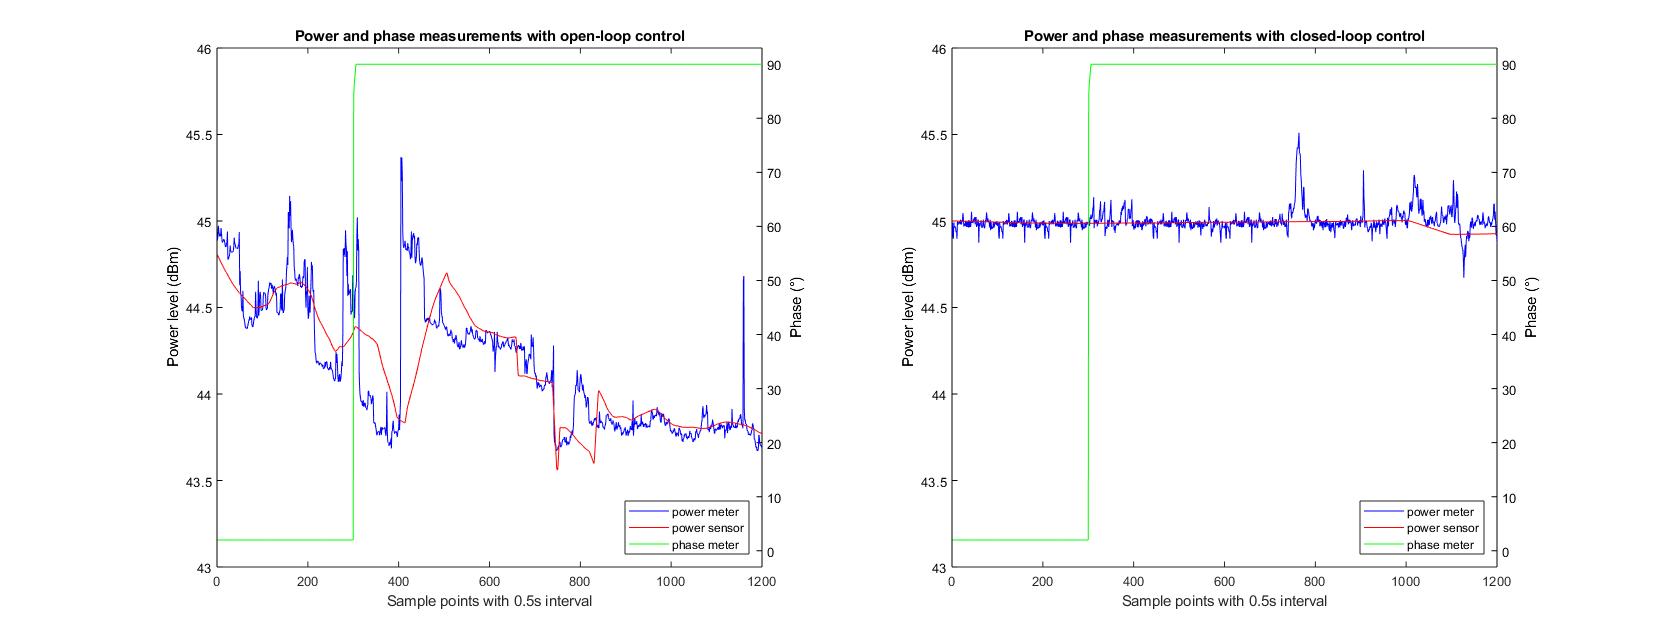
Figure 4: Power and phase monitoring without (left) and with (right) regulation. The blue curves are power levels measured using the supervision module; the red curves are the power levels measured with the power sensor; the green curves are the recorded signal phases using the supervision module. The RF signal power level at the output of the amplifier was set to 45dBm. The RF signal phase with respect to the reference was set to zero at the beginning and changed to 90° after 150 seconds. Both the supervision module and the power sensor were set to averaging over 1024 samples.
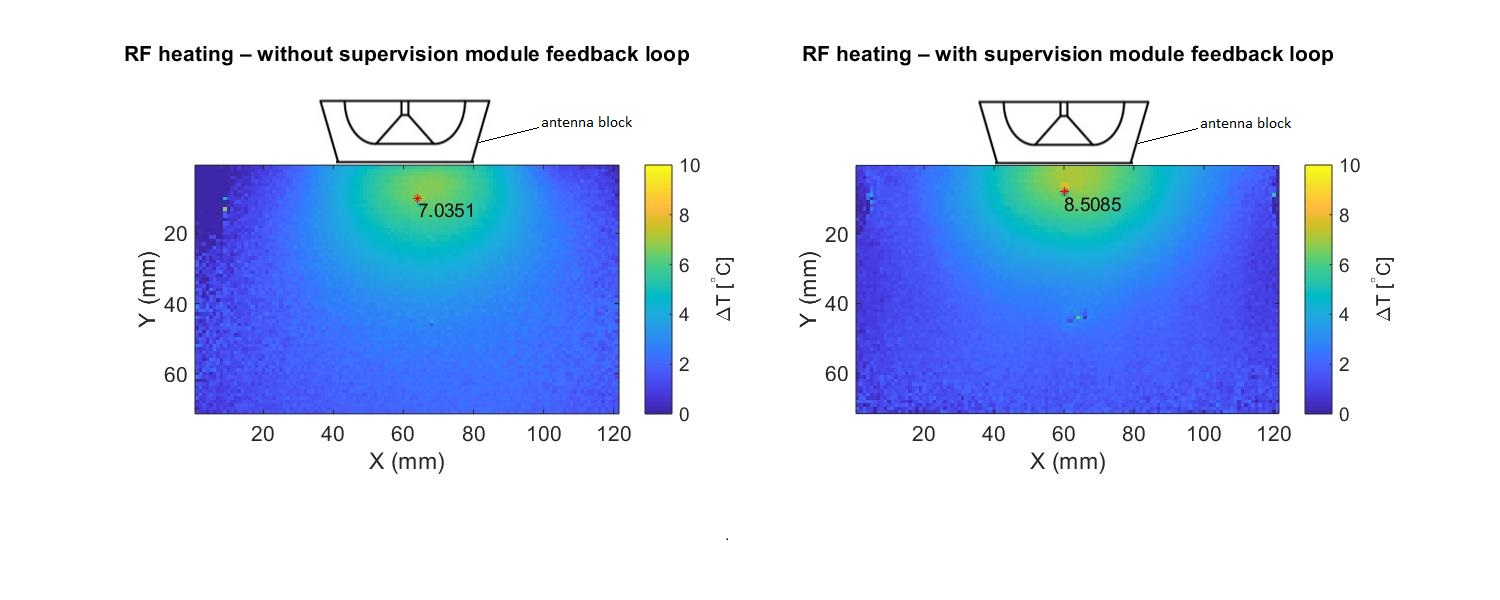
Figure 5: MR thermometry results with the feedback control loop open and closed. A transversal slice in the middle of the phantom aligned with the center of the RF applicator was selected for MR thermometry. The left figure shows the temperature mapping without the supervision module regulating the power amplifier. A maximum temperature rise of 7.04°C was observed. The right figure shows the result with the supervision in the loop. A maximum temperature rise of 8.51°C was observed.