1271
A wearable 50-channel magnetoencephalography (MEG) system1Sir Peter Mansfield Imaging Centre, University of Nottingham, Nottingham, United Kingdom, 2Wellcome Centre for Human Neuroimaging, UCL, London, United Kingdom, 3QuSpin Inc., Louisville, CO, United States, 4Wellcome Trust Centre for Neuroimaging, UCL, London, United Kingdom
Synopsis
We have a developed a wearable magnetoencephalography (MEG) system comprising 50, miniaturised optical pumped magnetometers (OPMs) fixed on an EEG-type cap. Large, bi-planar field and field-gradient coils sited inside a magnetically shielded room reduce the field around the head to < 1nT. This allows the subject to move their head during experiments without confounding the OPM signals. We report results from a simple finger abduction paradigm and a motor learning experiment in which a subject learns to play the ukulele. The results demonstrate the potential of OPM-MEG to overcome some limitations of neuroimaging investigations using fixed, cumbersome scanners.
Introduction
Magnetoencephalography (MEG) measures extra-cranial magnetic fields, enabling the mapping of brain activity on a millisecond timescale1. These electrophysiological measurements are complementary to the haemodynamic responses measured using fMRI2. Current MEG scanners use inductively-coupled SQUIDs to measure these weak (<1 pT) fields1,2. However, the need for cryogenic sensors leads to the use of a fixed, one-size-fits-all helmet. This set-up reduces sensitivity since sensors are displaced by a few centimetres from the scalp and the field decreases with the inverse square of distance – a problem which is exacerbated in children because of their smaller head-size3,4. In addition, head movement with respect to the sensor array confounds data quality. To overcome these significant limitations, we have developed a wearable MEG scanner using 50 miniaturised. optically pumped magnetometers (OPMs)3-6.Methods
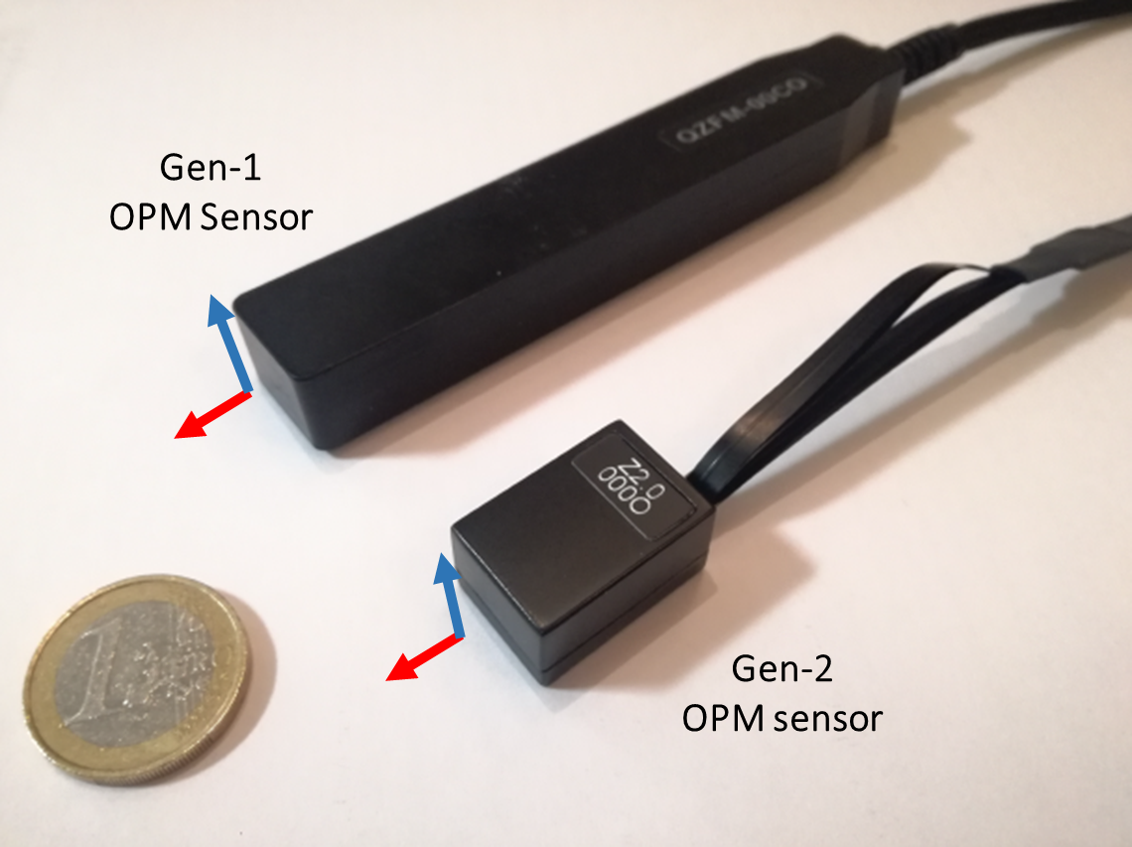
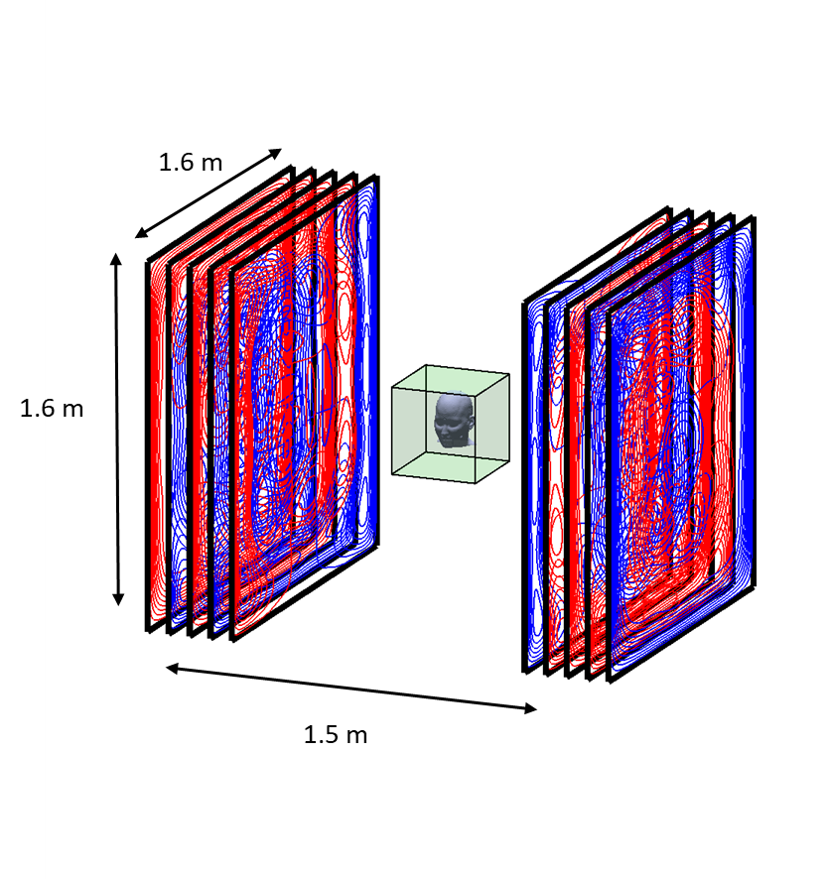
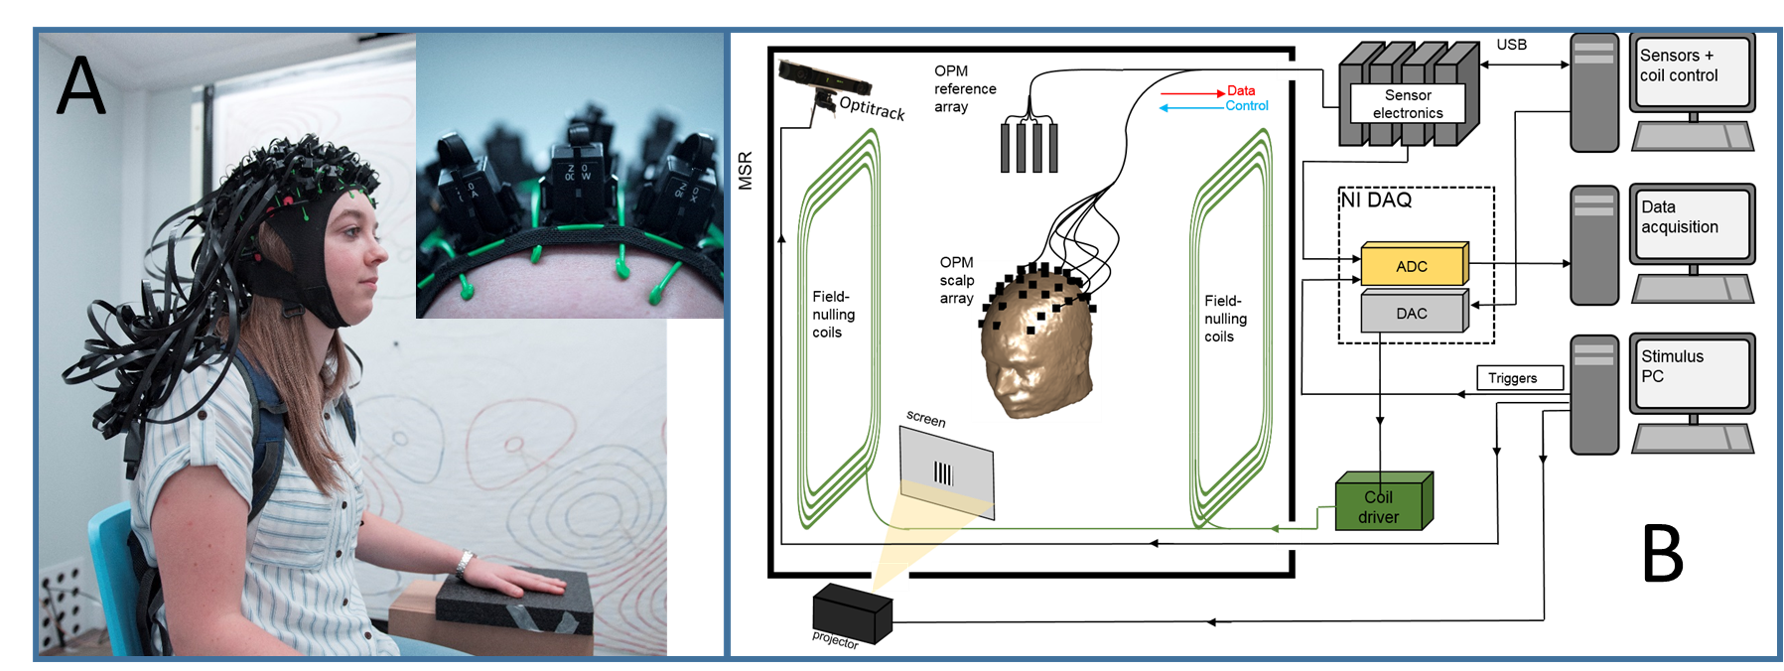
OPMs rely on optical detection of a zero-field magnetic resonance in a vapour of 87Rb atoms which occurs in the spin-exchange relaxation-free regime7. We use Gen-2, QuSpin (Louisville CO, USA) sensors, each forming a self-contained unit with dimensions of 1.24×1.66×2.44 cm3 and 4-g weight, incorporating a heated glass cell containing 87Rb, a 795-nm laser and associated optics, a photo-diode to measure light transmission through the cell, and three electromagnetic coils for controlling the field inside the cell (see Fig. 1). The cell is positioned ~6.5mm from the sensor’s surface. This surface can be placed adjacent to the scalp, significantly reducing the source-sensor distance compared to a cryogenic MEG set-up4,9. The sensors have a bandwidth of 130Hz and a noise-floor of 7-15 fT/$$$\sqrt{Hz} $$$. The narrow width of the zero-field resonance means that the field in the vapour-cell must be less than a few nT for linear sensor-operation. The OPM-MEG system is therefore operated in a 3-layer magnetically shielded room (MSR) (Magnetic Shields Ltd, Staplehurst, UK) of 3x3x2.4m3 internal volume formed from two layers of mu-metal and one layer of copper. After degaussing, the remnant static field in the MSR is ~ 2nT. We reduce this field to < 1 nT over a ~40x40x40 cm3 volume centred on the head of a seated subject, using a set of seven, bi-planar coils (1.6x1.6m2 area; 1.5m separation), which are designed using an approach originally developed for MRI gradient coil design6 (Figure 2). Three coils produce uniform fields along the three Cartesian axes (i, j & k) while the others produce field gradients (gxz(zi+xk), gyz(zj+yk), gzz(-x/2i-y/2j+zk) and gxy(yi+xj). By using PID controllers to link the outputs of a reference array of 4 sensors placed around the subject’s head to the coil drivers, the field and field gradients around the head can be nulled. This allows head movements to made during recordings, without producing large changes in the field measured by the on-scalp sensors.The 50 OPMs are mounted in slots within a specially-designed (EEG-style) flexible cap (Fig. 3A). A schematic diagram of the system including coil control and stimulus delivery is shown in Figure 3B. The positions of the sensors relative to the head were measured using a Skanect Pro and Structure Sensor (https://structure.io/), while head position was monitored during scanning using an infra-red camera (V120 :Duo, OptiTrack.com).
We report the results of two experiments which demonstrate the capabilities of the system. 1) Finger Abduction. In each trial, the subject moved either their index or little finger. Movement was for 1s followed by 3s rest. Index and little fingers were moved in alternate trials and there were 100 trials in total. 2) Motor Learning We also implemented a paradigm in which a naïve subject learnt to play a ukulele. In each trial, the subject was given 5 s to play a 5 chord sequence (always involving the same three chords). The chords were cued visually via projection onto a screen placed ~40 cm in front of the subject. 40 trials were presented.
Results
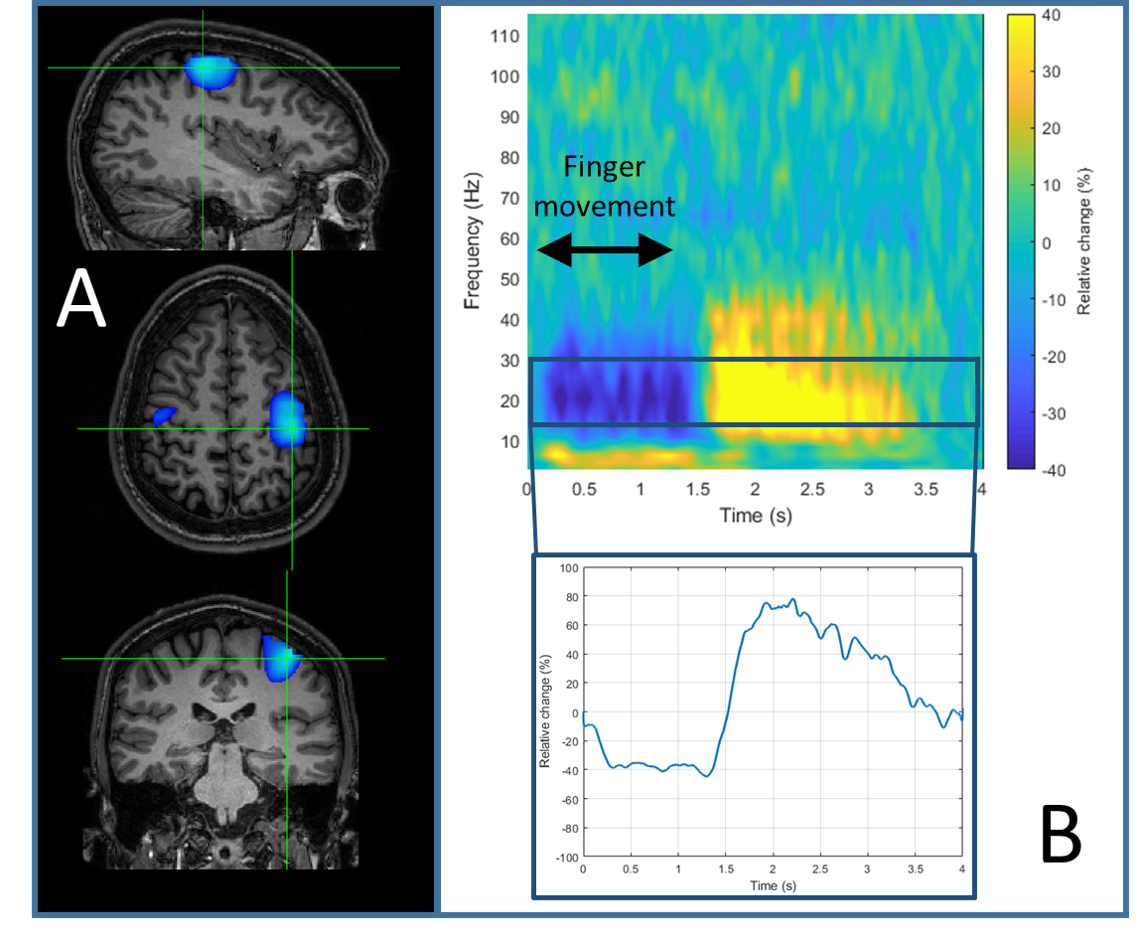
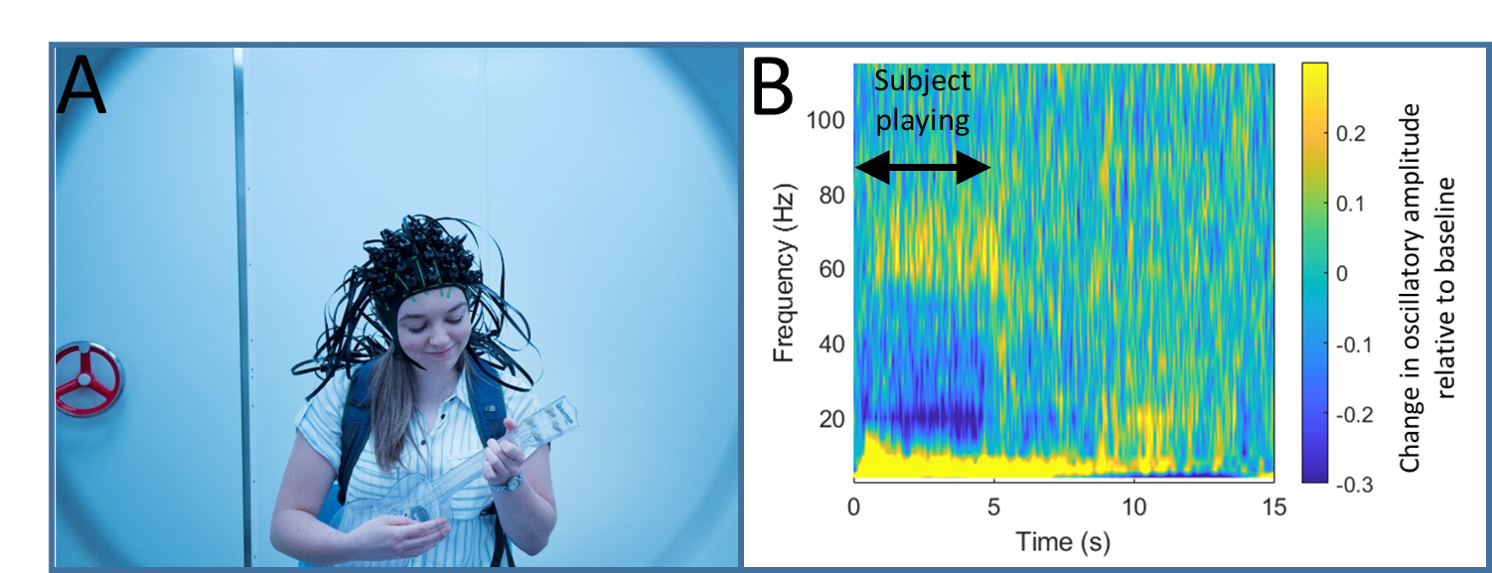
Figure 4 shows results of the finger abduction experiment. Panel A shows source localisation of the beta-band induced response, which, as expected, is well localised to primary sensorimotor cortex. Panel B shows the time-frequency signature of neural oscillations from within the primary motor area. Figure 5 shows the results of the ukulele experiment. Throughout the experiment the subject had to make natural movements as they looked at the visual presentation, and then at the ukulele to form the chords. Representative head movements (measured separately) were 4.7±1.2 cm translation and 28.1±6.71 degrees rotation. As shown in Panel 4B, despite this movement, we were still able to capture high quality data – the result shown is raw data from an individual synthesised gradiometer channel.Discussion
MEG and fMRI provide complementary measures of brain activity. However, a limitation of fMRI (and conventional MEG) is that subjects must stay immobile, limiting the feasibility of employing naturalistic paradigms. We have built and demonstrated a new type of wearable MEG system, which can be adapted to subjects’ head size/shape, and enables free movement during scanning. The results show that this system enables measurement of high fidelity data from a naturalistic paradigm (involving the subject playing a musical instrument). Further development of this system, and its deployment across new subject cohorts is likely to offer novel insights into human brain function and its breakdown in disease.Acknowledgements
This study was funded by a Wellcome Collaborative Award in Science (203257/Z/16/Z and 203257/B/16/Z). We also acknowledge the UK Quantum Technology Hub for Sensors and Metrology, funded by the Engineering and Physical Sciences Research Council (EP/M013294/1). The WCHN is supported by core funding from Wellcome (203147/Z/16/Z).References
1. Hamalainen, M., et al., Magnetoencephalography - theory, instrumentation, and applications to noninvasive studies of the working human brain. Reviews of Modern Physics, 1993. 65(2): p. 413-497.
2. Baillet, S., Magnetoencephalography for brain electrophysiology and imaging. Nature Neuroscience, 2017. 20(3): p. 327-339.
3. Boto, E., et al., Moving magnetoencephalography towards real-world applications with a wearable system. Nature, 2018. 555(7698): p. 657-+.
4. Boto, E., et al., A new generation of magnetoencephalography: Room temperature measurements using optically-pumped magnetometers. Neuroimage, 2017. 149: p. 404-414.
5. Boto, E., et al., Wearable neuroimaging: Combining and contrasting magnetoencephalography and electroencephalography. Neuroimage, 2019. 201.
6. Holmes, N., et al., A bi-planar coil system for nulling background magnetic fields in scalp mounted magnetoencephalography. Neuroimage, 2018. 181: p. 760-774.
7. Allred, J.C., et al., High-sensitivity atomic magnetometer unaffected by spin-exchange relaxation. Physical Review Letters, 2002. 89(13).
8. Tierney, T.M., et al., Optically pumped magnetometers: From quantum origins to multi-channel magnetoencephalography. Neuroimage, 2019. 199: p. 598-608.
9. Iivanainen, J., R. Zetter, and L. Parkkonen, Potential of on-scalp MEG: Robust detection of human visual gamma-band responses. Human Brain Mapping.
Figures