1263
Harmonic Balance Modeling of MRI Preamp Impairments1Electrical Engineering, Stanford University, Stanford, CA, United States, 2GE Healthcare, Aurora, OH, United States, 3Radiology, Stanford University, Stanford, CA, United States
Synopsis
A Silicon Germanium alternative to standard HEMT pre-amplifiers is proposed. This is intended to ameliorate the high power consumption associated with current implementations for the wireless use case in which power is a limiting factor. The proposed pre-amp is evaluated for linearity and gain through a behavioral model that is extracted from SPICE simulation to process k-space data. It is found that the non-linearities introduced by the SiGe device begin to have an impact on image quality in high dynamic range cases. This encourages further investigation into SiGe devices as low-power preamplifiers.
Motivation
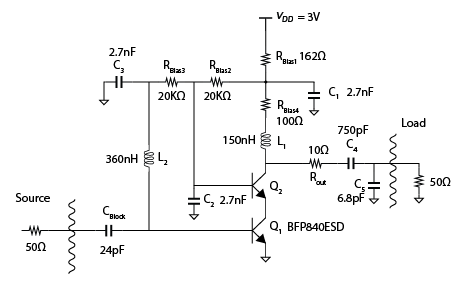
Traditional MRI pre-amps were developed around high electron mobility transistor (HEMT) devices. This provided low noise and high input impedance. Linearity over the wide MRI dynamic range was accomplished by high bias currents (>30mA). In power limited cases such as wireless MRI, high power consumption limits the ability to expand to higher array counts [1]. Futhermore, many of the devices that the MRI community have relied upon are at or near end-of-life product cycle. The desire for similar performance at lower bias currents coupled with the need for readily available devices may be met by Silicon Germanium (SiGe) Heterojunction Bipolar Transistors. SiGe parts can achieve desired levels of gain at lower bias currents than HEMT parts but there exist a number of metrics relevant to the MRI use case. These are input-referred noise, input impedance, and amplifier linearity. ECAD tools are ineffective when simulating narrowband inputs such as a MRI waveform. Long readout times render transient simulation of a receiver chain with k-space input data impractical. Previous work using this technique reported transient simulation times up to 2.5 weeks [2]. A promising alternative is to build a behavioral model of the amplifier that captures the effects of harmonic distortion and intermodulation by harmonic balance simulation.Behavior of SiGe Devices Regarding MRI-Relevant Metrics
Pre-amp decoupling mandates a high impedance to the amplifier [3]. SiGe BJTs have reduced and finite input impedance. This consists of the base resistance $$$r_b$$$ and the base-emitter resistance, $$$r_\pi$$$. Typically, $$$r_\pi$$$ dominates. To the first order $$$ r_\pi ={V_T}/{I_B} $$$. Thus for small input bias currents the device still presents a non-trivial impedance. The gain of a common emitter amplifier is $$$ -g_m R_{load} $$$. For BJTs $$$g_m = {I_C}/{V_T}$$$. For comparison, $$$r_\pi$$$ and $$$C_\pi$$$ are analogous to $$$r_{gs}$$$ and $$$C_{gs}$$$ in FET devices.The input-referred noise of a SiGe BJT is expressed as follows [4]:
$$F_{min} = 1 + \frac{1}{\beta} + \frac{f}{f_T}\cdot \sqrt{ \frac{2I_C}{V_T} (r_E + R_b) (1+\frac{f_T^2}{\beta f^2}) + \frac{f_T^2}{\beta f^2}} \Rightarrow 1+ \frac{1}{\beta} + \frac{1}{\sqrt{\beta}}$$
For low frequency relative to ft and a low base resistance the expression simplifies. Note $$$f_t (I_C)$$$.
For high values of beta the Noise Figure approaches values targeted in MRI. Ex: NF ($$$\beta=100$$$)=0.45dB.
SiGe BJTs are exponential devices and will have a severe large-signal nonlinearity. Collector current is expressed as:
$$ I_C = I_s \bigg( e^{\frac{V_{BE}}{V_T}} -1 \bigg) $$
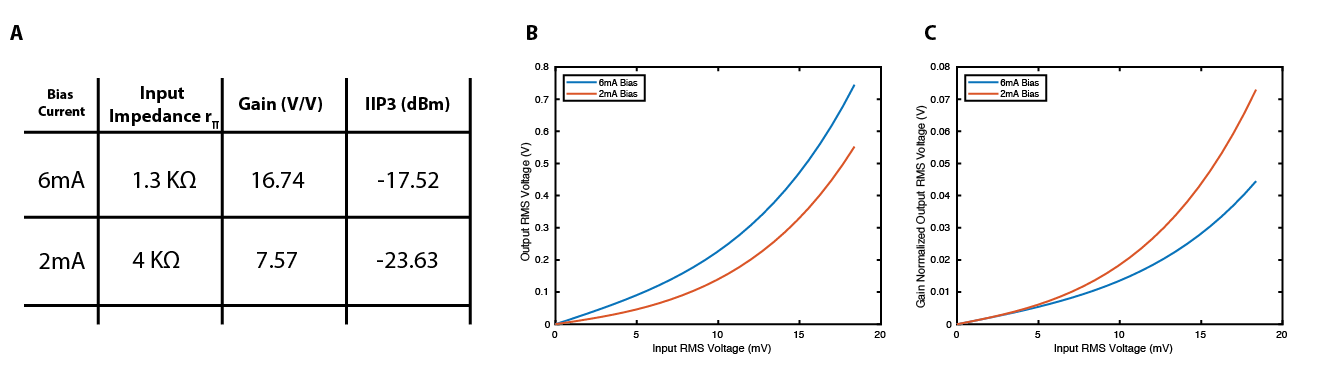
Performance metrics for the amplifier in [Figure.1] are shown in [Figure.2]. Reducing the bias current will result in lower gain, greater input impedance, and more severe non-linear effects.
Behavioral Modeling of Non-Linear effects
Modeling method outlined below:- A harmonic balance Spice simulation is run with a known input voltage amplitude.
- Weights of the harmonic distortion products are measured and used to fit a kth-degree polynomial model [5].
- Input waveforms are applied to this model generating higher order distortion products.
Results of Behavioral Modeling
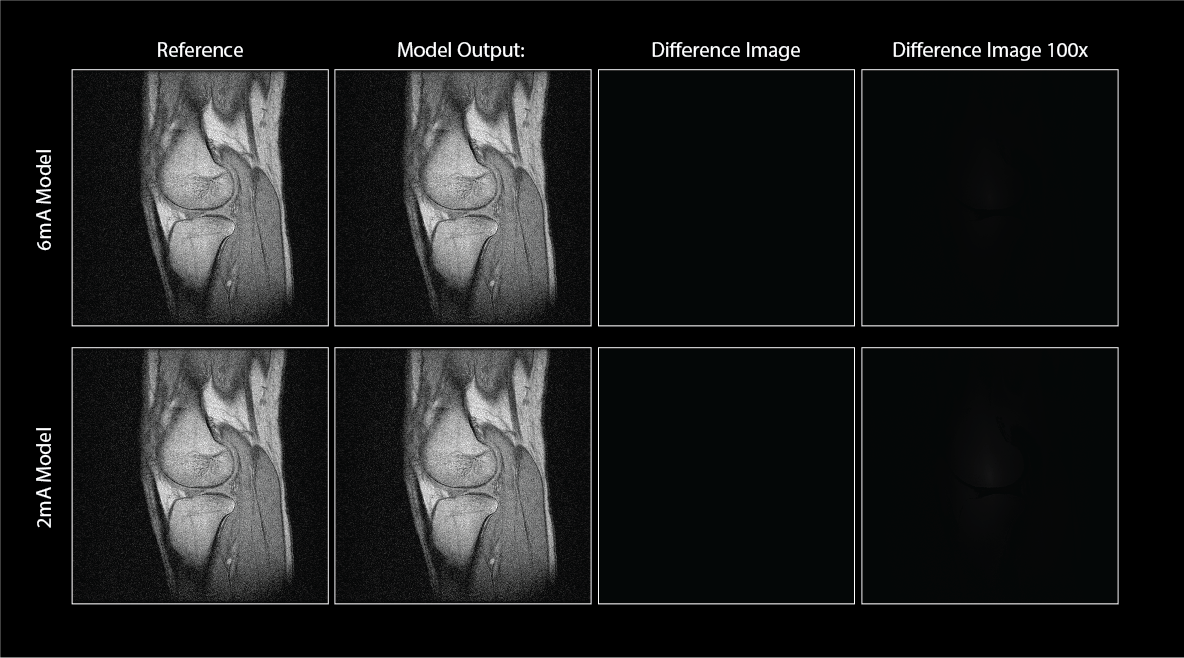
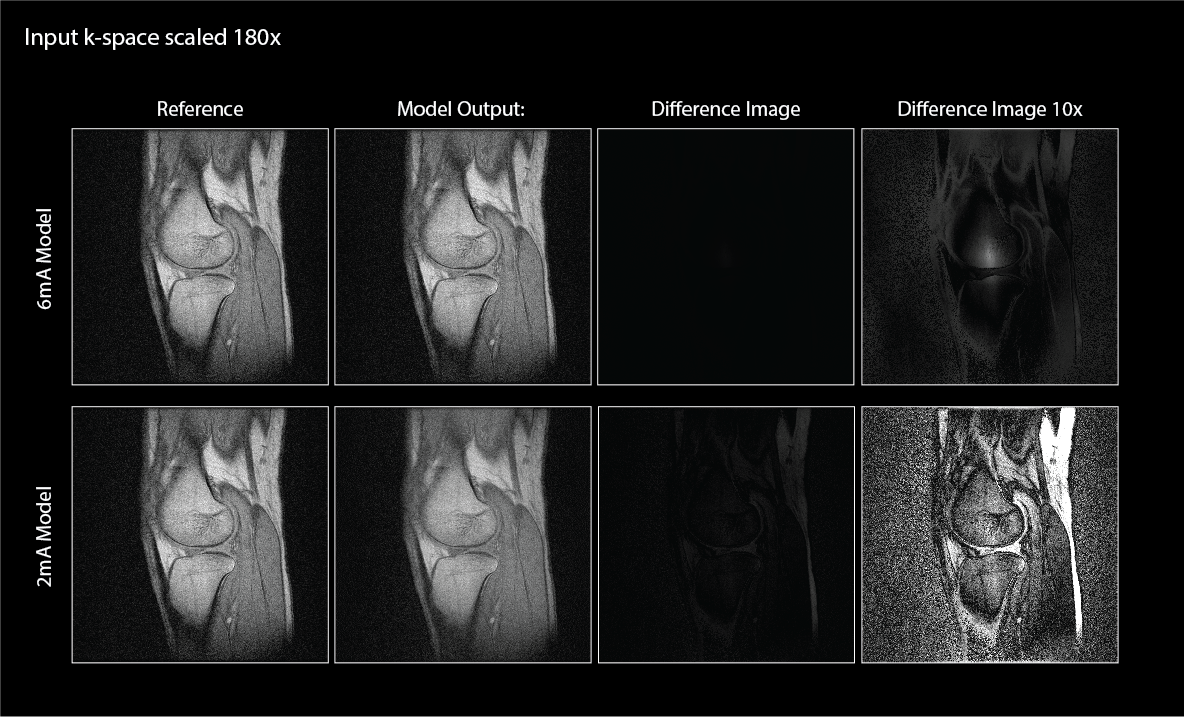
In [Figure.3] it is hard to perceive effects beyond reduced gain. The non-linearity does not seem to be a significant factor as the dynamic range of this dataset is limited. The peak input is -69.9dBm, not large enough to exercise the amplifier non-linearity.To exercise the device's non-linearity the k-space dataset was scaled up in magnitude by a factor of 180. This resulted in a max input of 12.8$$$mV_{rms}$$$, increasing the peak input to -24.8dBm. For context, a system with 50 Ohm noise and BW +/- 250 kHz and input dynamic range of 90dB has a peak input of -23.8dBm or ~14$$$mV_{rms}$$$ ref to 50 Ohm. Results are shown for both the 6mA and 2mA [Figure.4]. It's clear that by exercising the non-linearity with such high input amplitudes artifacts begin to appear. They are more severe at lower bias currents. Down-converting and filtering the signal removes harmonic distortion but leaves the intermodulation products which manifest as a blur.
The images are still intelligible, likely because of the high peak-to-average-power ratio inherent to the MRI signal. Thus only a very small fraction of k-space near the peak is distorted.
Future Work
Future work includes the development of a physical prototype for comparison against current pre-amplifier implementation and effects on real image acquisition. Other avenues include investigation into the potential to calibrate and compensate for the non-linearities introduced by the SiGe device, which is easily enabled by the development of the behavioral model.Acknowledgements
We would like to thank GE Healthcare for their research support. This project is supported by NIH grant R01EB019241References
[1] K. Byron, S. A. Winkler, F. Robb, S. Vasanawala, J. Pauly and G. Scott, "An MRI Compatible RF MEMs Controlled Wireless Power Transfer System," in IEEE Transactions on Microwave Theory and Techniques, vol. 67, no. 5, pp. 1717-1726, May 2019.doi: 10.1109/TMTT.2019.2902554
[2] Jouda, M. , Gruschke, O. G. and Korvink, J. G. (2014), Circuit level simulation of MRI receive chain using excitation derived from images. Concepts Magn. Reson., 44: 102-113. doi:10.1002/cmr.b.21275
[3] Roemer, P. B., Edelstein, W. A., Hayes, C. E., Souza, S. P. and Mueller, O. M. (1990), The NMR phased array. Magn Reson Med, 16: 192-225. doi:10.1002/mrm.1910160203
[4] S. Voinigescu, High-Frequency Integrated Circuits. Cambridge: Cambridge University Press, 2013.
[5] W. Sansen, "Distortion in elementary transistor circuits," in IEEE Transactions on Circuits and Systems II: Analog and Digital Signal Processing, vol. 46, no. 3, pp. 315-325, March 1999.doi: 10.1109/82.754864
Figures