1255
Single sided magnet system for relaxometry and diffusion measurement1School of Chemical and Physical Sciences, Victoria University of Wellington, Wellington, New Zealand, 2School of Engineering and Computer Science, Victoria University of Wellington, Wellington, New Zealand, 3Centre for Translational Physiology, University of Otago, Wellington, New Zealand, 4Department of Surgery and Anaesthesia, University of Otago, Wellington, New Zealand, 5Department of Paediatrics and Child Health, University of Otago, Wellington, New Zealand, 6Robinson Research Institute, Victoria University of Wellington, Wellington, New Zealand
Synopsis
We have developed a new permanent magnet based single sided magnetic resonance system, which is suitable for relaxometry and diffusion measurement. Our design generates an external region of homogeneous B0 field, a sweet spot, from which signal can be detected. The magnet has been optimised to have a larger penetration depth and higher B field strength than currently existing systems. We have found the system provides good homogeneity and field strength, making it useful for relaxometry. Additionally, we demonstrate it can be used for diffusion-T2 measurements, which will allow further biomedical applications.
Introduction
Single sided NMR systems offer a way of leveraging Magnetic Resonance techniques away from an expensive MR imaging suite1. Systems are typically based on arrangements of inexpensive permanent magnets which generate a B0 field with a sweet spot region which is external to the magnet itself. In the biomedical field, these systems have been used for measurements of tissue hydration2,3, breast cancer4, and bone volume fraction5,6. While existing systems can provide homogeneous B0 fields7–9, the field strength can be low and the sweet spot region is generally close to the surface ~1cm, which limits the range of applications.Our new magnet system generates a homogeneous sweet spot of 0.21 Tesla with a large penetration depth. The system weighs 30 kg and measures 30x20x20 cm WxHxL. We show it can be used for relaxometry, and Diffusion-T2 correlation measurements10,11, using a calibration method to correct for gradient inhomogeneity12.
Method
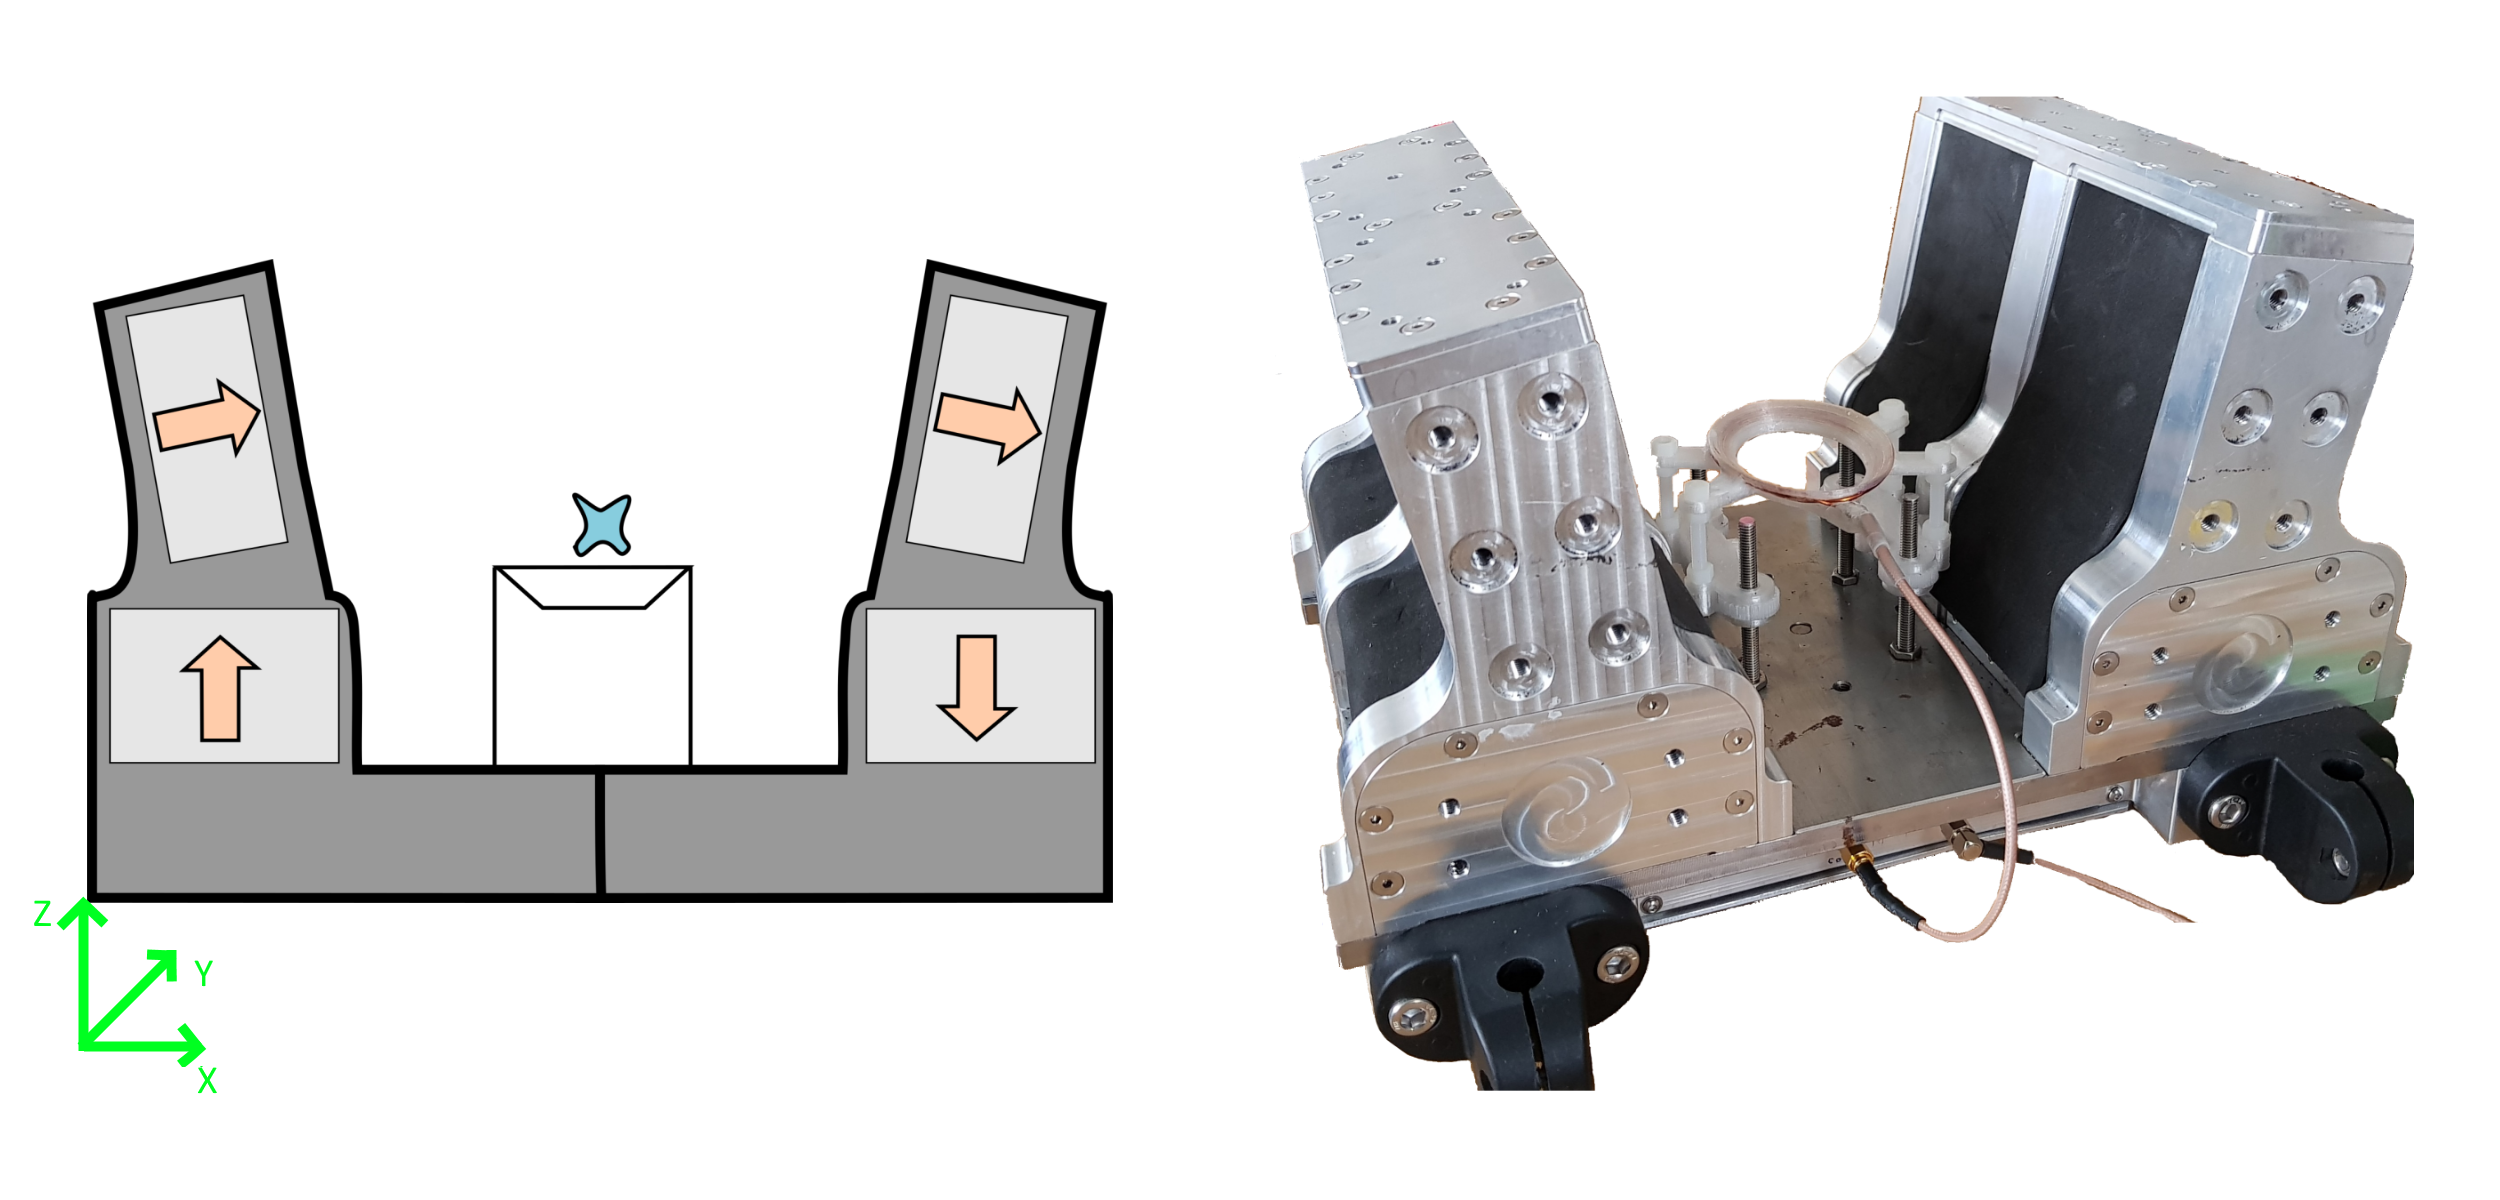
Our design (Figure 1) is based on an array of Neodymium block magnets mounted on a metal yoke. The field is augmented with another set of Neodymium magnets arranged as wings above the base. This is similar to U-shaped magnets, which produce a B0 field parallel to the surface of the system. The design leaves room for the sample to be placed between the upper magnets, with room for the RF coil and other hardware underneath the sample.To optimise the size and position of the magnet blocks, we simulated designs in COMSOL Multiphysics. Dimensions were optimised to produce the best balance between field strength, homogeneity and sweet spot position. Additionally, an aluminium frame was built to hold the magnet blocks, while still allowing ample amount of space to accommodate a sample/patient.
The RF coil is a 3 turn solenoid which is stretched in the y-direction, to match the sensitive volume of the magnet. Adjusting the coil height effectively moves the sweet spot deeper into the sample. MR experiments were run using a Magritek Kea 2 console with the internal RF amplifier.
The Diffusion-edited CPMG sequence uses a variable TE for the 1st echo to allow diffusion through the inhomogeneous field of the magnet to attenuate the signal12. The data is processed using a 2D Inverse Laplace Transform13 with a modified kernel to account for the range of gradients in the sampling volume. The custom inversion kernel is obtained by performing a calibration measurement on a sample of doped water, with a known diffusion coefficient12.
Results
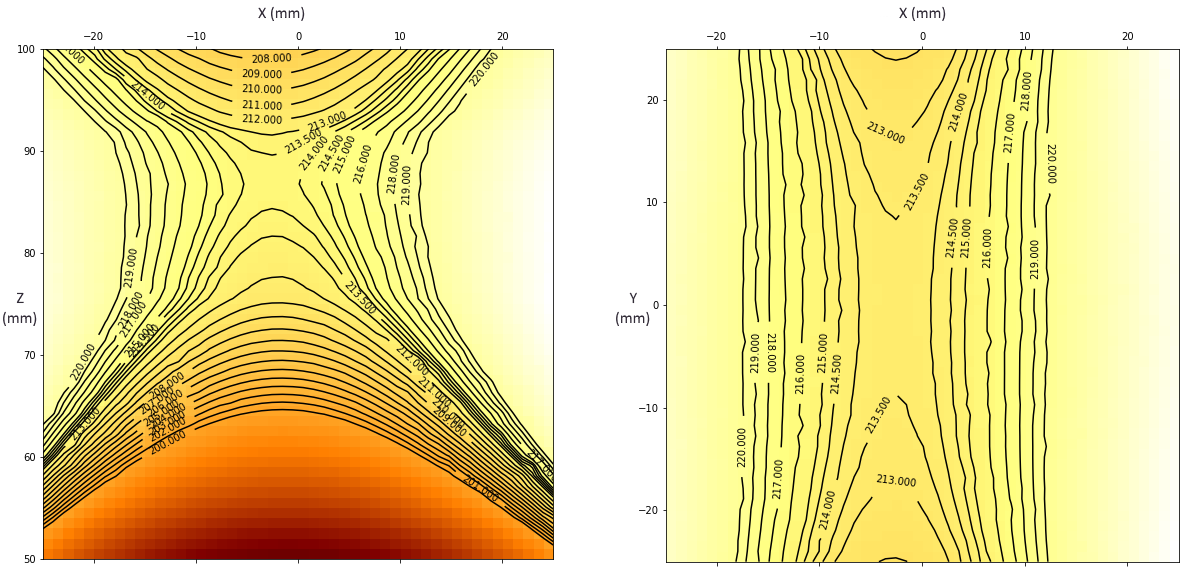
An in-house built field mapper was used to measure the field distribution, showing an x-shaped sweet spot which is homogeneous to 1mT (~40 kHz) at a height of 85 mm above the base plate. The region is 10 mm wide by 10 mm wide and extends 40 mm in the y-direction of the magnet. The field strength in this region is 0.21 T (~9.05 MHz) (Figure 2).To measure the sensitive region, doped water was added stepwise to a measuring cylinder, with the water height increasing in 1 mm steps. A series of CPMG experiments were run for each water height, at a range of frequencies, allowing the change in signal intensity from each step to be measured (Figure 3). This shows that most signal is detected from the area 84-85 mm above the yoke. It also suggests that changing the excitation frequency can be used to select different areas along the depth axis.
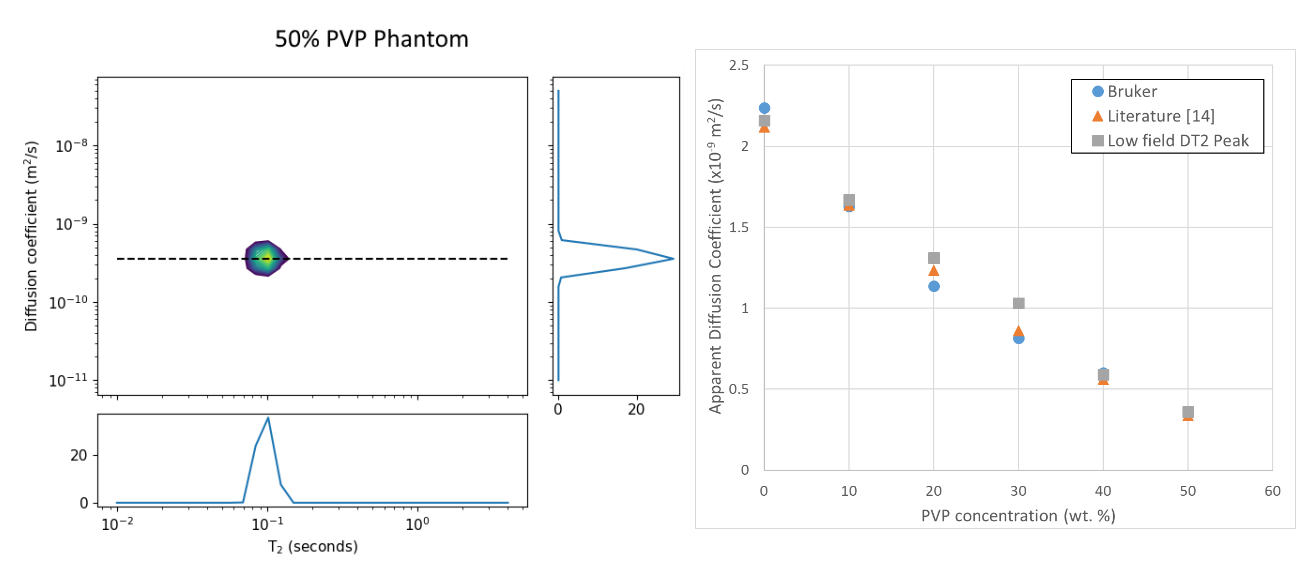
To test the feasibility of diffusion measurements with this system, a series of isotropic diffusion phantoms were prepared using 5 different concentrations of K30 polyvinylpyrrolidone (PVP) (Sigma-Aldrich) in doped water. All experiments took place at room temperature. Diffusion coefficients for the phantoms were also measured with a Bruker Avance 400 NMR system. The measured DT2 correlation maps from the 9 MHz system show a single peak (Figure 4 Left). Across the different samples, the diffusion coefficients of the peaks agree with the measurements from the Avance system and with values from the literature14 (Figure 4 Right).
Discussion and Conclusion
Our magnet design produces a large homogeneous region of field deeper in the sample than previous magnet systems. The homogeneity of the magnet also reduces the effect of diffusive attenuation when measuring using longer CPMG echo times.We have found that DT2 measurements within our new single sided system are in good agreement with the high field measurements for samples in the physiologically relevant range. This technique can also be used to identify multiple components in the sample, which may be useful for characterising tissue.
This magnet design and DT2 experiment will improve the range of biomedical applications of single sided MR devices.
Acknowledgements
This project is funded by the New Zealand Ministry of Business Innovation and EmploymentReferences
1. Casanova F, Perlo J, Blümich B. Single-Sided NMR. 2011 Springer
2. Bashyam A, Frangieh CJ, Li M, Cima MJ. Dehydration assessment via portable, single sided magnetic resonance sensor. Magn. Reson. Med. 2019;0
3. Colucci LA et al. Fluid assessment in dialysis patients by point-of-care magnetic relaxometry. Sci. Transl. Med. 2019;11
4. Ali TS et al. Transverse relaxation-based assessment of mammographic density and breast tissue composition by single-sided portable NMR. Magn. Reson. Med. 2019;82:1199–1213
5. Brizi L et al. Bone volume–to–total volume ratio measured in trabecular bone by single-sided NMR devices. Magn. Reson. Med. 2017l;79:501–510
6. Sarda Y, Bergman E, Hillel I,
Binderman I, Nevo U. Detection of bone marrow changes related to
estrogen withdrawal in rats with a tabletop stray-field NMR scanner. Magn.
Reson. Med. 2017;78:860–870
7. Manz B et al. A mobile one-sided NMR sensor with a homogeneous magnetic field: The NMR-MOLE. J. Magn. Reson 2006;183:25–31
8. Bashyam A, Li M, Cima MJ. Design and experimental validation of Unilateral Linear Halbach magnet arrays for single-sided magnetic resonance. J. Magn. Reson. 2018
9. Greer M, Chen C, Mandal S. An Easily Reproducible, Hand-Held, Single-Sided, MRI Sensor. J. Magn. Reson. 2019
10. Galvosas P, Callaghan PT. Multi-dimensional inverse Laplace spectroscopy in the NMR of porous media. Comptes Rendus Phys. 2010;11:172–180
11. Bernin D, Topgaard D. NMR diffusion and relaxation correlation methods: New insights in heterogeneous materials. Curr. Opin. Colloid Interface Sci. 2013;18:166–172
12. Nogueira d’Eurydice M, Galvosas P. Measuring diffusion–relaxation correlation maps using non-uniform field gradients of single-sided NMR devices. J. Magn. Reson. 2014;248:137–145
13. Teal PD, Eccles C. Adaptive truncation of matrix decompositions and efficient estimation of NMR relaxation distributions. Inverse Probl. 2015;31
14. Wagner F et al. Temperature and concentration calibration of aqueous polyvinylpyrrolidone (PVP) solutions for isotropic diffusion MRI phantoms. PLOS ONE 2017;12
Figures
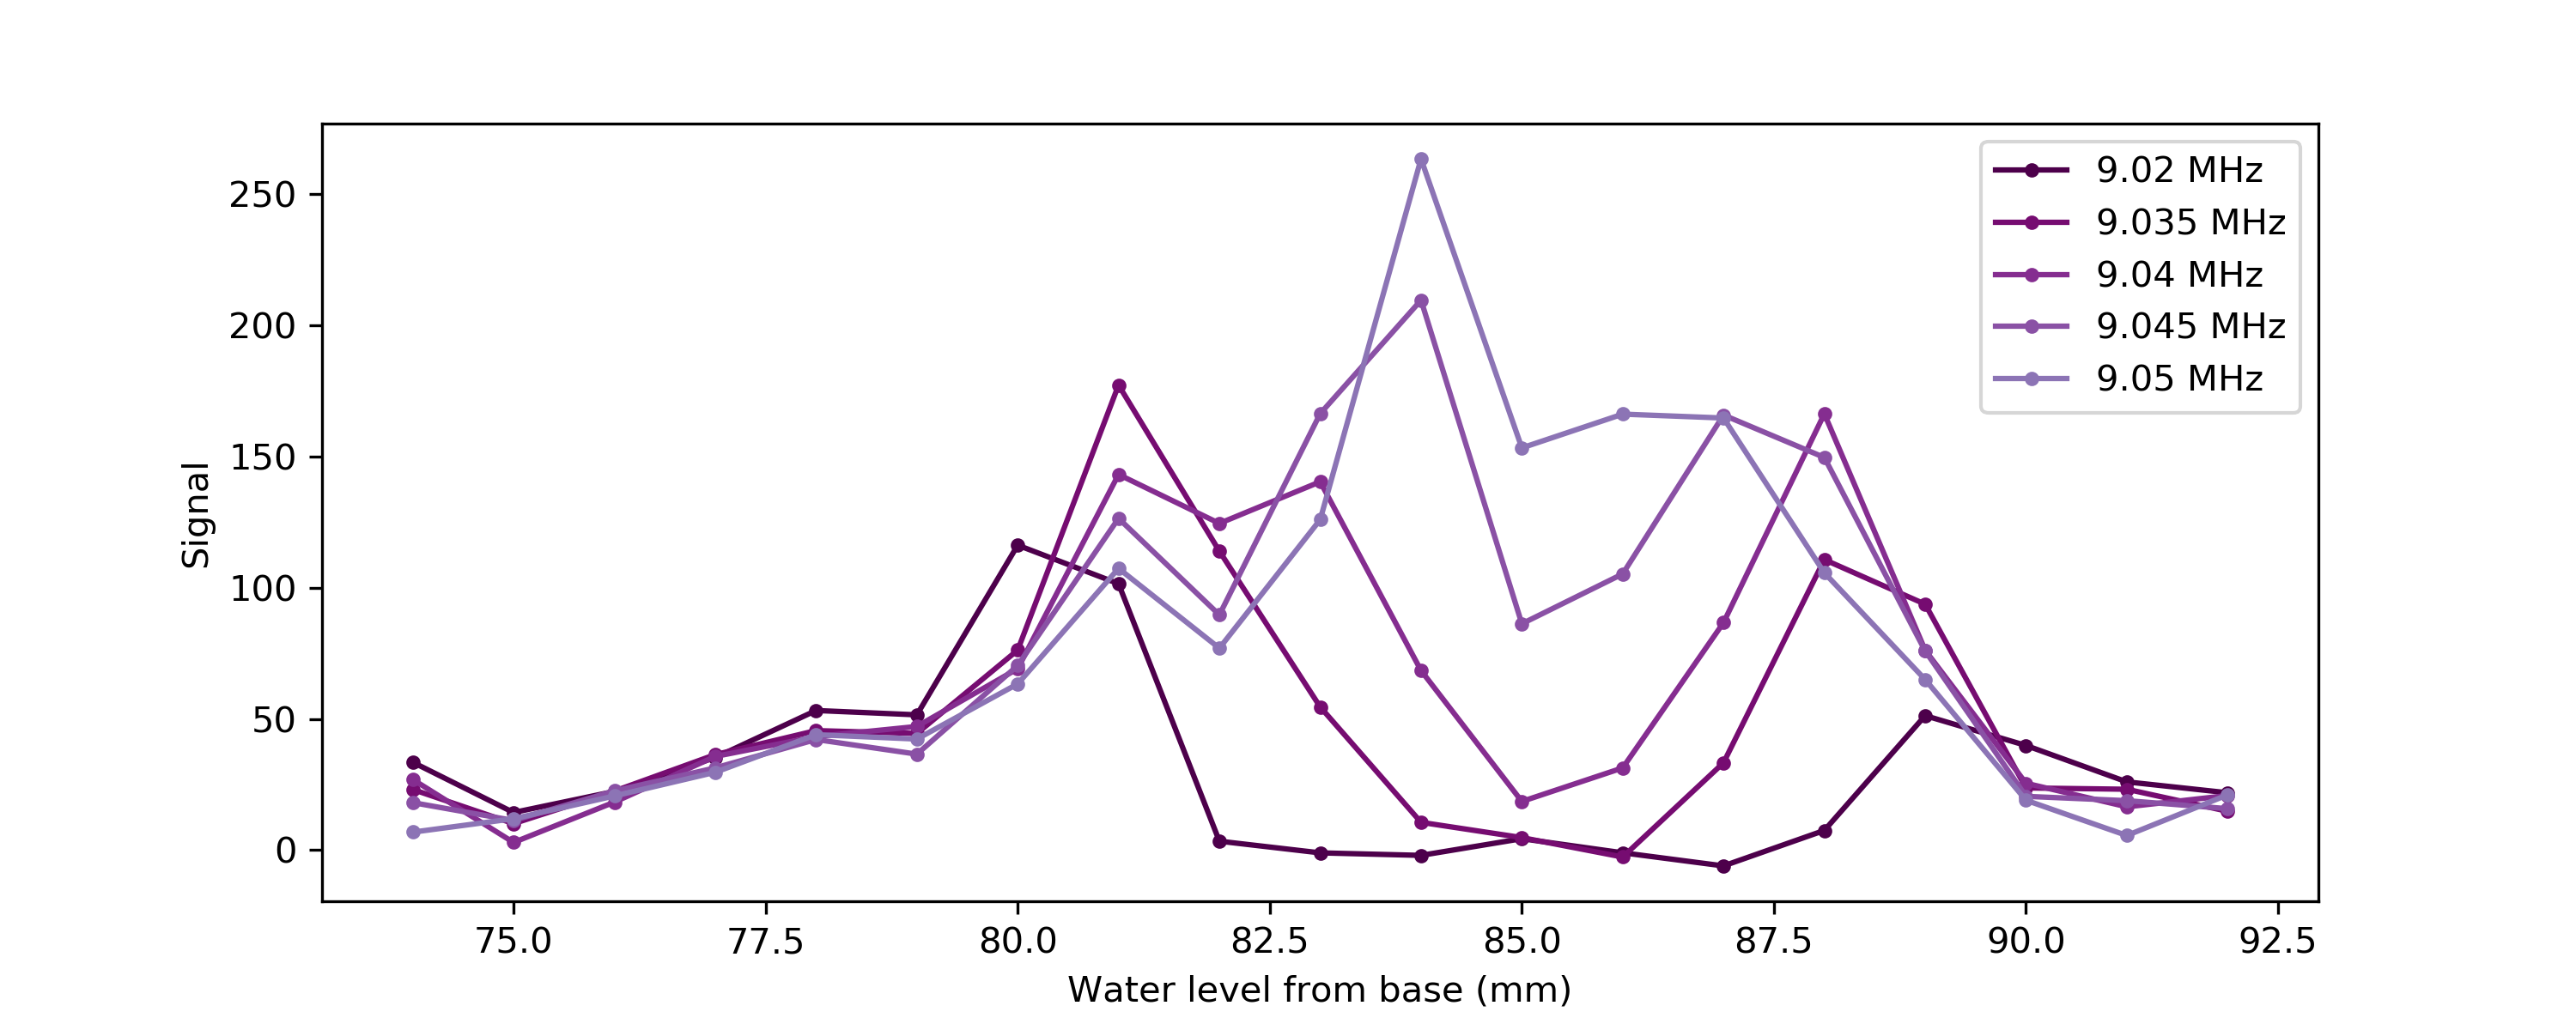
Depth profile of magnet showing change in signal measured at each water height. Measurements taken at resonant frequency (9.05 MHz) and 4 lower frequencies. Areas with weaker B0 field and therefore lower resonant frequency occur above and below the sweet spot, similar to the field map in Figure 2.
Coil positioned at 73 mm above base plate. CPMG parameters: 90 pulse = -9dB 40 μs. 180 pulse = -3db 40 μs. Echo time = 1 ms, Nechoes = 1000, Nscans = 4.