1254
Estimation of Multiple Sclerosis Lesion Age without Gadolinium using Quantitative Susceptibility Maps1Weill Cornell, New York, NY, United States, 2University of Colorado Denver, Denver, CO, United States
Synopsis
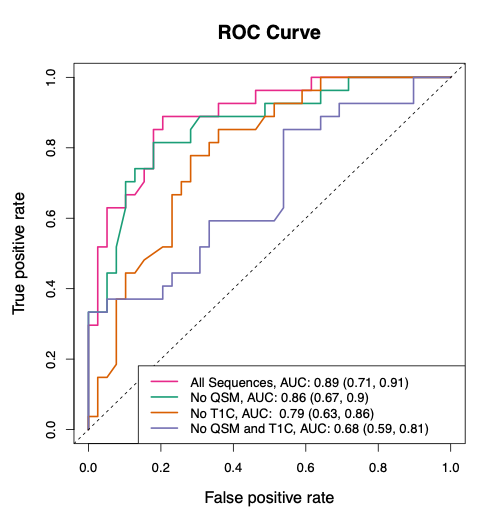
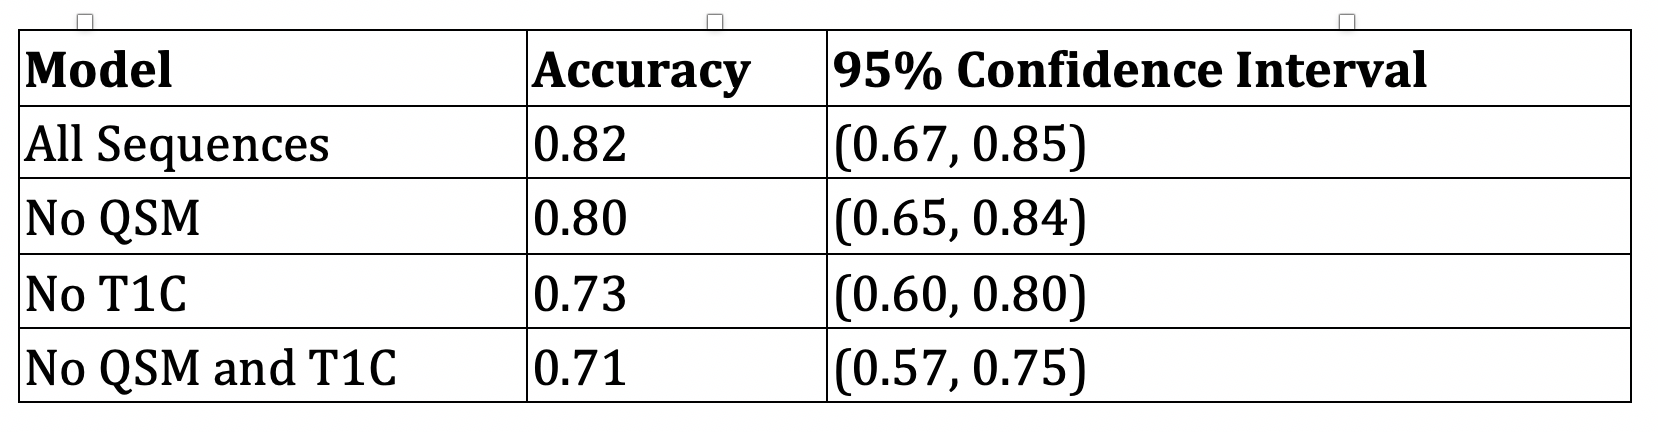
We propose a method to estimate multiple sclerosis (MS) lesion age (less than or greater than a year old) using non-gadolinium magnetic resonance imaging. The method utilizes the less invasive Quantitative Susceptibility Map. Radiomic features are calculated over a lesion and a random forest classification model is used. In a validation set, the model has an AUC of 0.79 (95% CI: [0.63, 0.86]) and an accuracy of 0.73 (95% CI: [0.60, 0.80]). This method can be used to aid in the diagnosis of MS, as part of the diagnostic criteria is to show lesion dissemination in time.
Introduction
The McDonald criteria1and its subsequent revisions2-4 are the current criteria used to diagnose multiple sclerosis (MS). Part of the current McDonald diagnostic criteria requires lesions be observed on magnetic resonance imaging (MRI) at different time points for a diagnosis of MS – referred to as the dissemination of lesions in time4. Intravenous gadolinium enhancing MRI can be used to demonstrate dissemination in time from a single time point on MRI for an MS diagnosis4. Intravenous gadolinium is expensive, invasive to patients, and has recently come under scrutiny because it has been found that gadolinium deposits are left in the brain after scanning5. Here we introduce a method that can estimate lesion age (less than a year old or greater than a year old) and demonstrate dissemination in time using MRI sequences acquired without gadolinium. To our knowledge, no methods have been developed to explicitly estimate the age of MS lesions. The method utilizes Quantitative Susceptibility Mapping (QSM), a type of imaging that provides in vivo quantification of susceptibility changes related to iron deposition in the brain6 and has been widely used to study lesion dynamics in MS7-9.Methods
We obtained a cohort of 19 patients from an ongoing, longitudinal prospective MS MRI and clinical data base. These patients have a total of 31 new gadolinium enhancing lesions that were observed at a total of 147 time points. Brain MRIs were performed on 3T MR imaging scanners (Signa HDxt, GE Healthcare, Milwaukee, Wisconsin, with a product 8-channel head coil; Magnetom Skyra, Siemens, Erlangen, Germany with a product 20-channel head/neck coil). We acquired 3D-T2-weighted FLAIR (FLAIR), 3D-T1WI (T1), 2D-T2WI (T2), QSM, and gadolinium-enhanced 3D-T1WI (T1C). New gadolinium enhancing MS lesions were identified on the T1C images and for each of the 31 new gadolinium enhancing lesions, longitudinal manual lesion segmentation was performed. The age of the lesions was calculated by taking the time of first appearance to the current time point. Age was then assigned to be less than a year and greater than a year at each time point.First-order radiomic features were calculated over the lesion for each MRI sequence at each time point10,11. Shape-based radiomic features were also calculated over the lesion mask. Patients were then randomized to a training (9 patients, 16 lesions, 81 time points) and validation set (10 patients, 15 lesions, 66 time points). As a large number of radiomic features were generated for each sequence, principal component analysis (PCA) was performed to reduce the dimensionality of the data. PCA was performed only on the observations in the training set. A random forest classification model was fit in the training set and predictions were made in the validation set. Four different random forest regression models were fit: a model utilizing all of the sequences, a model excluding the T1C sequence, a model excluding the QSM sequence, and a model excluding the QSM and T1C sequences. Receiver operating characteristic curves (ROC) and area under the ROC (AUC) were calculated for each of the models. The predicted probabilities from the random forest classification model were thresholded using Youden’s J statistic and accuracy was calculated. Subjects were bootstrapped to the training and validation set to calculate 95% confidence intervals.
Results
The ROC and AUC results from the random forest model predictions in the validation set can be seen in Figure 1. The best performing model in the validation set is the model that utilizes all sequences, followed by the no QSM model, the no T1C model, and the no QSM and T1C model. The accuracy results from the random forest model predictions in the validation set can be seen in Table 1. As expected, these results mirror those of the ROC analysis.Discussion
The results are suggestive that a model utilizing all sequences outperforms the other models. This model has an AUC of 0.89 (95% CI: [0.71, 0.91]) and an accuracy of 0.82. We are most interested in a model that excludes the T1C and does not use gadolinium. The model without T1C that includes the QSM performs less well than the model with all sequences, but still has good predictive performance. This model has an AUC of 0.79 (95% CI: [0.63, 0.86]) and an accuracy of 0.73 (95% CI: [0.60, 0.80]). The model excluding the T1C that includes QSM performs better than the model without both the T1C and QSM, indicating that the QSM is important for predicting the age of lesions.Conclusion
For this analysis, we built predictive models of whether a lesion is less than or greater than a year old. The results from this model have the potential to satisfy dissemination in time of the McDonald criteria, in cases where one lesion is predicted to be less than a year (newer) and one is predicted to be greater than a year (older). The models using the gadolinium enhancing scans (T1C) had better performance, but a model utilizing the QSM without the T1C had good performance. This model without the T1C has the potential to replace the gadolinium scan in demonstrating dissemination in time from a single time point.Acknowledgements
No acknowledgement found.References
1. W. I. McDonald, A. Compston, G. Edan, D. Goodkin, H.-P. Hartung, F. D. Lublin, H. F. McFarland, D. W. Paty, C. H. Polman, S. C. Reingold, et al., “Recommended diagnostic cri- teria for multiple sclerosis: guidelines from the international panel on the diagnosis of multiple sclerosis,” Annals of Neurology: Official Journal of the American Neurological Association and the Child Neurology Society, vol. 50, no. 1, pp. 121–127, 2001.
2. C. H. Polman, S. C. Reingold, G. Edan, M. Filippi, H.-P. Hartung, L. Kappos, F. D. Lublin, L. M. Metz, H. F. McFarland, P. W. O’Connor, et al., “Diagnostic criteria for multiple scle- rosis: 2005 revisions to the mcdonald criteria,” Annals of Neurology: Official Journal of the American Neurological Association and the Child Neurology Society, vol. 58, no. 6, pp. 840– 846, 2005.
3. C. H. Polman, S. C. Reingold, B. Banwell, M. Clanet, J. A. Cohen, M. Filippi, K. Fujihara, E. Havrdova, M. Hutchinson, L. Kappos, et al., “Diagnostic criteria for multiple sclerosis: 2010 revisions to the mcdonald criteria,” Annals of neurology, vol. 69, no. 2, pp. 292–302, 2011.
4. A. J. Thompson, B. L. Banwell, F. Barkhof, W. M. Carroll, T. Coetzee, G. Comi, J. Correale, F. Fazekas, M. Filippi, M. S. Freedman, et al., “Diagnosis of multiple sclerosis: 2017 revisions of the mcdonald criteria,” The Lancet Neurology, vol. 17, no. 2, pp. 162–173, 2018.
5. V. Gulani, F. Calamante, F. G. Shellock, E. Kanal, S. B. Reeder, et al., “Gadolinium de- position in the brain: summary of evidence and recommendations,” The Lancet Neurology, vol. 16, no. 7, pp. 564–570, 2017.
6. Y. Wang, P. Spincemaille, Z. Liu, A. Dimov, K. Deh, J. Li, Y. Zhang, Y. Yao, K. M. Gillen, A. H. Wilman, et al., “Clinical quantitative susceptibility mapping (qsm): biometal imaging and its emerging roles in patient care,” Journal of Magnetic Resonance Imaging, vol. 46, no. 4, pp. 951–971, 2017.
7. C. Wisnieff, S. Ramanan, J. Olesik, S. Gauthier, Y. Wang, and D. Pitt, “Quantitative suscep- tibility mapping (qsm) of white matter multiple sclerosis lesions: interpreting positive suscep- tibility and the presence of iron,” Magnetic resonance in medicine, vol. 74, no. 2, pp. 564–570, 2015.
8. C. Langkammer, T. Liu, M. Khalil, C. Enzinger, M. Jehna, S. Fuchs, F. Fazekas, Y. Wang, and S. Ropele, “Quantitative susceptibility mapping in multiple sclerosis,” Radiology, vol. 267, no. 2, pp. 551–559, 2013.
9. C. Stu ̈ber, D. Pitt, and Y. Wang, “Iron in multiple sclerosis and its noninvasive imaging with quantitative susceptibility mapping,” International journal of molecular sciences, vol. 17, no. 1, p. 100, 2016.
10. M. Kolossv ́ary, J. Kar ́ady, B. Szilveszter, P. Kitslaar, U. Hoffmann, B. Merkely, and P. Maurovich-Horvat, “Radiomic features are superior to conventional quantitative computed tomographic metrics to identify coronary plaques with napkin-ring sign,” Circulation: Car- diovascular Imaging, vol. 10, no. 12, p. e006843, 2017.
11. M. Kolossva ́ry, M. Kellermayer, B. Merkely, and P. Maurovich-Horvat, “Cardiac computed tomography radiomics,” Journal of thoracic imaging, vol. 33, no. 1, pp. 26–34, 2018.
Figures