1248
Comparing stimulus and resting state fMRI at 3T and 7T reveal a superiority of 7T in detecting changes in subcortical networks
Silke Kreitz1,2, Angelika Mennecke1, Laura Cristina Konerth 2, Armin Nagel3, Frederic Laun3, Michael Uder3, Arnd Doerfler1, and Andreas Hess2
1Department of Neuroradiology, University Hospital Erlangen, Friedrich-Alexander-University Erlangen-Nürnberg, Erlangen, Germany, 2Institute of Experimental and Clinical Pharmacology and Toxicology, Friedrich-Alexander University Erlangen-Nurnberg, Erlangen, Germany, 3Department of Radiology, University Hospital of the Friedrich-Alexander University Erlangen-Nürnberg, Erlangen, Germany
1Department of Neuroradiology, University Hospital Erlangen, Friedrich-Alexander-University Erlangen-Nürnberg, Erlangen, Germany, 2Institute of Experimental and Clinical Pharmacology and Toxicology, Friedrich-Alexander University Erlangen-Nurnberg, Erlangen, Germany, 3Department of Radiology, University Hospital of the Friedrich-Alexander University Erlangen-Nürnberg, Erlangen, Germany
Synopsis
7T MRI is hoped to improve diagnostics, therapy and research of neurological diseases. Here, we characterize the influence of field strength on fMRI approaches including task based and RS-fMRI. Quality metrics revealed a basic separation of 3T and 7T fMRI data, mainly by tSNR, MDI, CNR and EFC. 7T fMRI showed higher BOLD response amplitudes, more functional connections and higher connectivity strength especially in inferior brain regions. Though higher variability between subjects at 7T likely requires enhanced statistical power in group comparisons, intra individual fMRI measurements might detect subtle connectivity changes at 7T useful for diagnosis and therapy.
Introduction
Ultra-high field 7T MRI nourishes the hope for a better diagnostic accuracy, therapy control and research of neurological diseases due to improved spatial and temporal SNR. This was recently exemplified in better detection of MS cortical lesions1 and resting state (RS) differences in mood-related circuit disturbances in depression2 using 7T compared to 3 T. However, higher B0 inhomogeneity and more susceptibility artifacts resulting in geometric distortion and signal disturbances might hamper the advantages of higher field strength especially in functional MRI (fMRI). Here, we comprehensively characterize the influence of field strength on the outcome especially of fMRI approaches including task based and RS-fMRI.Methods
A total of 18 healthy subjects (aged 19-55, 8 females) with no history of neurological diseases or psychiatric disorders were scanned at 3T (Magnetom Skyra, Siemens, Germany) and 7T (Magnetom Terra, Siemens, Germany).Each session consisted of a standard MPRAGE anatomy followed by three functional EPI scans (3T: TR=2000 ms, TE= 27.8 ms, isotropic voxel resolution = 2 mm, matrix 126x126, FOV 25.2x25.2 cm, 72 slices, 7T: TR=2000 ms, TE=21 ms, isotropic voxel resolution= 1.5 mm, matrix 168x168, FOV=25.2x25.2 cm, 84 slices). The different voxel resolutions for 3T and 7T were chosen to compensate for field strength related differences in SNR. The first functional scan measured RS with 300 volumes (10 min), the second included a finger tapping motor task (7 repetitions of 7 sec right hand ft, 105 volumes, 3.5 min) followed by an additional RS scan. To assess reliability of repeated measures, 9 subjects performed no motor task in the second session.
Standard preprocessing was performed including inter-slice time, motion correction, and spatial Gaussian smoothing (FWHM 4.5 mm). RS data were bandpass filtered between 0.009 Hz and 0.08 Hz and after white matter and ventricle time course regression analyzed using a new approach combining classical seed correlation analysis and graph theory3,4.
Initially, the following quality metrics were calculated using the first inter-slice time and motion corrected RS measurement: tSNR, standardized DVARS5, median distance index (MDI)6, global correlation (GCOR)7, SNR8, CNR8, foreground to background energy ratio (FBER), and entropy focus criterion9. Task driven data were temporally Gaussian smoothed (FWHM 4s) and analyzed using GLM to detect significantly activated voxels. Each subject’s brain was individually parcellated into 158 brain regions using the Havard-Oxford cortical and subcortical and the SUIT cerebellar probabilistic atlas. For group comparison brain image were registered to the MNI space using a symmetric diffeomorphic warping (ANTS).
Reproducibility of repeated RS measurements were assessed by cross correlation of the individual connectivity matrices resulting from the RS analysis.
Results
PCA of quality measures clearly revealed a separation of measurements acquired with 3T and 7T along the first PC (Fig. 1A). The spatial quality metrics CNR and EFC showed the strongest positive and the temporal metrics tSNR and MDI the strongest negative loadings on that PC (Fig. 1B).Finger tapping motor task induced activated voxels in several brain regions including left and right motor and sensory cortex, middle and superior frontal gyrus and cerebellum. The total activated volume did not significantly differ according to field strength, though locally the cerebellum was more activated with 7T (Fig. 2A). However, the regions specific maximum response amplitude was significantly enhanced in 7T data. Moreover, the shape of the 7T response amplitude indicated a biphasic response which could not be observed in the 3T data (Fig. 2B).
RS connectivity was enhanced at 7T, which was reflected in both enhanced number of significant connections and average connectivity strength (Fig. 3A). Network based statistics (NBS)10 revealed that especially inferior regions (subcortical, temporal and cerebellar) showed enhanced connectivity strength (Fig. 3B). Additionally, only with 7T we could detect significant motor task induces alterations in RS connectivity (second vs. first RS measurement) especially in the contralateral motor cortex and middle frontal gyrus (Fig. 3C).
Reproducibility of RS connectivity between subjects were significantly higher using 3T compared to 7T, but reproducibility within subjects showed no difference according to the field strength (Fig. 4).
Discussion
Since we compensated for spatial SNR by adapting voxel resolution, the dominant effect of SNR on data quality observed by others11 was reduced in this study. Here, data quality was dominantly impacted by EFC (related to susceptibility and motion artifacts), MDI, CNS and tSNR. Presumably due to the higher BOLD [MO1] amplitude, the field strength mainly affects the brain’s functional connectivity rather than task related statistical parametric maps. Though the higher variability between subjects at 7T likely requires enhanced statistical power in group comparisons, intra individual ultra-high field functional MRI measurements might detect connectivity changes that are overlooked using 3T MRI. These small changes can be useful hints for diagnosis and therapy success. In particular, the improved detectability of the inferior brain region circuitry with 7T MRI greatly enhances future investigations of diseases involving such subcortical regions e.g. in depression (as shown by Morris et al.2) or Parkinson’s disease.Acknowledgements
No acknowledgement found.References
- Maranzano, J., et al., Comparison of Multiple Sclerosis Cortical Lesion Types Detected by Multicontrast 3T and 7T MRI. AJNR Am J Neuroradiol, 2019. 40(7): p. 1162-1169.
- Morris, L.S., et al., Ultra-high field MRI reveals mood-related circuit disturbances in depression: a comparison between 3-Tesla and 7-Tesla. Transl Psychiatry, 2019. 9(1): p. 94.
- Kreitz, S., et al., A New Analysis of Resting State Connectivity and Graph Theory Reveals Distinctive Short-Term Modulations due to Whisker Stimulation in Rats. Frontiers in Neuroscience, 2018. 12: p. 334.
- Mendez-Torrijos, A., Kreitz, S., et al., Snack food as a modulator of human resting-state functional connectivity. CNS Spectr, 2018: p. 1-12.
- Afyouni, S. and T.E. Nichols, Insight and inference for DVARS. Neuroimage, 2018. 172: p. 291-312.
- Cox, R.W., AFNI: software for analysis and visualization of functional magnetic resonance neuroimages. Comput Biomed Res, 1996. 29(3): p. 162-73.
- Saad, Z.S., et al., Correcting brain-wide correlation differences in resting-state FMRI. Brain Connect, 2013. 3(4): p. 339-52.
- Magnotta, V.A., L. Friedman, and B. First, Measurement of Signal-to-Noise and Contrast-to-Noise in the fBIRN Multicenter Imaging Study. J Digit Imaging, 2006. 19(2): p. 140-7.
- Atkinson, D., et al., Automatic correction of motion artifacts in magnetic resonance images using an entropy focus criterion. IEEE Trans Med Imaging, 1997. 16(6): p. 903-10.
- Zalesky, A., A. Fornito, and E.T. Bullmore, Network-based statistic: identifying differences in brain networks. Neuroimage, 2010. 53(4): p. 1197-207.
- Jarrahi, B. and S. Mackey, Characterizing the Effects of MR Image Quality Metrics on Intrinsic Connectivity Brain Networks: A Multivariate Approach. Conf Proc IEEE Eng Med Biol Soc, 2018. 2018: p. 1041-1045.
Figures
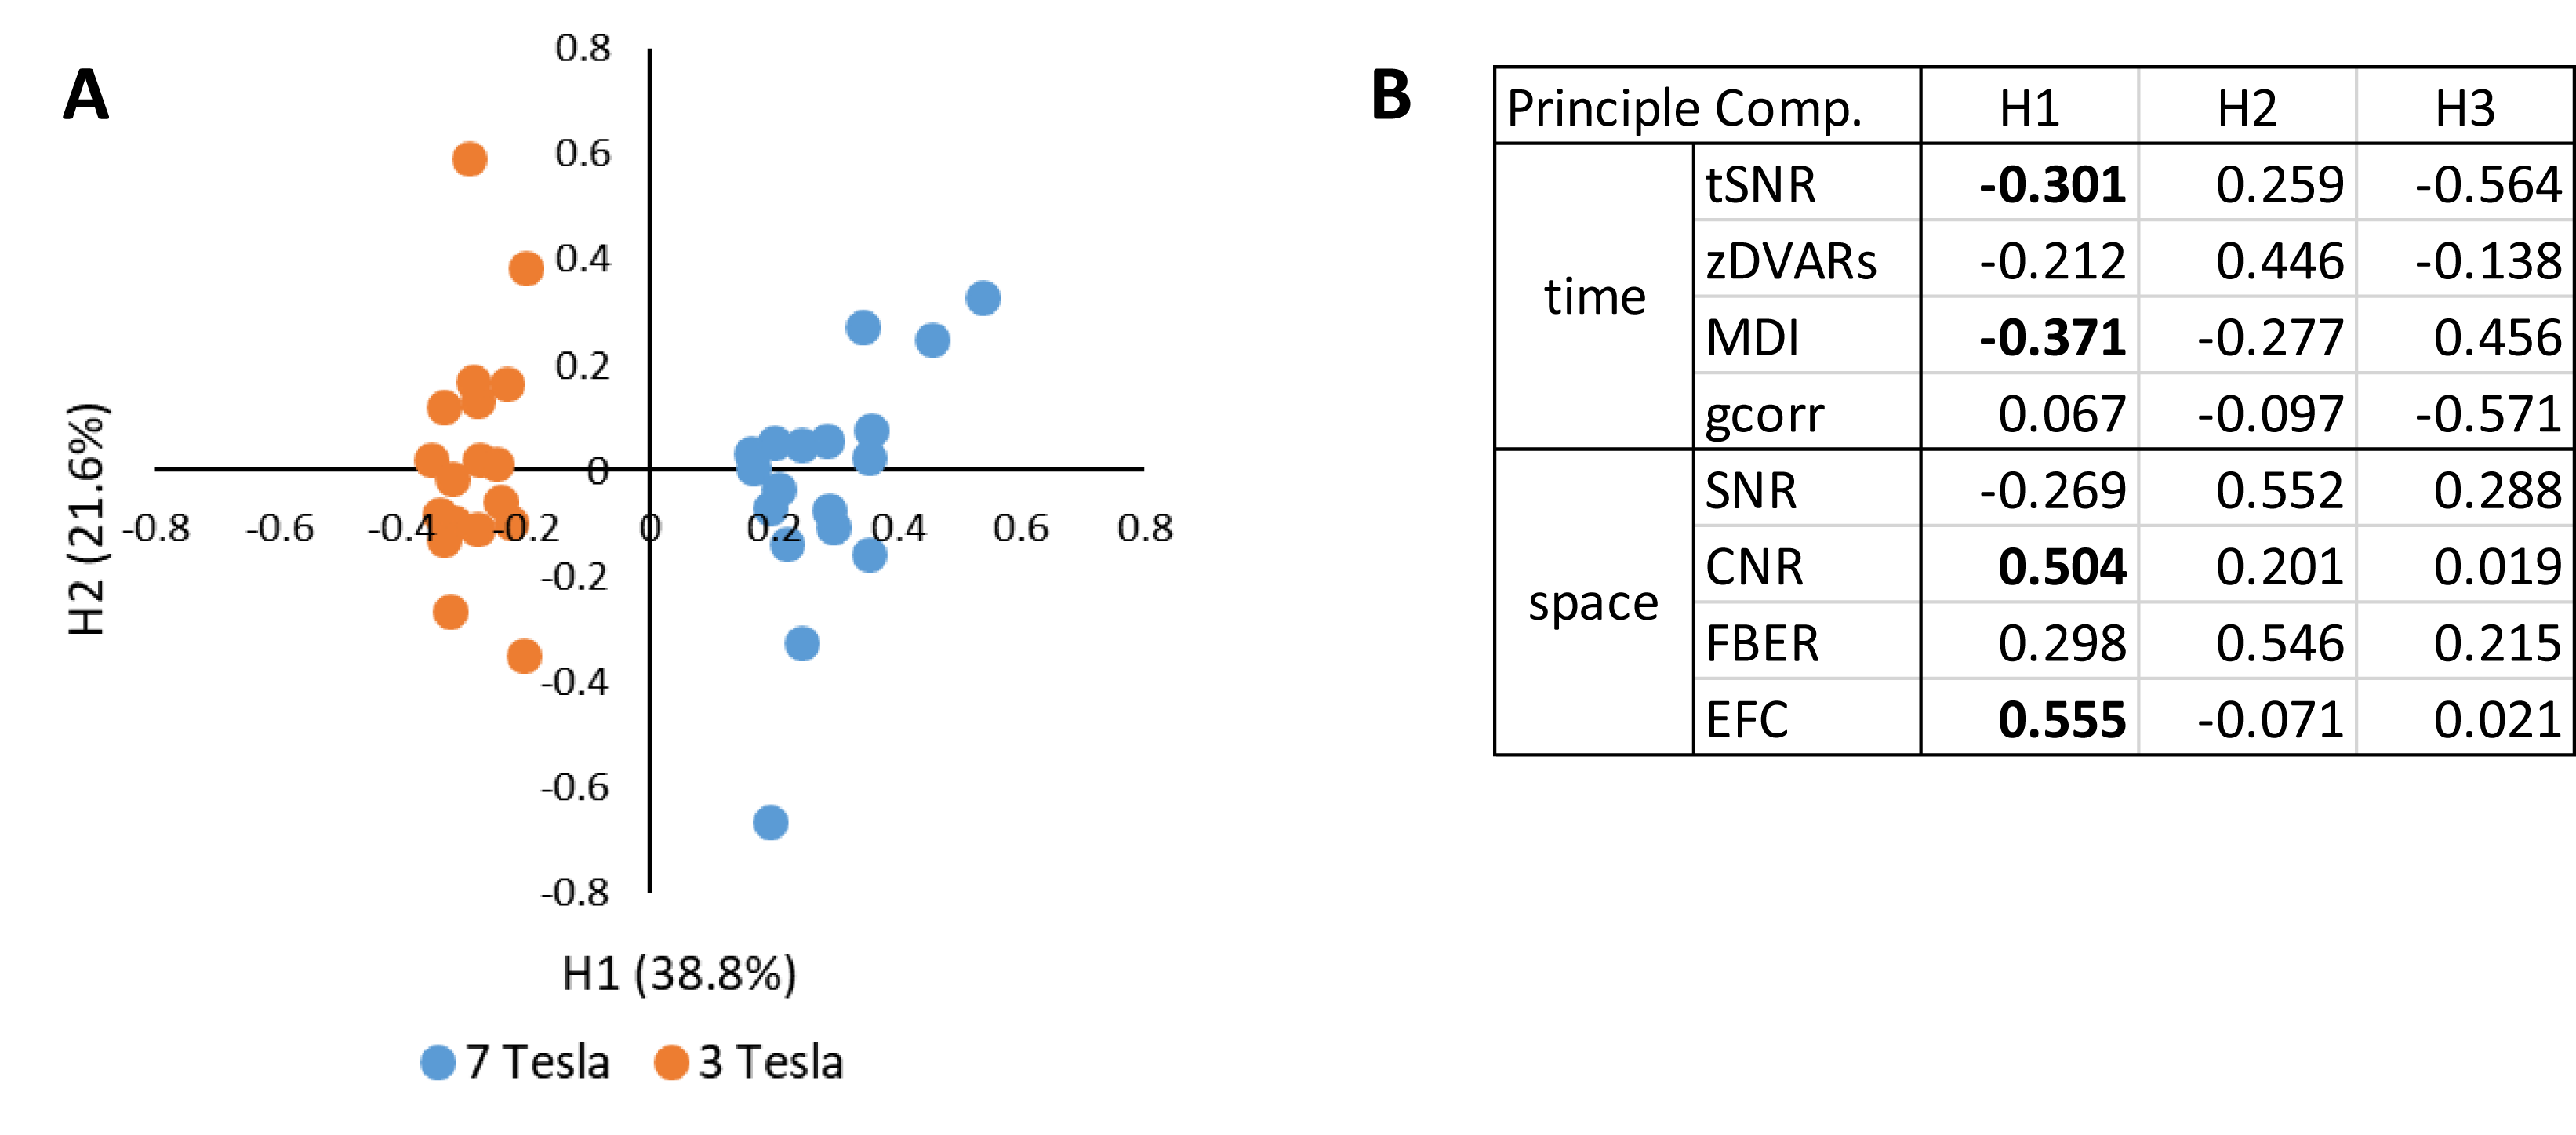
Fig. 1. Quality metrics of 3T and 7T first resting state scans. A) PCA projection on the first two principle components, B) Loadings of quality metrics on principle components.
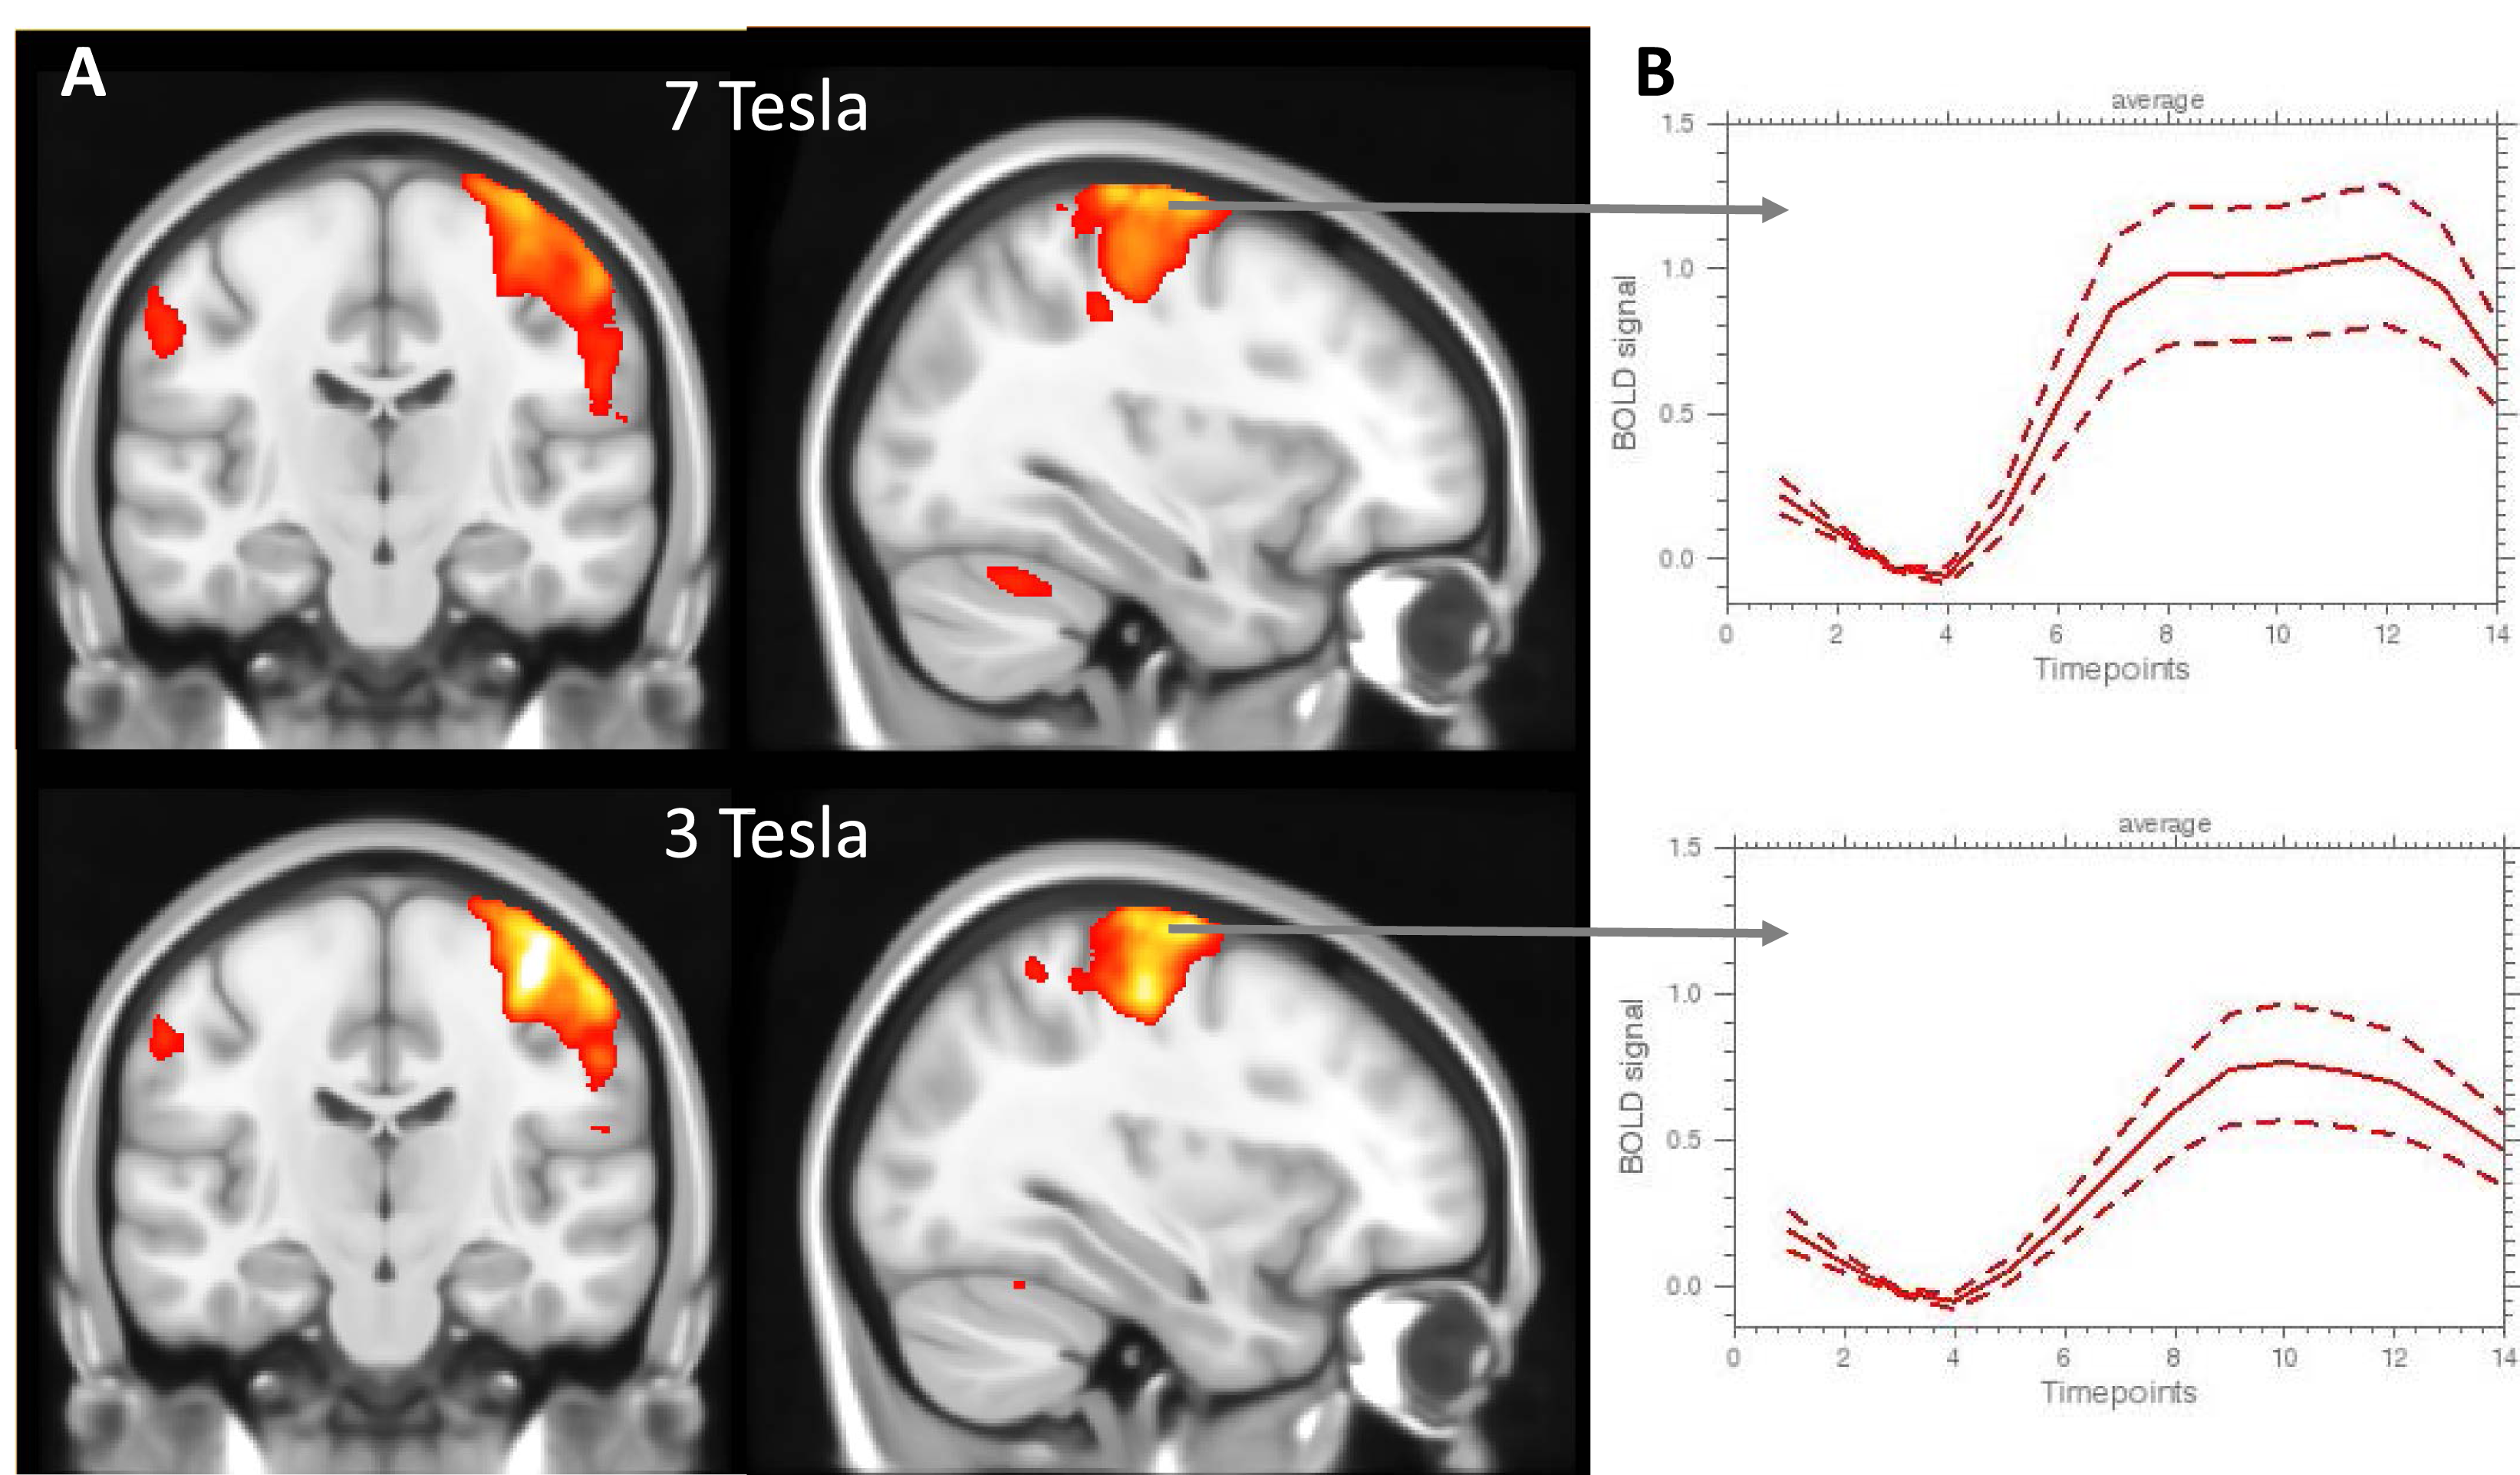
Fig. 2: Finger tapping motor task: A) statistical parametric group maps, B) mean BOLD signal time courses of activated voxels in motor cortex (solid line: average over subjects, dotted lines: standard deviation over subjects)
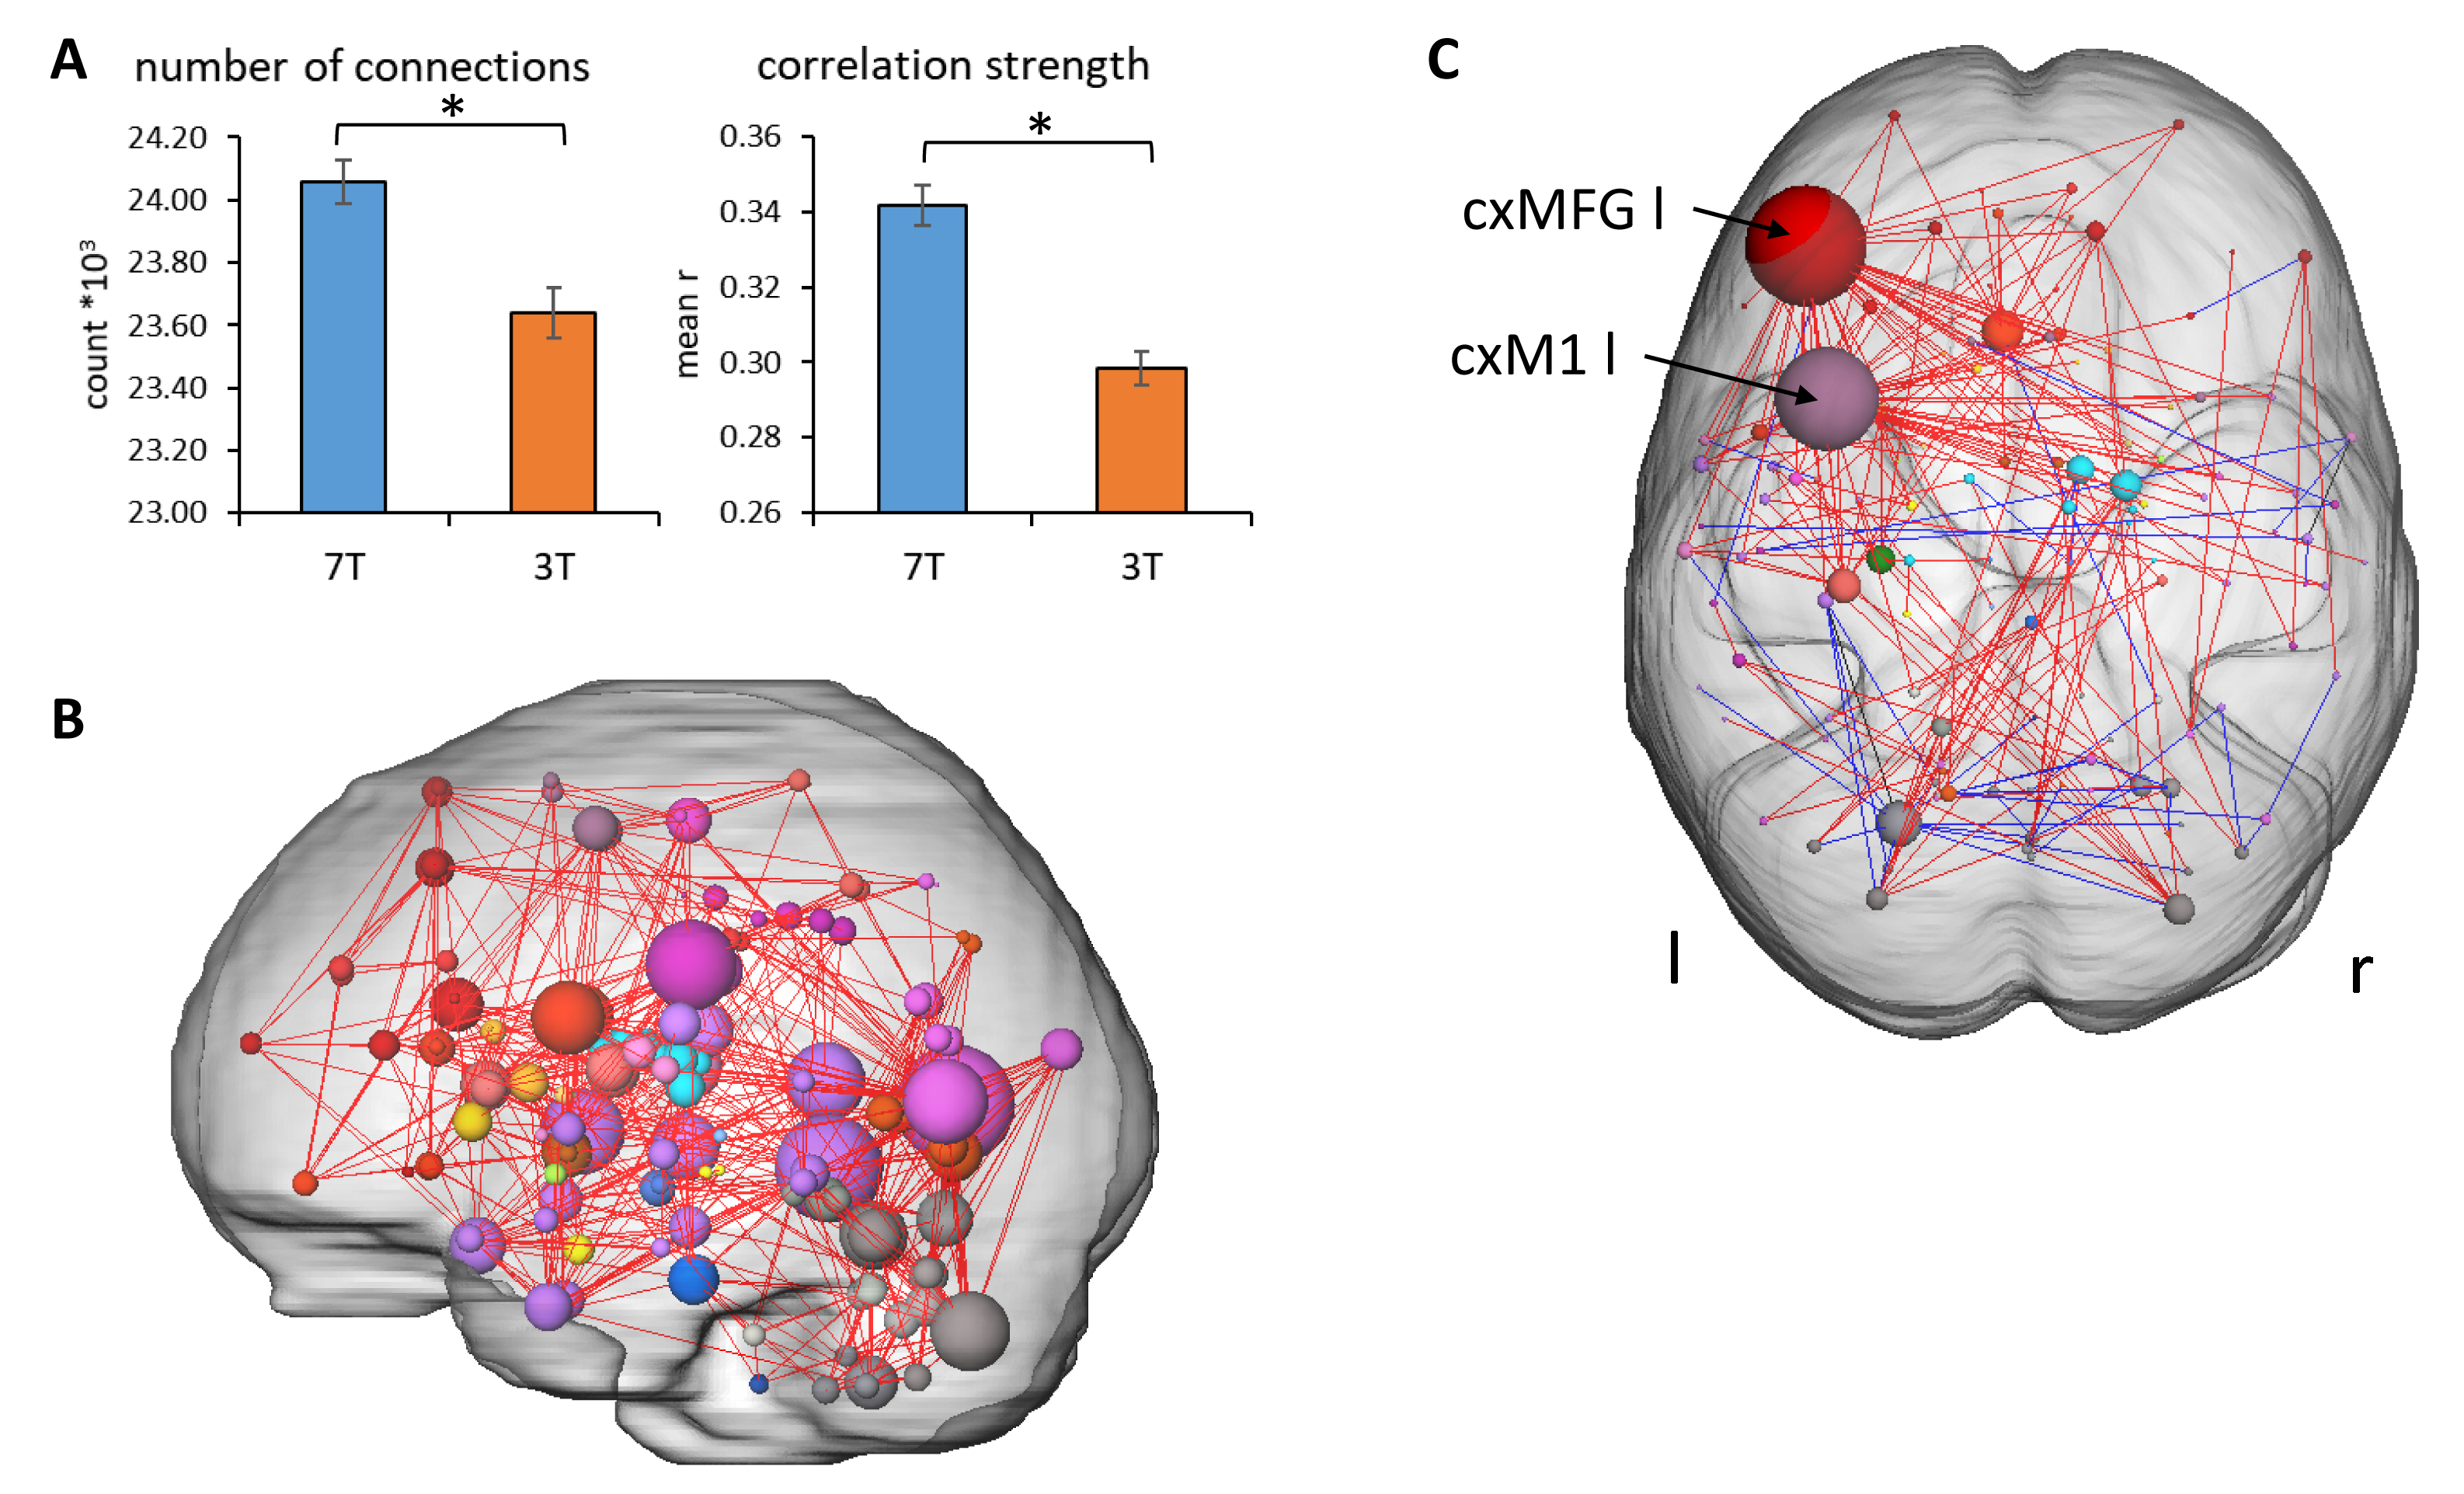
Fig. 3: Resting state connectivity. A) Average number of connections and correlation strength of the first resting state measurements. *: p<0.05, paired t-test. B) significant enhanced connectivity strength between 3T and 7T first RS scans (NBS, p<0.05, corrected). C: Significant differences of 7T second RS scan between subjects with (ft) and without (ctrl) motor task prior to the second RS. red lines: ft > ctrl, blue lines: ft < ctrl. cxMFG l: left middle frontal gyrus, cxM1 l: left primary motor cortex. NBS, p<0.05, corrected
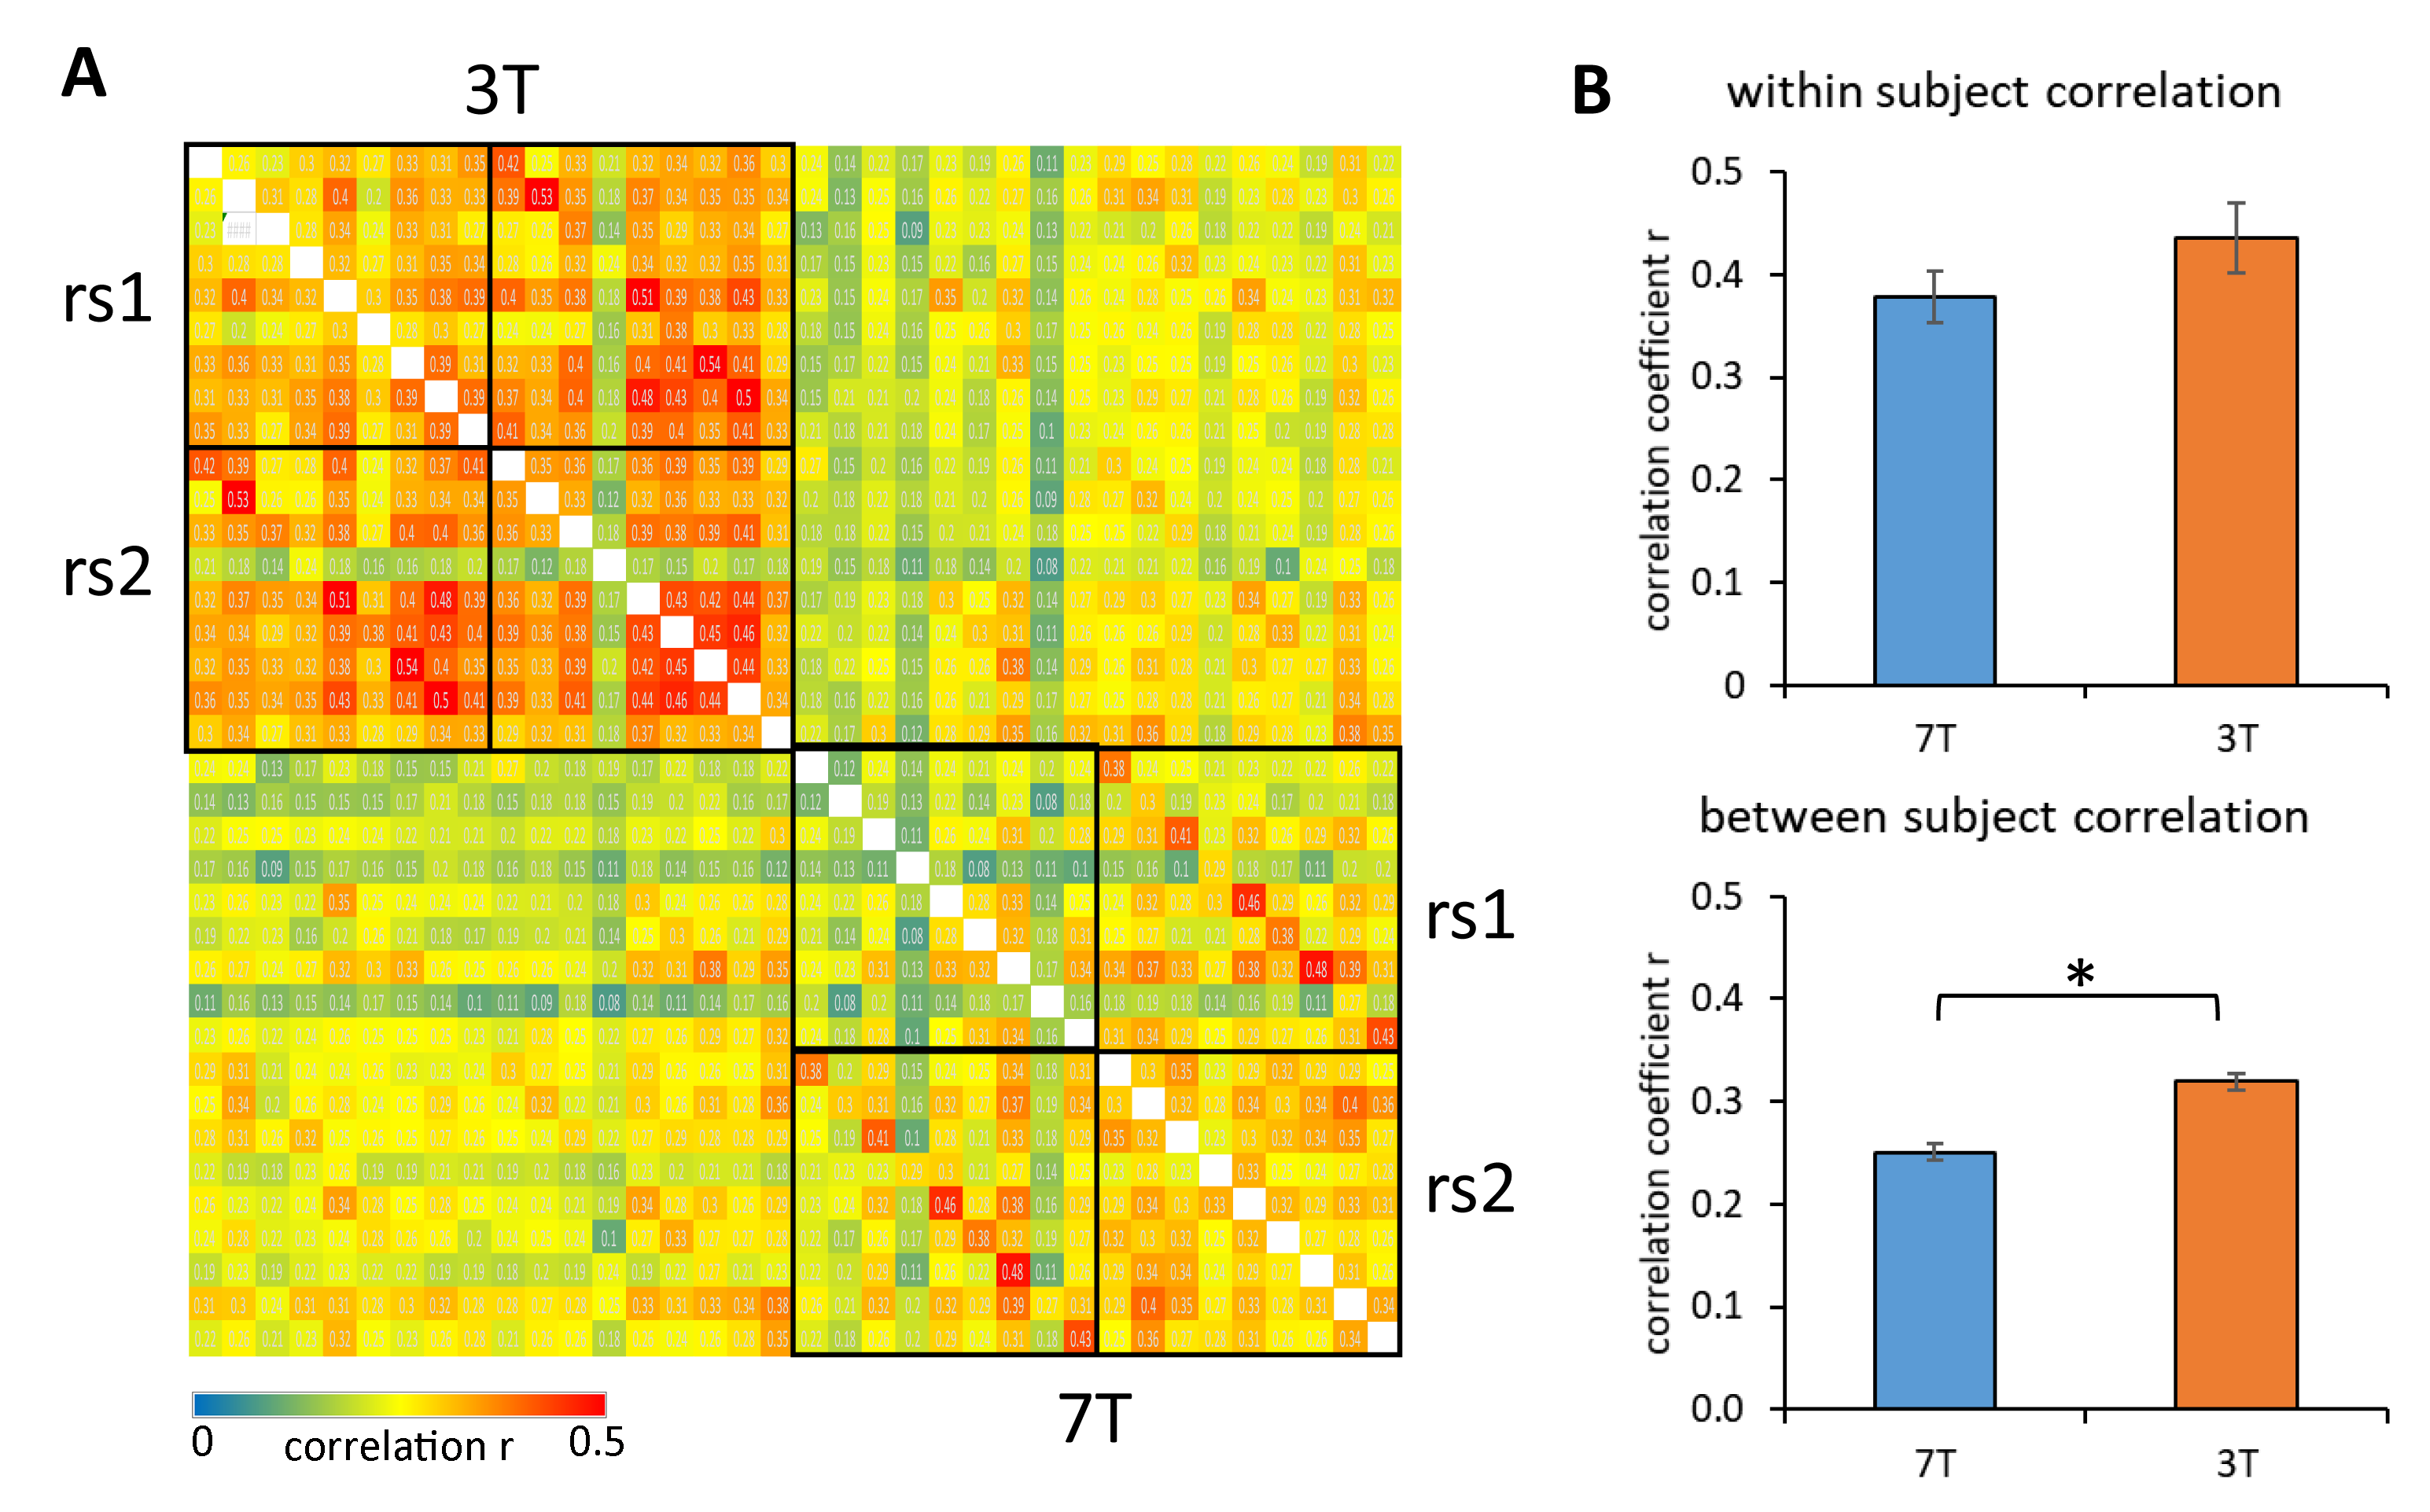
Fig. 4: Reproducibility of the RS scans. A) Cross correlation of RS connectivity matrices. B) Within and between subject correlation.