1247
Layer-dependent repetition suppression in the human visual cortex1Center for Information and Neural Networks, NICT, Suita, Japan, 2Graduate School of Frontier Biosciences, Osaka University, Suita, Japan, 3Kansei Fukushi Research Institute, Tohoku Fukushi University, Sendai, Japan
Synopsis
To examine the layer-dependent fMRI responses of face processing in human visual cortex, we acquired submillimeter functional and anatomical data at 7T. Here, we measured fMRI responses to left single and paired faces with various interstimulus intervals; furthermore, we calculated the repetition suppression (RS) ratio from three cortical layers in the right primary visual cortex (V1) and occipital face area (OFA). The fMRI response and RS ratio of superficial and middle layers of the right V1 were similar to those of all right OFA layers. Hence, the layers in different hierarchical visual areas were modulated in the same manner.
INTRODUCTION
The visual cortex is composed of different layers.1 These layers contain different types of neuron; thus, each layer could exhibit various functions with respect to the input–output of visual information flow. However, visual processing across different layers in the human brain has been poorly understood because neuroimaging modality such as conventional fMRI could not spatially resolve layer-dependent neural activities in the human brain. Using the ultra-high field (UHF) fMRI with submillimeter resolution can feasibly measure different layer responses due to its high signal-to-noise ratio and contrast-to-noise ratio. Moreover, repetition suppression (RS) phenomenon has been widely used to reveal the underlying neural mechanism of visual processing in the human brain.2 In this study, we examined the layer-specific responses of the paired-face stimuli with various interstimulus intervals (ISIs) in the human primary visual cortex (V1) and occipital face area (OFA) of right hemisphere to elucidate the face processing at the mesoscopic level using 7T fMRI.METHODS
Subjects: Ten volunteers with no history or evidence of neurological disorders participated in this study. Before the study commenced, all subjects provided an informed consent, and all experiments were approved by the National Institute of Information and Communications Technology.Data acquisition: We performed MRI experiments on a 7T whole-body MRI scanner (Magnetom, Siemens Healthcare, Erlangen, Germany) with a 32-channel receiver head coil (Nova Medical, Wilmington, MA, USA). Then, we obtained functional data at 0.8 mm isotropic resolution by using the EPI sequence with the following parameters: repetition time (TR) = 2 s; echo time (TE) = 21 ms; GRAPPA acceleration factor = 3; field of view = 120 mm, multi-band acceleration factor = 2; number of slices = 50. Meanwhile, anatomical data were acquired using magnetization prepared by two rapid acquisition gradient echoes (vendor supplied work-in-progress packages) with 0.7 mm isotropic resolution of T1-weighted sagittal section (TR = 5000 ms; TE = 3.43 ms, TI = 800/2600 ms; flip angle = 4/5°).
Study design: Block-designed stimuli of neutral faces in left visual field were presented. These stimuli were categorized into four types, namely, a single-face image and paired-face images with three different ISIs (67, 83, and 100 ms).
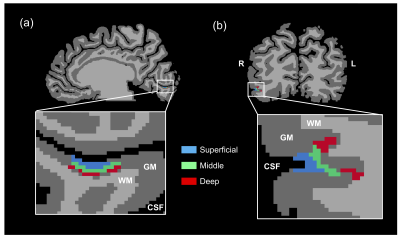
Data analysis: The functional data were preprocessed and accurately registered to a native anatomical space by using the FSL 5.0.10 (FMRIB, Oxford, UK). Right V1 and OFA were defined by a general linear model, with a p-value of <0.001. Furthermore, the anatomical data were segmented to various brain tissues for cortical thickness calculation after rescaling 0.5 mm isotropic resolution in BrainVoyager 21.2 (Brain Innovation B.V., Maastricht, Netherlands). Then, the defined right V1 and OFA were distinguished into three different cortical layers that corresponded to three granular structures (superficial, middle, and deep layers) according to cortical thickness (Fig. 1). Thereafter, we extracted beta values of all conditions and calculated the RS ratio by using the following equation (Eq. 1) from the three cortical layers. All beta values and RS ratio were averaged across the subjects. Meanwhile, we excluded two subjects who have outliers of fMRI responses and RS ratio.
(Equation 1) Repetition Suppression Ratio = (2 x betasingle - betapair) / (2 x betasingle) x 100
RESULTS
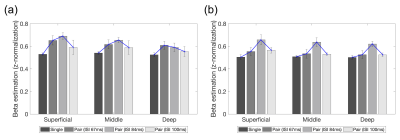
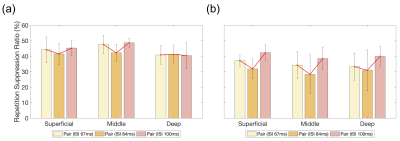
A similar trend of fMRI responses was found across the cortical layers in the right V1 and OFA, except for the deep layer of the right V1 (Fig. 2). Most of the layers in the right V1 and OFA showed increased responses from ISI 67 ms to 83 ms but decreased responses at ISI 100 ms. The RS ratio in the superficial and middle layers of the right V1 revealed a V-shape but not in the deep layer of the right V1; similarly, the ratio in all right OFA layers showed a V-shape (Fig. 3).DISCUSSION
The ISI-dependent fMRI responses of face processing in superficial and middle layers of the right V1 and OFA layers were similar but not in the deep layer of the right V1. The layer-specific responses indicated that the superficial and middle layers of the right V1 were functionally modulated by their similarity to the right OFA layers but not for the deep layer of the right V1. In addition, the similarity of RS ratio represents that these layers shared the similar dynamic modulation of face processing, considering that RS has been the important phenomenon to estimate the temporal characteristics of neuronal activity.2CONCLUSION
In this study, we first showed the ISI-dependent fMRI responses and RS ratio of face processing in different cortical layers of the right V1 and OFA at 7T. Results suggest that submillimeter fMRI at UHF with the ISI stimulus design could help elucidate the mesoscopic temporal characteristics of visual processing between different cortical layers in hierarchical visual areas.Acknowledgements
This study was partly supported by JSPS KAKENHI Grant Number JP18K07701, JP18H04084, and JP19H03537 (IK).References
1. Thomson AM, Neocortical layer 6, a review. Front Neuroanat 2010;4.
2. Grill-Spector, K, Henson, R, Martin, A, Repetition and the brain: neural models of stimulus-specific effects. Trends Cogn. Sci. 2006;10(1):14–23.
Figures


