1246
Laminar fMRI using layer-specific optogenetic stimulations1Neurology and Neurological Sciences, Stanford University, Stanford, CA, United States, 2Molecular and Cellular Physiology, Stanford University, Stanford, CA, United States, 3Helen Wills Neuroscience Institute, University of California, Berkeley, CA, United States, 4Bioengineering, Stanford University, Stanford, CA, United States, 5Neurosurgery, Stanford University, Stanford, CA, United States, 6Electrical Engineering, Stanford University, Stanford, CA, United States
Synopsis
We attempted to establish the mesoscale layer-specific fMRI representation of neuronal activity using layer-specific Cre-driver mouse lines, optogenetic stimulations, fMRI and electrophysiological recordings. Although laminar fMRI responses were distinct during L2/3, L4, L5 and L6 stimulations, all fMRI responses increased along the cortical depth. This phenomenon was, however, not observed in LFP and spike recordings. This discrepancy between fMRI, LFP and spiking may be due to the draining veins transporting deoxyhemoglobin from the deeper layers to the superficial layers. Future studies may take into account of neurovasculature to elucidate the exact mechanisms of mesoscale layer-specific neurovascular coupling.
INTRODUCTION
Neocortex consists of six interconnected but distinct layers that has different projections and functions. Historically, it has been difficult to selectively modulate each layer since they are anatomically intermingled. Recent advances in molecular genetics have made it possible to selectively express transgenes in L2/3, L4, L5 and L6 of the neocortex1-4, including Cre-recombinase driver lines and optogenetic tools. Conventional fMRI is not used to study cortical layers as it is performed at a macroscopic scale spatial resolution. Recent developments of high spatial resolution fMRI provide new opportunities for in vivo measurements of mesoscale layer-specific cortical responses5-7. However, the laminar fMRI representation of neuronal activity has not been established. Here, we combined targeted optogenetic stimulation of M1 L2/3, L4, L5 and L6, and in vivo fMRI and electrophysiological recordings to explore the relationship between layer-specific mesoscale fMRI and neuronal activities.METHODS AND MATERIALS
To selectively activate L2/3, L4, L5 and L6 of M1, we used mice expressing Cre-recombinase under control of Drd3, Scnn1a, Rpb4 and Nstr1 receptor elements, respectively. AAV5 virus was injected to express opsin ChR2 in Cre-positive neurons to enable selective layer-specific optogenetic control of M1. Optical pulses were delivered at 5 Hz, 10 Hz, 20 Hz or 40 Hz (30% pulse width duty cycle; light intensity, 30-50 mW/mm2). fMRI data were acquired using a single-shot Gradient-Echo Echo-Planar-Imaging (GE-EPI) sequence with FOV = 20 × 20 mm2, matrix = 75 × 75, slice thickness = 1 mm, flip angle = 40°, TE = 14 ms, TR = 1,000 ms. For electrophysiology, an optrode composed of an optical fiber glued to the 16-channel linear-array electrode was used.RESULTS
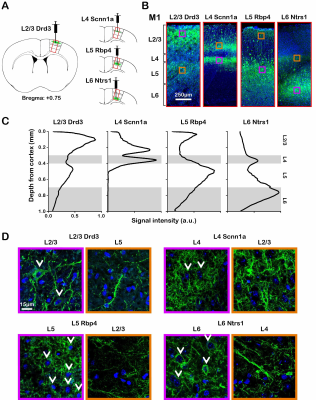
Histological and immunohistochemical examination confirmed ChR2 expression
ChR2-EYFP was localized to the neurons in their respective layers and their intra-cortical projections (Figure 1). Specifically, ChR2-EYFP expression is observed in L2/3 M1 neurons and L5 projections for the Drd3 L2/3 Cre-line, in L4 M1 neurons and L2/3 projections for the Scnn1a L4 Cre-line, in L5 M1 neurons and L2/3 projections for the Rbp4 L5 Cre-line, and in L6 M1 neurons and L4 projections for the Ntrs1 L6 Cre-line.Layer-specific optogenetic stimulations evoked distinct laminar fMRI responses
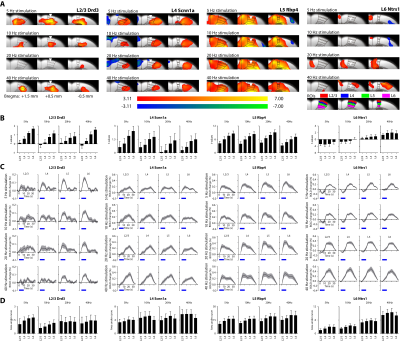
To examine layer-specific fMRI representation of neuronal activity, we first analyzed the local fMRI responses during layer-specific M1 stimulations (n = 12 for each layer-specific Cre-line). Local fMRI activation maps and BOLD signal profiles extracted from anatomically defined ROIs show that layer-specific and frequency-specific M1 stimulations activates distinct local responses (Figure 2). Interestingly, all fMRI responses increased along the cortical depth (Figure 2B). In addition, the initial negative BOLD response during L6 stimulation reduced and became positive along the cortical depth. This phenomenon is also observed with increasing stimulation frequency. No evoked responses were observed in the naïve animal, indicating that the observed responses were not heat induced artifacts or undesired light-induced activations8,9.Distinct LFPs and spiking patterns along the cortical depth induced by layer-specific optogenetic stimulation
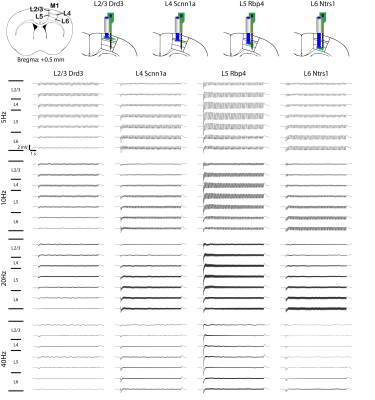
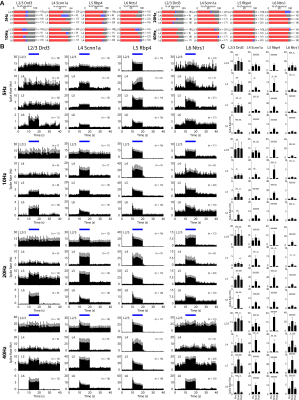
To explore the neuronal origins of such layer-specific fMRI responses, we analyzed in vivo extracellular electrophysiological recordings obtained along the local M1 cortical depth simultaneous (Figure 3; n = 4 animals per Cre-line). The LFP amplitude decreased along the cortical depth during L2/3 stimulation, while the amplitude increased along the cortical depth during L4 and L6 stimulation (Figure 3). For L5 stimulation, it peaked around L5.Besides LFP, spike recordings obtained along the M1 cortical depth were analyzed to probe the neuronal origins of such laminar fMRI responses. Across all recorded units, over half exhibited a significant increase in firing rate (Figure 4A; n = 4 animals per Cre-line). In general, the spike rates significantly increased in all layers during L2/3, L4, L5 and L6 stimulations across all frequencies (Figure 4B-C).
No evoked responses were observed in the naïve animal, indicating that the observed responses were not photovoltaic induced artifacts or undesired light-induced activations10,11.
DISCUSSION
More recently, neurovascular coupling research has expanded to using laminar fMRI methods5-7,12-16. Despite the relatively low fMRI spatial resolution (200 × 200 µm2) in this study and the potential partial volume effects in resolving M1 cortical layers of mice, as the thinnest layer is ~100 µm (L4) and the thickest layer is ~300 µm (both L5 and L6)17, we still attempted to establish the laminar fMRI representation of neuronal activity through estimations. Although laminar fMRI responses were distinct during L2/3, L4, L5 and L6 stimulations, all fMRI responses increased along the cortical depth. This phenomenon, however, was not observed in LFP and spike recordings. Despite distinct M1 recordings were observed during layer- and frequency-specific stimulations, LFP responses and the increase in spiking were detected across all cortical layers. Since the draining veins travels from deeper layers to the cortical surface18, L6 neurons would be the first to consume the oxygen through the supply of nearby capillaries. This leaves deoxyhemoglobin in the blood stream to be transported upwards to the superficial layers, potentially causing an initial negative or decrease in BOLD at the superficial layers (Figure 2). Our results provide insights and feasibility in studying neurovascular coupling at the mesoscale. Future studies may take into account of neurovasculature to elucidate the exact mechanisms of layer-specific neurovascular coupling.Acknowledgements
No acknowledgement found.References
1. Gong, S. et al. Targeting Cre recombinase to specific neuron populations with bacterial artificial chromosome constructs. The Journal of neuroscience : the official journal of the Society for Neuroscience 27, 9817-9823, doi:10.1523/JNEUROSCI.2707-07.2007 (2007).
2. Madisen, L. et al. A robust and high-throughput Cre reporting and characterization system for the whole mouse brain. Nature neuroscience 13, 133-140, doi:10.1038/nn.2467 (2010).
3. Pluta, S. et al. A direct translaminar inhibitory circuit tunes cortical output. Nature neuroscience 18, 1631-1640, doi:10.1038/nn.4123 (2015).
4. Adesnik, H. & Scanziani, M. Lateral competition for cortical space by layer-specific horizontal circuits. Nature 464, 1155-1160, doi:10.1038/nature08935 (2010).
5. Huber, L. et al. High-Resolution CBV-fMRI Allows Mapping of Laminar Activity and Connectivity of Cortical Input and Output in Human M1. Neuron 96, 1253-1263 e1257, doi:10.1016/j.neuron.2017.11.005 (2017).
6. Muckli, L. et al. Contextual Feedback to Superficial Layers of V1. Current biology : CB 25, 2690-2695, doi:10.1016/j.cub.2015.08.057 (2015).
7. De Martino, F. et al. Frequency preference and attention effects across cortical depths in the human primary auditory cortex. Proceedings of the National Academy of Sciences of the United States of America 112, 16036-16041, doi:10.1073/pnas.1507552112 (2015).
8. Christie, I. N. et al. fMRI response to blue light delivery in the naive brain: implications for combined optogenetic fMRI studies. NeuroImage 66, 634-641, doi:10.1016/j.neuroimage.2012.10.074 (2013).
9. Schmid, F. et al. True and apparent optogenetic BOLD fMRI signals. Magnetic resonance in medicine 77, 126-136, doi:10.1002/mrm.26095 (2017).
10. Kozai, T. D. & Vazquez, A. L. Photoelectric artefact from optogenetics and imaging on microelectrodes and bioelectronics: New Challenges and Opportunities. Journal of materials chemistry. B 3, 4965-4978, doi:10.1039/C5TB00108K (2015).
11. Mikulovic, S. et al. On the photovoltaic effect in local field potential recordings. Neurophotonics 3, 015002, doi:10.1117/1.NPh.3.1.015002 (2016).
12. Goense, J. B. & Logothetis, N. K. Laminar specificity in monkey V1 using high-resolution SE-fMRI. Magnetic resonance imaging 24, 381-392, doi:10.1016/j.mri.2005.12.032 (2006).
13. Kok, P., Bains, L. J., van Mourik, T., Norris, D. G. & de Lange, F. P. Selective Activation of the Deep Layers of the Human Primary Visual Cortex by Top-Down Feedback. Current biology : CB 26, 371-376, doi:10.1016/j.cub.2015.12.038 (2016).
14. Polimeni, J. R., Fischl, B., Greve, D. N. & Wald, L. L. Laminar analysis of 7T BOLD using an imposed spatial activation pattern in human V1. NeuroImage 52, 1334-1346, doi:10.1016/j.neuroimage.2010.05.005 (2010).
15. Koopmans, P. J., Barth, M. & Norris, D. G. Layer-specific BOLD activation in human V1. Human brain mapping 31, 1297-1304, doi:10.1002/hbm.20936 (2010).
16. Koopmans, P. J., Barth, M., Orzada, S. & Norris, D. G. Multi-echo fMRI of the cortical laminae in humans at 7 T. NeuroImage 56, 1276-1285, doi:10.1016/j.neuroimage.2011.02.042 (2011).
17. Yamawaki, N., Borges, K., Suter, B. A., Harris, K. D. & Shepherd, G. M. A genuine layer 4 in motor cortex with prototypical synaptic circuit connectivity. eLife 3, e05422, doi:10.7554/eLife.05422 (2014).
18. Schmid, F., Tsai, P. S., Kleinfeld, D., Jenny, P. & Weber, B. Depth-dependent flow and pressure characteristics in cortical microvascular networks. PLoS computational biology 13, e1005392, doi:10.1371/journal.pcbi.1005392 (2017).
Figures


